0LCE trade ideas

TJX Reports Above-Plan Q2 FY19 Results; Raises Full-Year EPS TJX: The TJX Companies, Inc.
2018-08-21 08:30:00
The TJX Companies, Inc. Reports Above-Plan Q2 FY19 Results with Comp Sales Growth of 6% and EPS of $1.17; Raises Full-Year EPS and Comp Guidance

TJX: Sort opportunityAn intraday high potential, Back Tested Sort Analysis.
We ll try to enter into the correction of the uptrend movement.
DETAILS ON THE CHART
NOTE: Entry range area above the entry point, is calculated upon 80% of the recorded pullback back tested past performances
DISCLAIMER: This is a technical analysis study, not an advice or recommendation to invest money on.

TJX Detected possible increase in guidance!!!TJX: tjx companies
2018-02-28 08:37:04
Detected possible increase in guidance

TJX Stochastic Trending DownTJK Overbought Condition
Waiting For New Number And Color
Color Green
Number None

So far a great gap down If this gaps below 66.76 this is a close your eyes and buy the open trade. I see support at around $64 level.

Reversal and going up! Hey guys!
I am buying this trade. As you can see form the chart that it it is a reversal heads/shoulders at the end of an impulse wave. Interestingly it is also the end of the C wave. It also makes a divergence at the bottom.
I say this is a good buy. I am buying at the current market price for today.
Entry: $70.40
S/L: $66.50
PT: $79.00

IMPORTANT BOTTOMING AREATHIS IS ONE RETAILER THAT WHILE DOWN HASN'T BROKEN TO MAJOR NEW LOWS. THE AREA AROUND
73 HAS PROVEN MEANINGFUL SUPPORT. ON THE FUNDAMENTAL SIDE, THIS IS WHERE PEOPLE GO WHEN
THEY DON'T WANT TO PAY UP AT $M OR $JWN.
I FAVOR THE 7/75 CALLS NOW TRADING @ $.85...OZ


TJX - short from 77.50 TJX forming a bear flag, it has a sharp drop & now consolidating. Money-flow has neg-divergence & going down in the negative side. It also has insider selling.
We think it will decline from here & can drop as low as 73
You can check our detailed analysis on TJX in the trading room/ Executive summery link here-
www.youtube.com
Time Span: 3:10"
Trade Status: pending


Will Price Hold Long Term Horizontal Support?If u don't like this number n you think the market will head south and retest August low $54 is your next dream entry but if you want to take advantage from these ugly selloff now seems a good entry.

After BO and fail found support to start Mayinto earnings Measured Move higher looks to 69.10. June 67.5 Calls active

MPEL Day Trade Retest Gap (Brad Reed Feb25,2015)MPEL expected to open at 24.03 for a Retest Gap. To learn this strategy for free go to www.RealLifeTrading.com


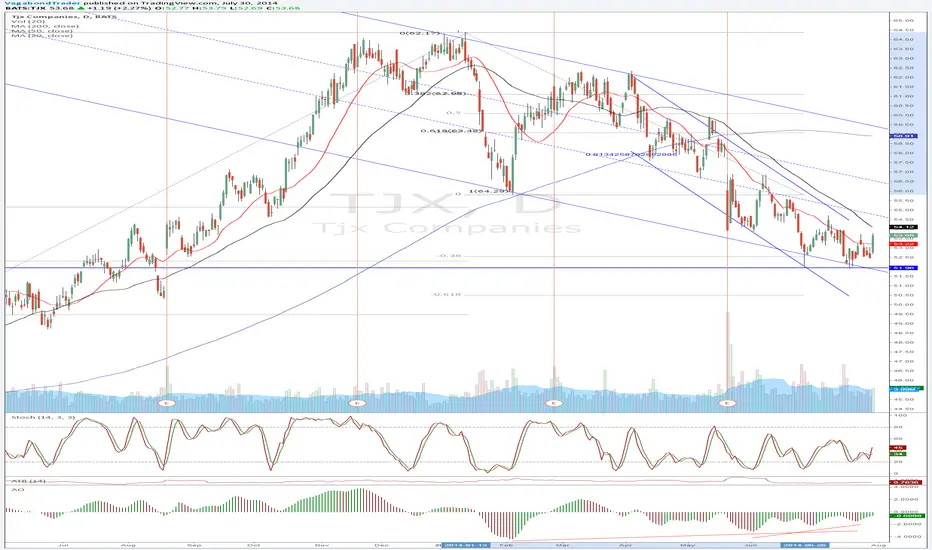
TJX - double bottom forming in long term uptrendDouble Bottom
Status: Closed Long
Horizontal S&R: monthly
Channel S&R: yes
MA S&R: no
Stochastic turn/crossover above 80%: no
AO divergence >0= 85: yes
Price Fib Ext >1.382: yes
Next Earnings date: 8/19/14
Increasing EPS: no - missed
Increasing Rev: no - missed
www.estimize.com
*stop 1 atr below swing low.
** first price target is 50% the move from entry price to previous high.
***No Biotech
Any feedback is welcomed! Thx
Cost basis: 53.35
Stop:
First price target: