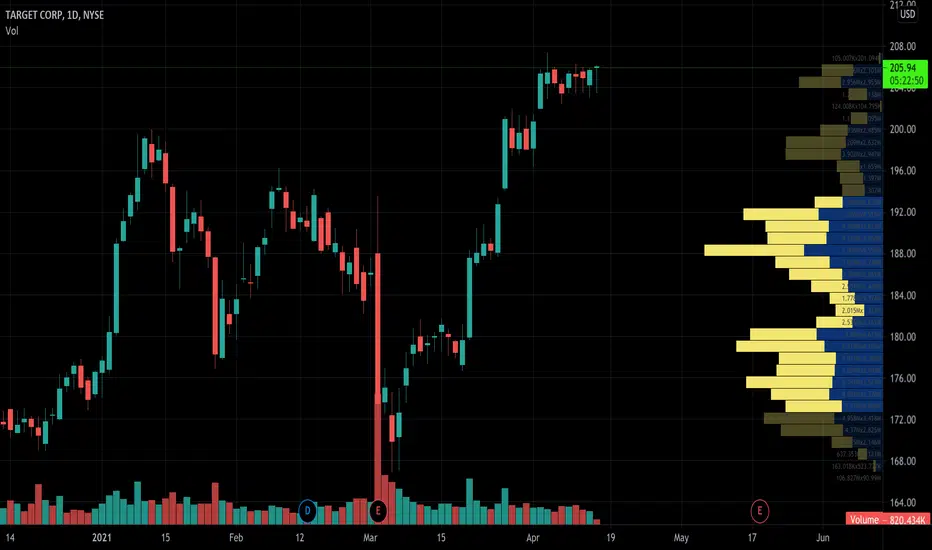
TGT ShortUptrend Wedge break down + revisit
RSI divergence
Short 216
Stop 220
Target 180
Risk management is much more important than a good entry point.
The max Risk of each plan should be less than 1% of an account.
I am not a PRO trader. I trade option to test my trading plan with small cost.
0LD8 trade ideas


Target beats Q1 earningsTarget Beats. Target (TGT) reported Q1 April 2021 earnings of $3.69 per share on revenue of $24.2 billion. The consensus earnings estimate was $2.26 per share on revenue of $21.3 billion. Revenue grew 23.4% on a year-over-year basis.
R3 = $221.89
R2 = $217.59
R1 = $213.28
pivot = $209.41
S1 = $205.29
S2 = $200.99
S3 = $196.70
Do your own due diligence, your risk is 100% your responsibility. This is for educational and entertainment purposes only. You win some or you learn some. Consider being charitable with some of your profit to help humankind. Good luck and happy trading friends...
*3x lucky 7s of trading*
7pt Trading compass:
Price action, entry/exit
Volume average/direction
Trend, patterns, momentum
Newsworthy current events
Revenue
Earnings
Balance sheet
7 Common mistakes:
+5% portfolio trades, capital risk management
Beware of analysts motives
Emotions & Opinions
FOMO : bad timing
Lack of planning & discipline
Forgetting restraint
Obdurate repetitive errors, no adaptation
7 Important tools:
Trading View app!, Brokerage UI
Accurate indicators & settings
Wide screen monitor/s
Trading log (pencil & graph paper)
Big organized desk
Reading books, playing chess
Sorted watch-list
Checkout my indicators:
Fibonacci VIP - volume
Fibonacci MA7 - price
pi RSI - trend momentum
TTC - trend channel
AlertiT - notification
www.tradingview.com


TGT - Parabolic Steps PT 257This pattern will take some time to play out but the direction is clear. Chart formation implied a final move for 257 PT. GL!

TGT Long IdeaTGT has been on a bull run the past few weeks and it currently trading at ATH. Price just broke ascending triangle, gapped up and now is on a bull flag setup.
1. Price trading at ATH and now forming a bull flag.
2. Caution; Red candle on the 1hr chart with big red volume. Price might do a quick retest on 207-206 area for the next move up. However, on a longer term, daily candle shows big green candle with a bigger than last green volume. (bullish, mid term)
3. RSI on Daily and Hourly time frame is around the 70 level. (near overbought)
Scenario:
1. Breakout play; entry zone just above 209.59 resistance level.
2. Pullback play; entry once price gets rejected from the 206-207 resistance area.
Target1; 215.80 area with rejection candle
Target2: 219.63 with trend continuation.


TGT Bull Flag Target looks like a Bull Flag Pattern. Target is currently at the $200 level. There is a hard resistance around this $201 level (as you can see, we have failed to move above it previously 3 times in the recent period). If we are able to hold this level and with more volume, the fibs indicate a breakout to $210 is possible. However if we can't hold this level and get rejected, we will probably retrace back to this $196-197 level where the 61.80% fib re-tracement lies.
Support: $198.40, $196.05
Resistance: $201.38, $201.79

$TGT Target - Breakout Retest -> Bounce$TGT Target - Breakout Retest -> Bounce
Broke out last week and closed above $200 resistance. Dipped this week but closed back above $200. Expect to see a strong move into the $200s over the next few weeks.
Medium term target - $240 possible by late July
Note: This is NOT investment advice. Educational only.


TGT 1DTGT looks really strong here. it needs to hold 200$ so I will be looking for a re test of the old resistance (200) where now it should be new support for a move to 210-220.


DinOsaUr mean up to 199 or higherAfter hours of research and technical data, I have come to the conclusion of dINosaUr.

TGT price target of 204$TGT broke out from a falling wedge and the price target is around 200$ to 204$ before we experience some turbulence.

TGT over 189.00Retail charts are looking strong into the next week and may benefit from stimulus spending. Looking for TGT to back test the ~185 level after it ripped last session. 189.00 area is a high volume node to watch out for and enter over.

$TGT$TGT breaking through my 174 entry today. If we can bounce off the 176.90 level, I expect to see more upside!

$TGT with neutral outlook following a its earnings #StocksThe PEAD projected a neutral outlook for $TGT after a positive over reaction following its earnings release placing the stock in Drift B
If you would like to see the Drift for another stock please message us. Also click on the Like Button if this was useful and follow us or join us.

Target Price Prediction Looks like Target is bouncing off the support and off of the .5 retracement.

$TGT- Target Corp - (Earnings Sell off & Wedge Example)3/2/21
$TGT- Target Corp - 6.771% Decliner
Catalysts:
1. What I have personally noticed that after earnings beats:
If earnings are not exceptional, you will often see a sell off where there is profit taking, shorts covering and shorts entering. Combined with the chopiness we saw this past week and today with SPY and QQQ, the sell off shouldn't have came as too much of a suprise. Price was able to recover somewhat later in the session.
2. Target chose to withdrew 2021 fiscal guidance, "in light of the highly fluid and uncertain outlook for consumer shopping patterns and the impact of COVID-19."
Not worrisome to most but something worth noting that definitely did not help the sell off we saw on the open.
3. Price was already in a downtrend and broke the lower trendline of wedge shown in chart. A bearish signal.
A bullish note:
I see Target as a great buy at this price. This was a solid earnings beat with an increase in revenue and sales and a beat on EPS.
Earnings highlights:
-Target's 2020 sales growth of more than $15 billion was greater than the Company's total sales growth over the prior 11 years.
-Comparable sales grew 20.5 percent in the fourth quarter, reflecting comparable stores sales growth of 6.9 percent and digital sales growth of 118 percent.
-Total revenue of $28.3 billion grew 21.1 percent compared with last year, driven by sales growth of 21.0 percent and a 28.7 percent increase in other revenue. -Operating income was $1.8 billion in fourth quarter 2020, up 53.2 percent from $1.2 billion in 2019.
Analyst are also bullish. The majority of analyst ratings are all upgrades and increase in PT's anywhere from $195-$230.
-I'm going to be taking a look at some of the top daily gainers (may throw in some losers occasionally) of the day on their daily charts and posting them here throughout March. This is not advice. Just analyzing price action and patterns.
-I will try to vary the catalysts (analyst upgrades, earnings, clinical trial results, etc.) for the stock moving (if any) and the sector that the stocks are in.
-You'll notice I try to keep my charts as simple as possible. Black background and no grid. I will be focusing solely on price action, patterns, and support and resistance levels.
No moving averages, MACD, volume profiles, Bollinger bands, etc.
Please feel free to comment or leave suggestions. I am always looking to improve. Thanks.
