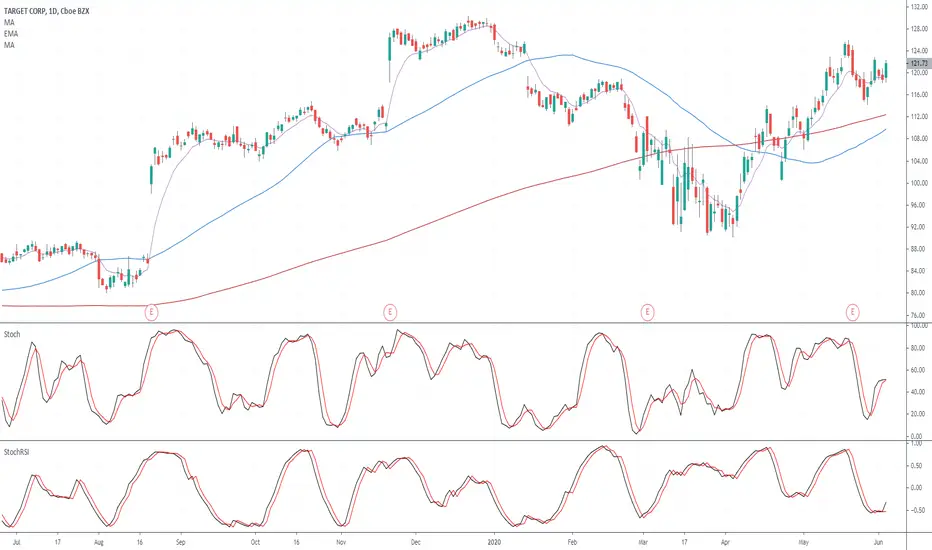
TGTTGT has been forming a nice consolidation lately with a strong resistance area from around 122.80 to 123.60. Looking for a continuation of the strong bullish day yesterday after today's panic sell brought it down. Note the 20SMA looking ready to cross up the 50MA, which can help push it past the resistance area and possibly make a run to 126.
0LD8 trade ideas


Earnings Play for TGTI grabbed in the money options before the breakout. weekly close above 123 confirms move. Target $132. In the money options help against theta decay but cost more up front. This is an earnings play. options that expire August 21 or 28 have lowest theta. Risk/Reward is 3.00 stop loss is low 119's. So long as weekly close is above 123, the 119 stop loss is reasonable. if this falls back into the wedge you can add another call around 116 and set a different stop loss, but the safer play is playing the breakout with confirmation. there were 2 hourly candles that close above the resistance along with strong bull volume on the last 2 hour candle.


If this doesn't jump from hereThen i'm reading things incorrectly, holding some $125's into next week, might move another week out tomorrow if I can get a couple dollar move tomorrow. Earnings is far enough out that I think it will make a decision before then

Another TGT viewSince the jump off of the November 2019 earnings, the volume weighted price is basically where it is sitting right now. I am leaning positive on Target from COVID as a big retailer similar to Costco/WMT. We'll see from here

TGT on watch to push to new highs as wellHolding a long term consolidation, ready to go with a market continuation


$TGT RUN! ($WMT $COST )see full chart at www.tradingview.com
TGT
Entry $117.84
Target $122
stoploss $116
Why this play?
TGT had an amazing ER last quarter and a strong forecast ahead. They are a strong company with an amazing website, easy to order and trendy.
this company performed really well during Corona and i wouldn't be surprise to see them hit ATH again.
Target Q1 Comparable Sales Grew 10.8%, Digital Comparable Sales Grew 141%
First quarter comparable sales grew 10.8 percent, driven by a 12.5 percent increase in average basket, as guests made fewer, bigger shopping trips.
Store comparable sales increased 0.9 percent. Digital comparable sales grew 141 percent, accounting for 9.9 percentage points of Target's comparable sales growth.
Digital comparable sales accelerated every month in the quarter, from 33 percent in February to 282 percent in April.
Stores fulfilled nearly 80 percent of Target's first-quarter digital sales.
Same-day services (Order Pick Up, Drive Up and Shipt) grew 278 percent and accounted for approximately 5 percentage points of total Company comparable sales growth.
What is TGT
Target Corporation operates as a general merchandise retailer in the United States. The company offers food assortments, including perishables, dry grocery, dairy, and frozen items; apparel, accessories, home decor products, electronics, toys, seasonal offerings, and other merchandise; beauty and household essentials; The company also provides in-store amenities, such as Target Cafe, Target Optical, Starbucks, and other food service offerings. It sells its products through its stores; and digital channels, including Target.com.

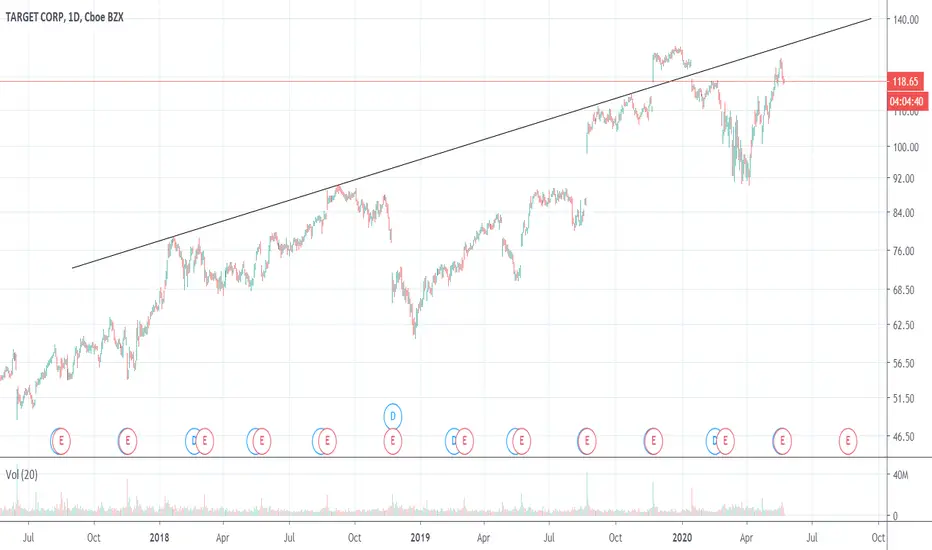
Target: Volatility Squeeze and a Golden CrossBig-box retailer Target has been amazingly stable for the last two months. It’s squeezed into a triangle on either side of $120, lurking below its 2019 high of $130.24.
During that time, its 50-day simple moving average (SMA) rose up and above the 200-day SMA. That kind of “Golden Cross” can signal longer-term momentum is turning more bullish.
TGT also has some fundamental reasons to pause. In recent years, CEO Brian Cornell spent heavily on digital transformation. This succeeded in terms of moving shoppers to the Internet and helped boost store traffic. However the last two quarters have seen product mix veer sharply toward lower-margin products (like food over toys, apparel and electronics).
Some of those headwinds could fade now that inventories have been written down and the U.S. economy staggers toward reopening. Now could be the time for margin expansion, as shoppers start perusing aisles again and the years of IT spending pay off.
This creates an interesting risk/reward in TGT. Its tight range creates the potential for gains to accelerate as price action widens and earnings approach on August 19. (Notice extremely tight Bollinger Band Width).

Target - waiting for a breakout$TGT has taken the 50day EMA support few times and held on to that.
Last 2 bars are green and trying for a breakout again for the rectangle top as target.
But we have few bars below that height too.
I will around 119.4 to 121.5 as target.
SL 3rd bar low (the first red bar from right)
A big move only after rectangle breakout.
I need to watch for that.

$TGT Will target break the wedge?!?!The wedge is getting tighter! Will we break the wedge up or down? Really excited to see what happens in the near future!


TGT: Descending triangleDescending triangle on descending volume
Descending ATR
May signal a trend reversal
Cons:
200MA = bullish
250RSI = bullish
If confirmed
Targer = 99$

TGT - We may become bearishWe were previously optimistic about NYSE:TGT and managed to get out at a break-even point.
If it drops below 114 we're gonna' look to enter into a short.
That would take us to 106 as next support.


TGT - BUYWe entered into a long-term Target position yesterday.
Riots and COVID will cause small shops to go out of business or close up during repairs. Therefore, people will turn to the larger chains.
Target is the type of store you go in looking for one thing and come out with 10. That's only going to increase as there become less small business to compete with.
If anything, it's a good place to store come cash in between positions.
You could also wait for a clean break-through of 130 before entering.