$TGT Oversold Finding Support$TGT Oversold Finding Support
Assuming trendline holds, price target $128.00 by end of May.
0LD8 trade ideas

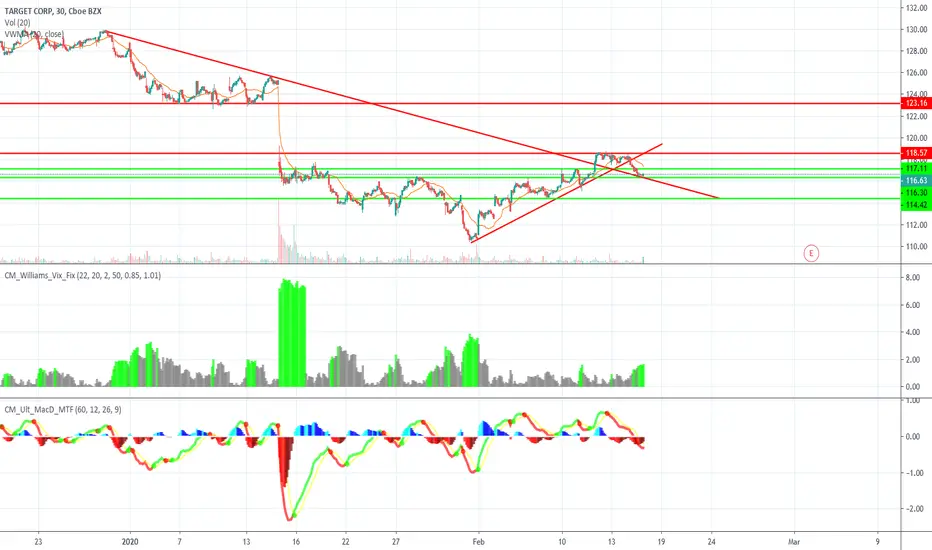
TGT LongSimple ABC Correction + Support + Bullish Momentum + Divergence (Lower Time Frames)
Initial Price Target: 124.12
Secondary Target: 128

GoNoGo suggests Target is oversoldIs Target oversold? GoNoGo Trend is a “Go” but in all trends there are counter trend corrections. The red arrow above the last bar shows that the GoNoGo Oscillator was at an extreme and suggests that Target may move lower over the next few bars.
If this happens look for the GoNoGo Oscillator to bounce off zero and a green circle for a possible entry into the trend.

TGT Movement predictionsEarnings didn't show immediate positive results but summer time spending will jump

BUY with TARGET DailyHello traders, TRAGET has been forcefully rejected by sellers it is plausible that she will pull back and go up
Please LIKE & FOLLOW, thank you!


Speculative Wave Analysis on TGT (Buy in Pullback)...!Buy in pull-back (112 nearby)
Expected advanced predicted HH at (120 nearby) .
The price already entered into bullish because Previous LH 119 and CMP 119 nearby .


TGT possible pre earnings playIt has broken out of the resistance channel and gapped up off the resistance. I'd say this is Bullish. A backtest here definitely looks like a buy if you feel so inclined. stop loss area is a break of $113.


Buy TargetTarget Corporation (NYSE: TGT)
Target Corporation is a well known discount store that been around over 100 and went public around 1967.
JesusTrade Score:
Buy
Scale Score
Risky (7/10)
Portfolio Hold:
Monthly Swing
Fundamental Reasoning:
With earning around the corner, their numbers need to be payed attention (up the trade score due to earning being need). Year over year, store sales are up 20% and online sales up 200% April 2019 compare to April 2020, Target store sales are up 5% and Online sales up 4%. With rumor of recession around the corner and COVID-19 still active. This should be a good pick up.

HEAD & SHOULDERSA head and shoulders pattern is a chart formation that resembles a baseline with three peaks, the outside two are close in height and the middle is highest. This pattern is believed to be one of the most reliable trend reversal patterns, and predicts a bullish-to-bearish trend reversal.

%TGT I H&S AND CHANNEL Historically, the $TGT stock has been in this channel for quite some time. (white for dummies) When it broke out of this channel, it reached an all time high. Then we can clearly see a nice inverse head and shoulders. Next target would be $64 if falls back in here.

$TGT Trading At Key Trendline Support$TGT has sold off to key trendline support and this is a dip worth buying. There's a lot to like with $TGT.
Target (NYSE:TGT) says it has been experiencing unusually strong traffic and sales as customers stock up on items like food, medicine, cleaning products and pantry items.
As a result, the retailer is adjusting the expected timing of some of its strategic initiatives, to support the team and minimize potential disruptions in their work. Target now expects to do 130 store remodels in 2020 vs. the previous expectation of ~300 and open 15 to 20 new small format stores this year vs. the 36 previously announced.
Target says comparable sales are more than 20% higher Y/Y in March so far, with comparable sales in essentials and food & beverage up more than 50%. During that same period, comparable sales in apparel & accessories are down more than 20%. The retailer warns that continued sales declines in higher-margin discretionary categories could result in lower-than-expected gross margin dollar performance for the remainder of the quarter.
Target is pulling guidance due to the unusually wide range of potential outcomes for Q1. The company is also suspending share repurchase activity in the current environment.
Credit Suisse digs into Target (TGT -6.7%) after the company was one of the first large retailers to provide an update on financial performance since COVID-19.
CS points to Target's significant sales upside due to essentials/food purchases, but also notes the higher costs that limit the short-term EPS upside.
"These are not data points that can be extrapolated forever, but we believe that the longer-term implications are more positive in our view, given TGT's ability to fulfill such significant demand," writes analyst Seth Sigman.
The firm keeps an Outperform rating on Target and price target of $125 (33% upside potential).
As always, trade with caution and good luck to all!

Target Clings to Support, With Gap Looming BelowTarget reported decent earnings this week, but not a lot of buyers showed up. Now traders may want to watch for a potential breakdown with the big-box retailer near a key price zone.
TGT gapped from $86 to $100 last August on signs that its big digital push had paid off. It followed that with another strong quarterly report on November 20.
Since then, however, things haven't been so hot. TGT peaked around $130 a week before Christmas. It then announced in mid-January that the key holiday-shopping season missed estimates. The shares gapped down, bounced feebly and then continued lower to a potentially important level around $105.
This zone could be crucial because it's near the 200-day simple moving average (SMA) and the price area shortly after the August gap.
The recent price action is also potentially bearish because TGT tried to rally after earnings three days ago, but hit resistance around the old $111 support area from January 31.
Relative strength has been poor over the course of 2020, with TGT trending lower even as the S&P 500 hit new highs in January and February. It also faces potential risk from the spread of coronavirus.
Still, there isn't confirmation yet. Traders shopping for downside in TGT may want to wait for a close below the 200-day SMA.

TGT ToppingThis looks like a clear head and shoulders top in TGT. The neckline was tested on Tuesday and today was an inside day. Looking for follow through. A close below the 200-day moving average would probably be a great signal to go short.

THE WEEK AHEAD: TGT EARNINGS; XLE, XOP, EEM PREMIUM SELLINGEARNINGS:
TGT (93/52) and COST (91/44) announce earnings next week, with a directionally neutral TGT short strangle shown here paying 3.87 at the mid price, delta/theta 1.01/9.64.
EXCHANGE-TRADED FUNDS ORDERED BY RANK AND SHOWING THE FIRST EXPIRY IN WHICH THE AT-THE-MONEY SHORT STRADDLE PAYS GREATER THAN 10% OF THE STOCK PRICE:
XLE (99/55), April
XOP (97/79), April
XMH (95/54), April
FXI (95/40), May
GDXJ (95/50), April
EWW (95/43), April
USO (91/48), April
EWZ (90/48), April
GDX (89/46), April
XLU (88/26), June
BROAD MARKET ORDERED BY RANK AND SHOWING THE FIRST EXPIRY IN WHICH THE AT-THE-MONEY SHORT STRADDLE PAYS GREATER THAN 10% OF THE STOCK PRICE:
EFA (100/38), June
EEM (95/44), April
IWM (88/42), April
QQQ (83/47), April
SPY (80/42), May
FUTURES ORDERED BY RANK:
/GC (100/20)
/ES (113/40)
/CL (100/51)
/ZC (68/18)
/SI (68/28)
/NG (67/49)
/ZW (11/28)
VIX/VIX DERIVATES:
VIX finished the week at a whopping 40.11 with the /VX term structure in backwardation, so it's an opportunity to add short call verticals or long put verticals in VXX and UVXY if you haven't already done so. For existing spreads (I've got a few), I'll be looking to play the elevator up/down game, rolling the long call aspect of my VXX credit spreads up to lock in profit on that side of the trade and improve my break even. In all likelihood, these will eventually require rolling out for duration come April opex due to the location of the short leg, but I'm fine with that. Pops can happen while you have these on, and you just need to be patient and make the best of them ... .
GENERAL MUSINGS:
For people who are into selling premium and who had large amounts of cash sitting on the sidelines, this is your "kid in a candy store" moment. Non-single name premium selling has finally become productive in that 45 day wheel house, even in broad market, where we were looking at going grotesquely long in duration last week to get paid. For those who had longer-dated premium selling setups on before this volatility expansion (points at self), well, I feel your pain. Be patient and mechanical, and some of that pain will inevitably give way to a volatility contraction going forward.

Buy TGT @ $113-$114 till 03/09/2020Buy Target Corp at current price of $113-$116 (Avg $114) and hold it approximately till 09.03.2020 to take at $125.0 (+9,6%).
Reason of the exact date of 03/09/2020 - is the Avg expected Value (Return) equal to 0.21% daily. So in average the stock will grow by 0.21% daily.
I am sure the stock will rise because of the next reasons:
1. sustainable large company one of the leaders in the industry in USA
2. the price plunge is due to the company slightly less than expected forecast for upcoming 4q statement
3. the stock is considered as defensive assset (a.k.a. safe heaven)
4. the stock price is very cheap
Although, the price can slump down to $105 per share, so my recommendation is to take more on that level.
If it slumps to $105, the average price will be $109,5 stop-loss at $103 (-6%), take profit at $125 (+14%).
Have a Good Luck!

Buy the Dip! TGTStarted Accumulation on TGT at 115.21
Entry 115.21
Target $120.9
Stop 113.21
Dropped due to weak holiday sales, but Retail sector is ramping up and TGT generally always recovers after big drops.

Target Corp Short! Evening star formation at the 38.2% of the range signify a possible bearish slam down. Also, the V shape resembles like a double top instead of a V up.