Long TDOC -Teledoc HealthThis chart is hilarious lol. Building a long here, 33% in- will add once I see more confluence. Company apparently is making money. Real product, real people. Down horrendously, 95% +. 1-3 month trade. Not advise. Good luck.
0LDR trade ideas

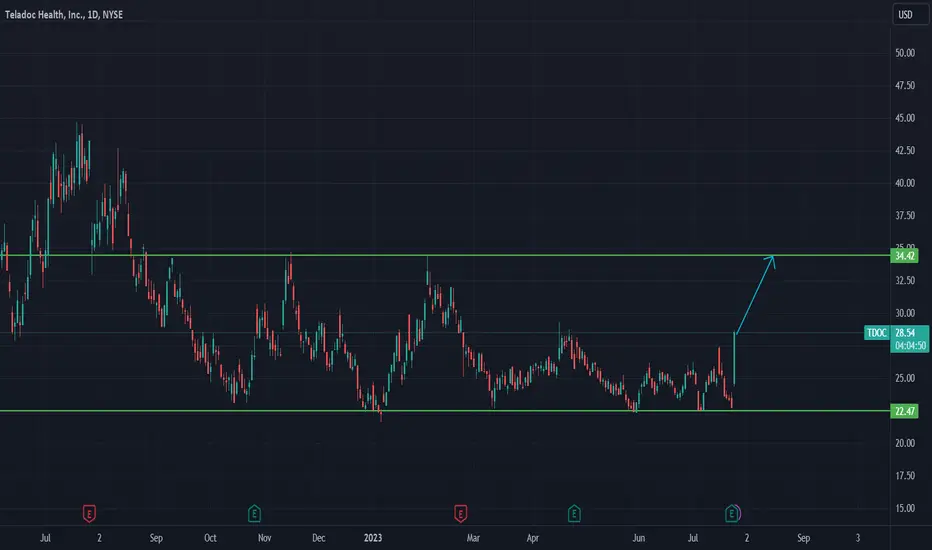
Multiple bottom at $23Multiple bottom at $23.
The current wave is slowing down at the same level.
Possible reversal waiting for our Bullish Alert.

TDOC waiting on a long entryIf you have been following me on StockTwits you know that I traded into July Earnings. After a nice pop to $30 to retest the top of its trading range it’s been shorted back towards the bottom of its trading channel.
To be clear NOTHING about this chart is Bullish except for the fact that it has previously bounced in the $21.50-23.00 area. I am not seeing any new options trades of interest, darkpool data or insider trades to support a long entry. Per FinViz the Short Float / Ratio is 16.97% / 5.27.
TDOC next reports earnings on or around 10/25/23. Other potential catalysts could include spinnout, merger, takeover news.
Based on past trading patterns I would expect traders will be looking add long positions in the $22 area with a target at the top of the trading range around $30.

TDOC - Update after a Bullish WeekIve been eyeing TDOC for some time, finally posting a chart on it talking about TA developments that may indicate a potential bottom area earlier this week (Check below for the link to that chart). I was also in the camp of TDOC going lower to the low $20 or high Teens ($18-19).
This weeks move of 30%, closing the weekly candle at 20% gains was a wonderful surprise.
Its important to NOTE, however that the move is NOT SET IN STONE yet -> For WEEKLY Timeframe
We are hitting a MAJOR confluence of RESISTANCES. Though we are ever so peaking our head out atm, next 1-2 weeks will show more evidence with confirmation.
FOr example: Next week CLOSE being a bullish single candle or next couple weeks printing a bullish candlestick pattern sequence.
The other side is that It could very well be a fake out/ SELL OFF and we do come back down to make a final lower low before we really become bullish. But in my opinion, the probability of a fake out maybe less.
We've moved above the 21 week EMA as well, we would need to confirm support above it in the coming weeks but being above 21 EMA indicates bullish activity.
NOTICE the Bollinger bands. Notice how it has narrowed, this could indicate volitility to pick up and we need to see price stay above median line and be near the upper band. We must Observe what happens in the coming weeks.
The Bollinger median line and 21 EMA are converging and can act as strong support zone. If we do come back down in price.
On the DAILY timeframe, we acted as SUPPORT on both the PURPLE major RESISTANCE line from all time highs and RESISTANCE line from July 2022. Just note however i would need more confirmation in the coming days by staying above as support, to be confident we stay at these levels. If we do, next weeks candle stays above and no fakeout occurs.
RSI is breaking out of the Horizontal resistance line that kept RSI range bound since OCT 2021. (indicated by black line)
This tells me, the BULLISH DIVERGENCE is at play. We would want RSI to continue UP, or follow the Green arrowed path drawn. We absolutely do NOT want the Red arrow. Which is a possibility but less probable in my opinion.
STOCH RSI, a momentum indicator shows that we have a bullish momentum cross, showing that there is still gas left in the tank for us to move. Expect it to go above the 80 level.
Conclusion + trade setups:
For stocks that are 80+% off there tops, averaging in always is a nice strategy.
I think under $30 is cheap for TDOC, especially with all these TA challenges being slowly conquered. There is no denying that it is highly probable we go up eventually, as we've reached critical historical support, and have been consolidating around here for awhile. Alot of indicators and other signs are leaning towards a bottom being formed or already formed.
*CHECK OUT A more detailed TDOC chart from earlier this week BELOW*
A swing trade idea could be taking positions using the Daily timeframe, putting stop loss below the PURPLE line. Making sure you manage your risk properly.
I would rely more on the WEEKLY timeframe and a confirmation that we've made it above the resistance, plus weekly candles are more macro and powerful. This would also be for holding/ longer term investing.
THANK YOU! Hope this update helped. If you like the content, please boost and follow. Please do comment with your opinions! Would love a discussion.
DISCLAIMER: I am not a Financial advisor. This is NOT financial advise. This is my opinion and for educational purposes.

$TDOC looks primed for a move up.NYSE:TDOC has been showing positive divergence on both the RSI and MACD over the past year+, and if price can break above the resistance zone where it is now currently consolidating in, a larger move could be in play over the next month or more. Taking August calls.

$TDOC looking ready to runTDOC had a good earnings report and a breakout on the weekly pennant. Orange lines are resistance. If it breaks the top resistance, we can see mid $70s. Overall market trend can hold this back.

TDOC Teladoc Health Options Ahead of EarningsIf you haven`t sold TDOC here:
Then analyzing the options chain and chart patterns of TDOC Teladoc prior to the earnings report this week,
I would consider purchasing the 20usd in the money strike price Calls with
an expiration date of 2024-1-19,
for a premium of approximately $5.90.
If these options prove to be profitable prior to the earnings release, I would sell at least half of them.
Looking forward to read your opinion about it.

$TDOC LONG support at 22, 29 Earnings Beat NYSE:TDOC LONG support at 22, 29 Earnings Beat
Coming off lows

TDOC - Teladoc bottom fishingHello. This chart is strictly a Technical Analysis of Teladoc (TDOC).
I think currently we are in a point in TDOC's price action where we've reached a fundamental SUPPORT area if you look back to 2016. This could potentially be opportune BUY ZONE.
TA is all about probability. The probability we go down is always there, just in this scenario i believe the probability of downside is less compared to the upside.
Though i want some short term downside for TDOC, as i believe that would be the necessary catalyst to help shift trend to upside. Price will eventually rally up, especially if we are in a bull market currently. Which i believe we are in. Ill go into details on why i want it and believe this.
NOTE: This is on the WEEKLY timeframe, so we are looking into a more macro scenario than if we were to look at DAILY timeframe.
LAST WEEk -> We printed a candle that has a large upper wick, indicating SELLING pressure.
We are also resting right on top of a major support level at around $23, indicated by green horizontal like.
It wouldnt be bad for price to drop below and touch the lower 2 green lines, the sloping one and horizontal one. This would be a catalyst due to price action then, starting to confirm what is known as a BULLISH DIVERGENCE.
Which is a pattern or concept where PRICE ACTION forms LOWER LOWS, as INDICATORS create HIGHER LOWERS -> Seen by the white sloping line drawn in the RSI and MACD. And the green sloping line in PRICE ACTION indicates the lower lows.
*Many trades ive recently taken have followed similar patterns, ill link 1 chart to compare this to BELOW* Its for stock LMND. Heres also a SNAP SHOT.
NOTICE the horizontal white line on RSI -> this is what helps me guage at when this move and UPSIDE can start or hit. If RSI breaks out above this line, we can start to see BULLISH DIVERGENCE playout. Easily i can see TDOC hitting around the $40.00 level.
Going back to CURRENT price action. I believe we go down and test the lower green lines, because of all this RESISTANCE that we are facing.
NOTICE:
#PURPLE SLOPING RESISTANCE LINE -> This is MAJOR MAJOR resistance, created since Feb 2021. We just tested it for the 3rd time, last week. (Note: atleast 3 touches are required to weaken lines, more price touches lines -> the weaker they get.)
# We also got some short term WHITE SLOPING RESISTANCE LINES. Helping to push price down
# We also got the 21 EMA (YELLOW Moving average)
******Note, all these are meeting together to act as RESISTANCE. When theres so many converging, like this -> It gets a little hard or takes time to break through to upside.
***ALso i think the PURPLE line is MOST IMPORTANT. This would help reverse trend in a major macro way.
SO KEEP OBSERVING.
Lastly, note the ADX & DI -> This is a momentum indicator. When RED line is over Green line, it indicates BEARISH Price action, as you can see by the downtrend. Currently there is some green overlapping occuring. We have to keep observing to see how this progresses. But ideally, we'd like to see Green shoot up to above 20 level, just like the red line did in white box.
CONCLUSION: I believe in the short term, we could have some downside price action coming. But sometimes, downside action could have positive ramifications. In this case, further strengthening the BULLISH DIVERGENCE forming in the charts. Indicators and current support area, indicate seller exhausting. Probabilities in my opinion point to price moving up than down. Hitting either one of the lower green support lines, could be areas where positions can be taken with stop losses set below.
DISCLAIMER: This is by NO MEANS, Financial advice. I am not a financial advisor, im just a TA nerd and post these for educational purpose. Always follow your own due diligence when trading/investing. Always focus most of your energy on risk management strategies.
If you like this content, please do BOOST, FOLLOW and do COMMENT, i would like others opinions on what your seeing, whether TA or FA. Thank you.

Teladoc - Retest of the resistanceHello Everyone,
Teladoc had a good earnings with nice guidance.
Heavily misspriced compared to the rest of the market and is the only stock that is yet to have a recovery.
Good Luck
BULLISH TDOC - Bounce off support from 2016Got a lot of good things going on here. We touched the trendline four times: twice in 2016 and twice in 2023. We just came our of this wedge to the upside. We also have a big gap up at $55, and we're running into earnings on 26th of July. A seriously bullish divergence on the RSI, as well.

Long TDOCBeen nibbling at this one for a while, finally had time to check monthly MACD ......we have a geen cross. Very hard to ignore. Adding to longs here. triple bottom on Daily also

Teledoc- Worth the Copay?Teledoc is setting up for a meteoric rise
The technicals look good
We could see another small move lower but I don't think that will change the thesis
Fundamentally, healthcare tends to rise in bear markets (yes we are in a bear market. in fact we are currently in a bear market rally- see related ideas) as consumers focus more on things that matter (e,g, healthcare, consumer staples, etc)
Additionally, consumers and doctors are continually looking for easier and more efficient ways to engage each other
LONG Teledoc

Teladoc is Bullish Last month was a hammer candle signaling what looks to be a bottom.
Descending wedge pattern and trying to break out.
Lagging indicator (MacD) looks to be crossing soon.
Note this is still in an overall downtrend even with a descending wedge breakout.
With buyers stepping in so strongly in this name recently it foreshadows some sort of good news whether its earnings or something else. The company would make for an excellent cheap acquisition target at this valuation in my opinion.
No position for now but I've added the name to my watchlist.

This could be another IntelCheck my pervious post about TDOC down below. Things have changed a little bit but still long. The $22.5 level has demonstrated to be a strong support level. I just added. It looks a lot like Intel:

Triple Bottom On TDOC, LongTriple Bottom on TDOC, have no clue what these people do but I know when macro changes this dogshit will pump more then the rest. At home doctor narrative coming back of course. Market makers just keeping it from going to zero now with classic patterns, I will start dipping my toe for long term cap gains swing positions on this move.

Teladoc - Bullish Divergence and Falling WedgesNYSE:TDOC has been down 90% from its high in February 2021.
Current Candles are forming a falling wedge pattern:
and at the same time, it has two weekly candles that confirming a breakout from the secondary downtrend and first candle that breakout the pattern which may indicate a potential reversal movement.
Bullish divergence has been shown by the Stochastic and MACD Indicator in the weekly chart:
The target of the falling wedge pattern is in between the remaining gap of $ 44.49 - $ 55.86.
Area of $ 30.33 - $ 30.71 is a good range for entry position with EMA200 (4h Chart) as our primary Stop Loss.
Long Term target will be around $ 90. Please expect a sideways movement around the gap and see if the movement can support the price to the target.
Only time will tell.
Current Risk to Reward Ratio is very interesting technically.
Disclaimer is always on.
Currently i do not have any possession in NYSE:TDOC stock.


$TDOC - OverboughtTeladoc Overbought. SPY reaching $420, unsustainable rally, the entire market is overbought.


TDOC is about to make a Breakout but which way will it go?What we are looking at here is TDOC on the Daily TF.
Draw your attention to down sloping trendline (Yellow). You will notice that the yellow trend line is acting as resistance and the price action has hit this line a couple of different times.
The price action from today (1/9/2023) helped solidify the downward sloping trendline and showed us that the resistance is strong along that line.
Now look at the downward sloping trendline (Green). It used the price action on Friday (1/6/2023) to help solidify that downward sloping trendline, which is acting as support.
The yellow resistance line and the green support line are creating a wedge pattern for TDOC to make a move.
If the Yellow resistance line gets tagged a couple more times, you can expect further upside and a breakout.
However, if you tag the support (Green line) too many times more, you will see price breakdown and the price of TDOC could go lower.
This is a situation where you just sit and wait for the price action and the charts to tell you what to do next.
TDOC will continue to be monitored as this stock has a lot of potential for a breakout.
What do you think will happen next with TDOC? Do you think Breakout or Breakdown?
Let me know in the comments.
Cheers.

ABC BullishTarget is D.
Possible stop under C.
Short interest is a bit over 18% which is high.
No recommendation

TDOC and WTZ4 with AO in the ZoneTDOC is one of potential telemedicine companies. I like their business models and future plan. For chart pattern, I apply WTZ4, one of my favorite setup, together with AO indicator for entry signal. The target is Fibonacci level and Tunnel line. Don't forget to control your risks well before trading. Enjoy trading!
