Signalwyse Daily Stock Picks SeriesSignalwyse Daily Stock Picks Series - 25 August
Traders execute daily buy positions at the beginning of the trading day and sell before the market closes. This active approach aims to capitalize on short-term opportunities, enabling you to act on our carefully selected top 10 S&P 500 stocks.
We will share 2 of the top 10 stocks daily.
Check the website on our bio for more.
-Signalwyse Team
0LHS trade ideas

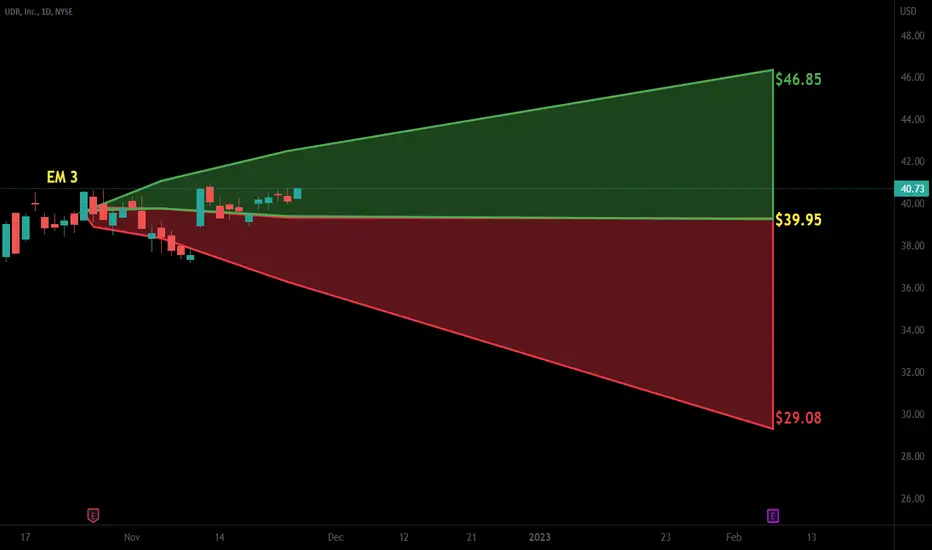
$UDR with a bullish outlook following its earnings #StocksThe PEAD projected a bullish outlook for $UDR after a negative over reaction following its earnings release placing the stock in drift C with an expected accuracy of 50%.

Looks very bullish here ...Just placed my order in here. It might be a little bit late for the party - let's see if another re-test of the broken trendline will happen or not ...

$UDR with a Neutral outlook following its earnings #Stocks The PEAD projected a Neutral outlook for $UDR after a Positive over reaction following its earnings release placing the stock in drift B with an expected accuracy of 42.86%.
$UDR with a Bullish outlook following its earnings #Stocks The PEAD projected a Bullish outlook for $UDR after a Negative over reaction following its earnings release placing the stock in drift C with an expected accuracy of 60%.

UDR - Inverted H&S Patterns A larger Inverse H&S followed by a smaller H&S . The smaller H&S head is the larger H&S's right shoulder.
both preceded by a period of sideways activity, this is reflected with the red hammer icon
Price should form a right shoulder and recover nicely within dotted line and the solid white line

UDR: bullish flag pattern?A price action above 57.35 supports a bullish trend direction.
Upside price momentum supports the bullish trend.
Remains above its 200-day simple moving average.
RSI leaves enough room for further upside price potential.
MACD bullish crossover is also applicable.

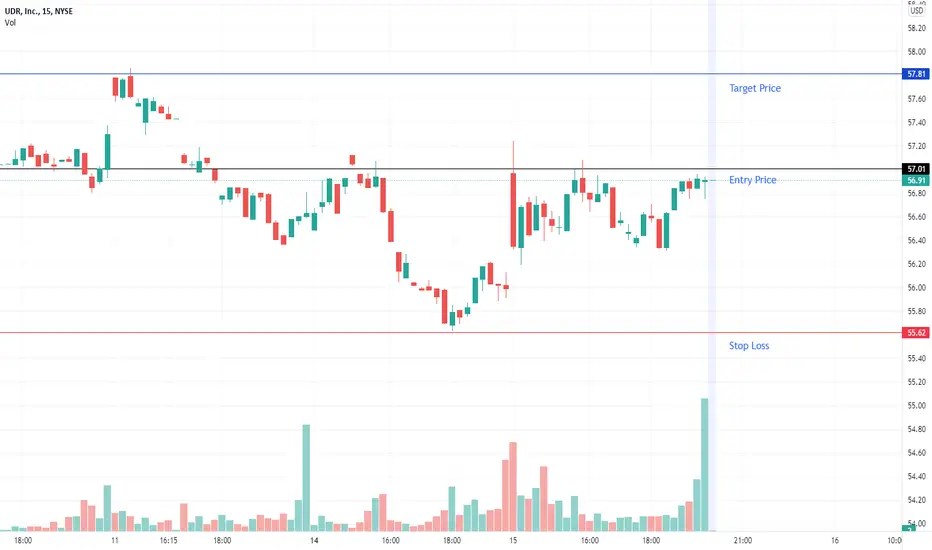
16/3/2022 NYSE (UDR)Buy (Entry Price) above the black line and exit (Stop Loss) below the red line. Can take profit at the suggested Target Price.
Entry Price: $57.01
Target Price: $57.81
Stop Loss: $55.62
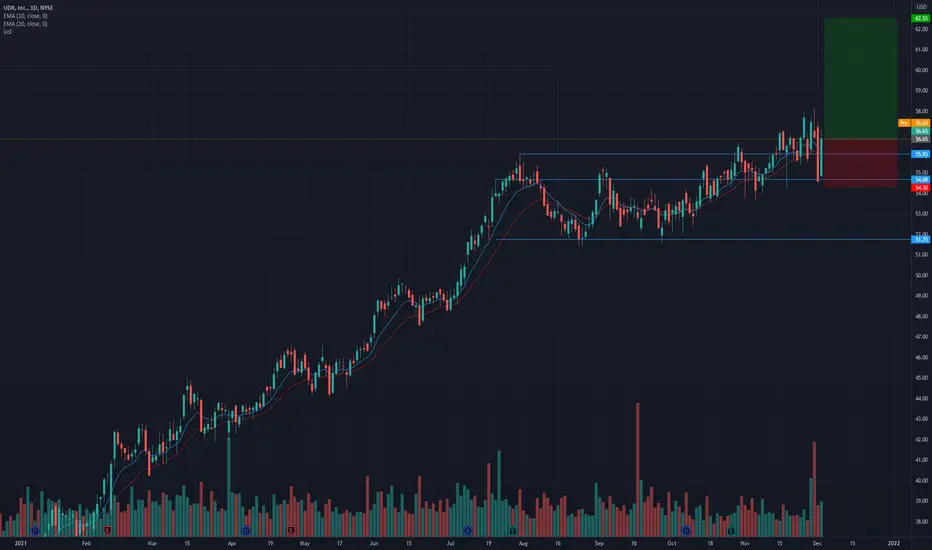
UDRReal estate name which should fare well in times of higher interest rates. Currently accumulating on the 50EMA, which this name really loves. Targeting 61.75, 65.5 next.

UDR ready to move higher?* Great earnings
* Very strong up trend
* High 3-month relative strength in the Real Estate sector
* Breaking out of a 18 week base with higher than average volume
* Has been consolidating above the broken resistance for the past 12 days making it a new level of support.
Trade Idea:
* Now's a great time to enter as the Real Estate market is showing strength.
* Price isn't too far away from the broken resistance turned support
* If you're looking for a slight discount you can look for buying opportunities near the $55.93 area

UDR Breaking out againUDR made a initial breakout in July
Was in consolidation since then
Volume picking up
Decent earnings
If one is holding a position since initial breakout, he can add on this breakout as well.

UDR - Long set up - weekly chartsUDR, Inc. is a real estate investment trust, which owns, operates, acquires, renovates, develops, redevelops, disposes of, and manages multifamily apartment communities. It engages in the multi-family real estate investment trust business. It operates through the Same-Store Communities and Non-Mature Communities/Other segments. The Same-Store Communities segment pertains to properties that are acquired, developed, and stabilized occupancy. The Non-Mature Communities/Other segment include recently acquired, developed and redeveloped communities and the non-apartment components of mixed use properties.
From the technical scanning standpoint, this chart pops up for 2 very critical reasons.
1. Bollinger Band squeeze on Daily charts and price very close to its 20 Day moving Average and
2. On weekly charts, price sitting right on its 20 week MA. (basis of the Bollinger Band)
More like a Bull flag set up on the weekly charts. Looks bullish with RSI popping upwards too In the bulls control zone
Great move up and then this pullback on weekly charts, just looks a great setup with Good risk to reward.
From the sector correlation perspective, some important considerations are as below:
1. There are nearly 256 stocks in the real estate sector
2. As on the close of today, 201 stocks are above their 5 Day Moving Average, which is a strength score of 76%
3. As on close today, nearly 68% of the total stocks are above their 20 Day Moving Average, which to me is a positive sign of upside trend
4. Today, nearly 81% of the total stocks in this sector had a positive day, higher close than yesterdays close, that is a sign of sector strength
5. Average Price target by analysts at $58.40, still a potential 10% upside from current levels

UDR BreakoutNew All Time High
Broke out of Covid Crash Highs
Earnings coming up
Pays out dividends as well

UDR approaching all-time-highs with tonnes of buying pressureUDR is extremely close to breaking its all-time-highs from February 2020. Not only that but it's been on an absolute tear for the past 7 months. That's 7 consecutive months it has been closing green.
Taking a look at the volume coming in, it seems like it will break in the coming week.
Not only is this setting up for a great trade, it's also a great long term hold. This REIT has proven to come out of a crash only to do even better than before.
Final thoughts:
* Strong up-trend with tonnes of volume
* Approaching February 2020 all-time-highs
* Great long term hold as REITs pay out generous dividends
Trade Idea
* This is a long term resistance so do wait for a confirmation of the breakout on the weekly time frame. A break and hold above $51.25 would be the signal.
* A rejection from here could send UDR back to around $48.90. Which, given how well it's doing, would be a great entry point


UDR: Descending ChannelDescending Channel
Please don't forget to FOLLOW, LIKE, and COMMENT ...
If you like my analysis:)
Thank you and Good Luck!

UDR, Inc. (UDR) short.All description on the chart.
Please, don't forget to like and follow.
Thank you.


UDRVery bullish on this chart, nice consolidation near the highs and created good support around 32 level.
Long with a target of 40-42
