$x #x$X been wedgey this year. Looking to enter when price moves out of cloud, hoping its near support.
0LJ9 trade ideas

$X channel in downtrend I could see X testing the upper DTL, Still showing signs of significant weakness. Would consider going short at trend line if a good setup presents itself.

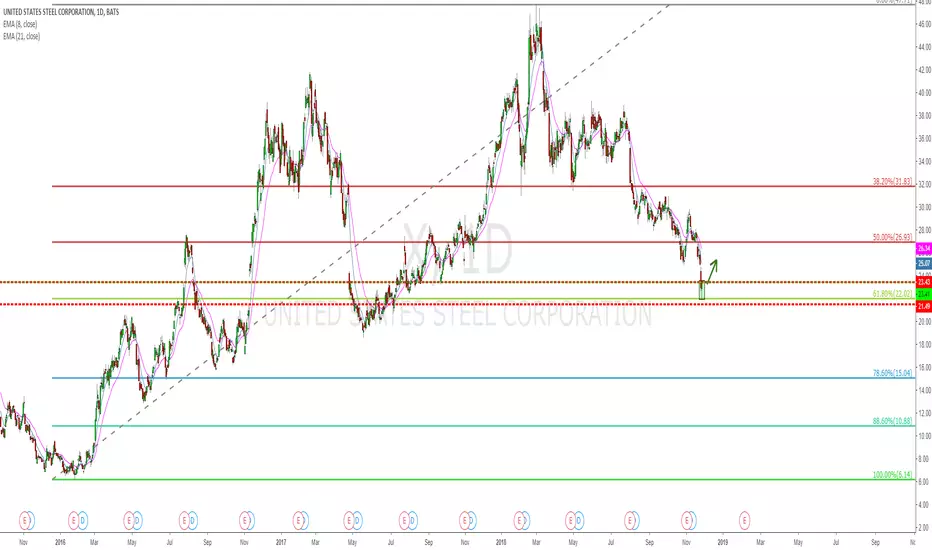
$X bullish ascending triangle breakout. Looking for $30$X is pushing higher through top of ascending triangle resistance. I am long and am looking for $30.
OPENING: X FEB 22ND/APRIL 18TH 18/22.5 UPWARD CALL DIAGONAL... for a 3.09/contract debit.
Metrics:
Max Loss/Buying Power Effect on Setup: $309
Max Profit on Setup: $141
Break Even on Setup: 21.09 vs. 20.71 spot
Debit Paid to Spread Width Ratio: 68.7
Delta: 37.91
Theta: .61
Notes: The front month short doesn't pay for all of the extrinsic in the back month long (which is generally why you want your break even to be at or below spot), but I'm somewhat fine with that given the debit paid to spread width ratio.
On a side note: I'm getting into quite a bit of long delta here, so will have to look for opportunities to add short delta, either on a per instrument basis or via a broad market short delta setup ... .

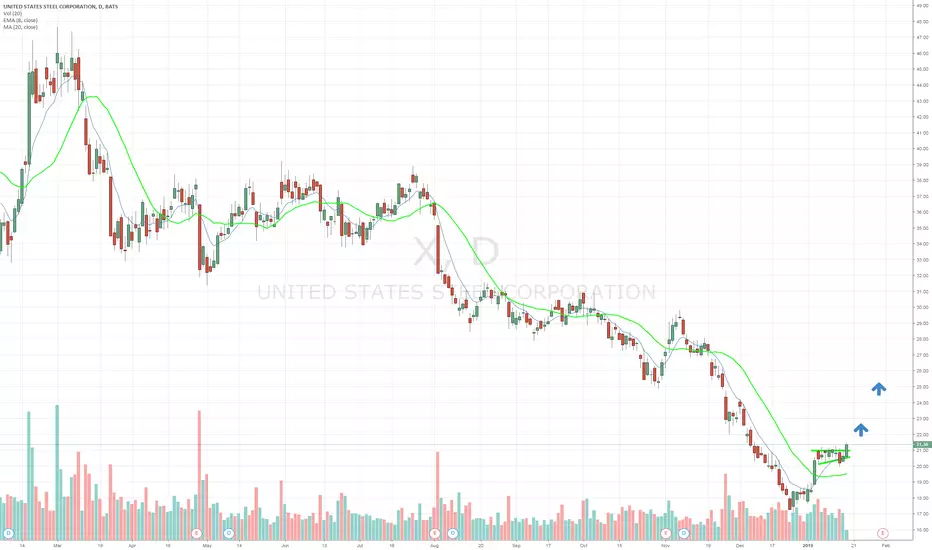
$X cut in half.Showing signs of life. Bullish ascending triangle$X has been slashed in half over past few months but is now showing signs of life and I am building a long position. X is trading above the 8 day ema and above the 20 day sma which is also turned higher. $X is printing a bullish ascending triangle and next leg should be up.

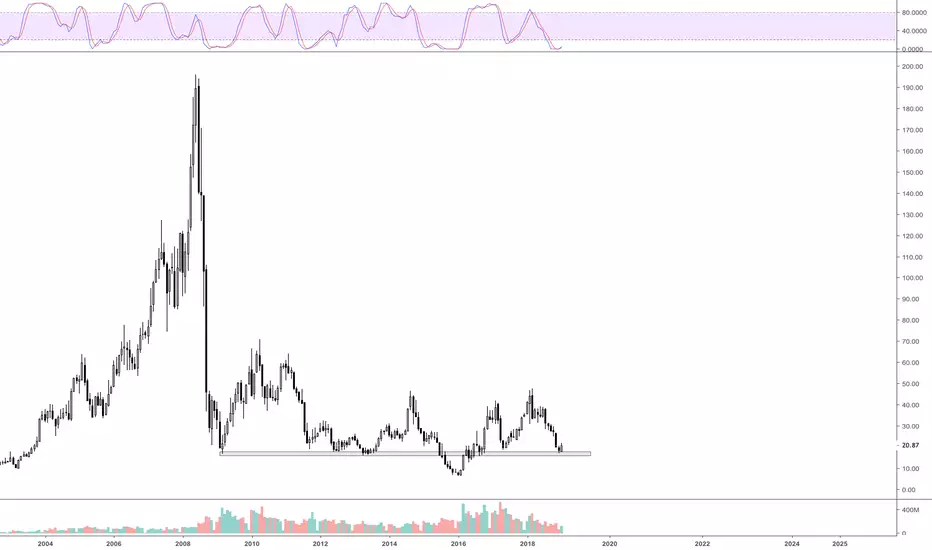
X U.S. Steel A Potential Great Value Stock @ Sub $10 Not Here Yes you read that title correct - this name on a crash can go all the way back to $8 and be an exceptional long term hold - we are not and would not short this name but will back up the truck at the right price. Be careful of bulltrap bounces on this name right in this $17 to $18 area. #stocks #trading #steel

TRADE IDEA: X FEB/APR 15/19 UPWARD CALL DIAGONALMetrics:
Max Profit on Setup: $108
Max Loss/Buying Power Effect on Setup: $292
Break Even vs. Spot: 17.92 vs. 18.25
Debit Paid to Spread Width Ratio: 73%
Delta: 30.35
Theta: .82
Notes: With high implied volatility rank/30-day implied (82/67) and fairly long-term weakness, putting on some bullish assumption here without hanging a ton of buying power out there if it goes south with the flexibility to work the setup long-term as a cost basis reduction play or synthetic covered call with the option to exercise the back month long if things go my way.
Other Possible Plays:
Short Strangle/Straddle: Earnings are 31 days out, so you may want to consider straight nondirectional premium selling closer to the announcement instead: the February 15th 16/21 short strangle is currently paying 1.39 with a 50% max metric of .69; the 18 short straddle in the same cycle: 3.26 with a 25% max metric of .82.
Iron Condor/Fly: The February 15th 13/16/20/23 is paying 1.15 (greater than one-third the width of the wings); the 13/18/18/23 fly, 2.73 (greater than one-fourth the width of the longs).
Short Put: If you're into "wheeling" (short put, acquire, cover), the February 18 short put is paying 1.50 in the February cycle a cost basis of 16.50 if assigned on the 18's, an 8.3% discount over current price.

United States Steel - is it time to buy?More shares have been bought than sold by United States Steel insiders in the past 3 months. If Trump gets his $5billion fir the wall/steel fence, X could benefit big time.

US STEEL ready?I think we're witnessing a bullish bottom in US Steel. It's been beat down for quite a while now. Looks like a descending broadening wedge (megaphone) forming. I suspect a break above this in coming weeks and a bullish run.

'X' marks the spot around $12I've seen this company as somewhat of a dinosaur, it just seems so slow to adapt to change and industry trends. Think the US auto industry a whiles back. Pains me so because I'm from Pittsburgh, but anyways...if you want a domestic US steel stock, go Nucor. I've got in the mid $12s as my target on the way down, as we've broken out of the uptrend that was set a while back.
Trade safe!

X daily 0.618 and hammer combination long!X had pulled back to the 0.618 of the 6.15-47.6 rally!
Yesterday it had a quite strong bounce off that and formed a daily hammer!
I'll be interesting in taking the long yo
Let's see how it goes!
Autonomous AI Vision Fund U.S Steel Stock Rating Strong Sell $47PR Strong Buy $16.3
NR Strong Sell $47


X Announces $300 Million Share Repurchase AuthorizationX: United States Steel Corporation
2018-11-01 16:23:41
United States Steel Announces $300 Million Share Repurchase Authorization and Redemption of 2020 Senior Notes

Time to short X?Monthly and weekly candles both indicating similar downtrend. Watch next week for tarifs to have a negative impact on earnings.


Mencari Support dan Resistance Dari Solar DegreeSolar degree adalah kedudukan matahari yang berubah setiap tahun. Sebenarnya kedudukan bumi yang berubah, namun dalam sistem Geocentric jika observer atau pemerhati dari bumi kelihatan seakan-akan matahari yang bergerak. Antara 4 sudut penting dalam setahun adalah apabila matahari dalam kedudukan
0°- Spring Equinox
90° - Summer Solstice
180° - Fall Equinox
270° - Winter Solstice
Ok, kita akan cuba mark untuk mencari support dan resistance untuk salah satu instrument saham US Steel. Pada chart harian (Daily Chart) boleh ditandakan tarikh untuk 4 sudut penting matahari atau solar degree. Kemudian, ukur jarak 90° dan didapati antara Summer dan Fall selama lebih kurang 95 hari. Jadi, support dan resistance akan kelihatan pada setiap 95 ticks pergerakan US Steel. Senang bukan?


X Is Forming A New ChannelDown trend appears to be over and new up trend is forming with a new channel.

X - US SteelShorting here after a large sell-off (crowded trade likely).....
-1 Sep21 $31 puts for $1.24 cr.
Risk: 2x cr received or continue to roll puts out, depending on rest of portfolio
Profit: 50% cr received
