0LK6 trade ideas


I see $70.00This stock is in inside day, inside a month, daily hammer. I think that this stock is going to the lower $80's. This stock has a positive outlook I think overall within the energy sector. I would like to see Valero higher as I've mentioned in my opening. If it breaks support at $64.65, I'm going to have a wider range and risky action for those who are looking for risk.


LONG or SHORT ???Break out at Key lev. ( 57.50 ) , we can see our price take 1° Target = 66$ and 2°Target price at All Time HIGHER lev. 73$.
If not, we can see Head & Shoulder head and shoulders completely finished and technical rebound on the neck line

VALERO ENERGY CORP: triangle power?Signals:
1-Double bottom
2-Triangle with oncoming breakout
3-Oncoming breakout of inclines resistance
Buy 54.90-55.30
Stop-loss 53.76
Target 60.00

Valero Corrective With a Sell SetupWe have been watching the us energy stocks . This stock is different as most of the others have been in a corrective structure since the start of the year, following oil. As you can see from the chart VLO has been falling since the end of March.
As with the others it is still in a corrective structure right now (though only since July) so it makes a good candidate to watch for some more down.
We will wait for it to break down through the lower trend line and then watch on a lower time frame for a retest and rejection or conslidation before shorting


VLO breaks downPrice of VLO has broken down through support of the rising channel it has been in since 2013 and broke through the support at 52 caused by previous lows. A cautious trader could wait till the end of the day to see if this candle closes below support.


VLO broke down out of rising channel Price of VLO has broken down out of rising channel. While a major drop has not taken place, this could indicate a larger shift in trend beginning a bearish market cycle. Watch key support at 52 and the 200 MA for confirmation of new bear trend.

VLO. :-) Using Fib/Cloud/ and BB :-) how will price react?:-) weaker than most of it's counterparts. yellow line sl.

VLO trend line supportholding the long-term trend and has made higher high on the daily since the bounce off trendline.

VLO Short Trade IdeaAfter the previous 2 high volume days, VLO has made new highs. However, it did not close with a strong candlestick above the resistance and instead put in a doji. With this location it is setting up a nice Risk vs Reward trade for the short side. Previous resistance will be the 1st profit target and will be moving up the stop loss if the trade goes in my favor.

Quant Model Indicates 20-day Upside in VLOOur academically-based quant models indicate that Valero is likely to perform strongly over the next 20 days:
Short term indicators:
Above 20-day, 50-day, 200-day moving averages
Close to 52-week high
Not that overbought
Our academically-based quant models also indicate that Valero is likely to perform strongly over the next 12 months:
Long term indicators:
Undervalued on revenue, earnings, book value, and free cash flow basis
Strong price momentum
Excellent profitability & earnings growth


VLOThis is nothing more than an exercise as there is so much going on here, I wanted to post it so I could come back later and see how it resolved.
In ORANGE is a H/S pattern that back tested the neckline before finally hitting target. In BLUE is a larger H/S pattern which violated the neckline, but which could very well still be in play. The target of the BLUE H/S is near the target of the CRAB. However, price just completed a pretty tight Gartley and has reversed.
The overall formation (GREEN DASHED) could be a falling wedge. Lots of conflicting ideas on this weekly chart, should be interesting to see how it unfolds.

VLO Long from 46--PT of 52.50Took a long position via DEC calls above 46.45 (0.5 retrace) with a short term target of 52.50 (breakout/breakdown point) of this weekly view.

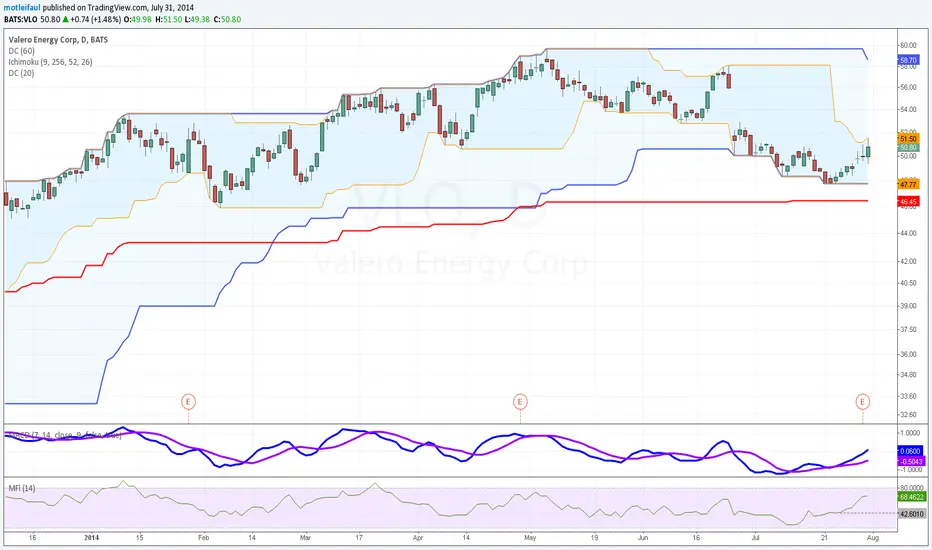
VLOWe got a rising divergence in the MACD and a rising Money Flow with new highs every day now. This makes me assume that the rate is going to fill the gap from 2014-06-15.
VLO potential Bullish breakAssuming we close above 54.05, I like a short term target of between 55.70 and 56.80. Ultimate target is 58.49.
