VUZI Bullish Wedge Breakout – Targeting $3.56! 🚀
📊 Trade Setup:
Ticker: NASDAQ:VUZI (Vuzix Corp)
Chart: 15-min
Pattern: Wedge breakout + ascending support
Entry: $3.05 (breakout confirmation)
Stop Loss: $2.90 (below trendline)
Target 1: $3.28 (resistance)
Target 2: $3.56 (breakout measured move)
🧠 Why It’s Valid:
Strong uptrend with healthy pullback
Wedge breakout with volume support
Price action respecting both trendline and horizontal levels
🗣️ Social Media Caption (Post This):
⚡ NASDAQ:VUZI Breakout Trade Setup!
Clean wedge + trendline bounce — eyes on $3.56 🎯
🔹 Entry: $3.05
🔻 SL: $2.90
🎯 Targets: $3.28 → $3.56
Momentum + setup = low-risk high-reward.
#VUZI #SmallCapBreakout #TechnicalAnalysis #ProfittoPath #ChartOfTheDay #StockSetup
0LRL trade ideas

INVERSE HEAD AND SHOULDER $1.50 EASYINVERSE HEAD AND SHOULDER can be utilized to predict reversals in downtrends. Once an inverse head and shoulders pattern is completed, it indicates a bull market. Investors usually take a long position when the price exceeds the neckline resistance.
BUY NOW BEFORE EARNINGGGGG

Will Vuzix Corporation 50x your investment?On the above 8 day chart price action has corrected 96% since March 2021. A few reasons now exist for a bullish outlook.
1) Price action and RSI resistance breakouts.
2) Price action lands on legacy support. See monthly chart below.
3) Regular bullish divergence as measured over 40 days. Multiple oscillators now print positively against price action.
4) No share splits.
5) 12% short interest by retail.
5) 36% Owned by Institutions .
Source:
shortsqueeze.com
6) The 50x possibility comes the bull flag price action is currently trading in. You’ll be glad you acted today should it confirm.
Is it possible price action continues correcting? Sure.
Is it probable? No.
Ww
Type: investment
Risk: 1-3%
Timeframe for long: Has corrected 96%!
Return: Read the idea
Stop loss: will say elsewhere
Monthly

VUZI Vuzix Corporation Options Ahead of EarningsAnalyzing the options chain and the chart patterns of VUZI Vuzix Corporation prior to the earnings report this week,
I would consider purchasing the 2usd strike price Calls with
an expiration date of 2025-1-17,
for a premium of approximately $0.10.
If these options prove to be profitable prior to the earnings release, I would sell at least half of them.

Vuzix has signed a contract with GarminYesterday, 15 May 2024, Vuzix Corporation announced a development contract with Garmin, a leader in navigation and consumer electronics. Garmin commissioned the development of nanoscale optical projection systems based on Vuzix waveguides. These systems are small projectors suitable for use in compact augmented reality (AR) devices.
The contract with Garmin was a strong positive signal for Vuzix investors, indicating that the company can expand beyond the narrow segment of AR glasses for industrial applications.
Given these developments, let's conduct a technical analysis of the Vuzix Corporation (NASDAQ: VUZI) stock chart to uncover potential trading opportunities.
On the D1 timeframe, the stock recently broke through the resistance level at 1.35 USD and formed support at 1.15 USD. The downward trend has halted, and quotes have formed a channel within the 1.15 - 1.65 USD range, suggesting the potential for further growth. If the downward trend persists, the target for decline may be 0.95 USD.
If the upward trend continues upon a rebound from the previously breached resistance level at 1.35 USD, the short-term target for the stock's growth could be 2.15 USD. In the medium term, the target could reach 3.10 USD.
—
Ideas and other content presented on this page should not be considered as guidance for trading or an investment advice. RoboMarkets bears no responsibility for trading results based on trading opinions described in these analytical reviews.
The material presented and the information contained herein is for information purposes only and in no way should be considered as the provision of investment advice for the purposes of Investment Firms Law L. 87(I)/2017 of the Republic of Cyprus or any other form of personal advice or recommendation, which relates to certain types of transactions with certain types of financial instruments.
Risk Warning: CFDs are complex instruments and come with a high risk of losing money rapidly due to leverage. 69.88% of retail investor accounts lose money when trading CFDs with this provider. You should consider whether you understand how CFDs work and whether you can afford to take the high risk of losing your money.

Vuzix AR glasses garner positive reviews amid business expansionVuzix Corporation, a leader in the professional augmented reality (AR) device market, has garnered favourable feedback for its AR glasses, as detailed in a success story published by TeamViewer. The report highlights using Vuzix M400 AR glasses in conjunction with TeamViewer Frontline software by Nadro S.A., a prominent Mexican pharmaceutical wholesale distributor. Nadro has successfully implemented 400 units of these glasses across 14 warehouses to aid in daily operations and employee training.
The deployment of Vuzix AR glasses by Nadro, which distributes over 51 million medical and personal care products monthly across Mexico, is a testament to the extensive adoption and effectiveness of Vuzix’s AR solutions. This successful integration sets the stage for a substantial revenue cycle, with Vuzix anticipating many existing M400 users to upgrade to the newer Vuzix Shield glasses, fuelling further growth.
Exploring the potential investment opportunities, let’s analyse the technical aspects of Vuzix Corporation (NASDAQ: VUZI):
On the Daily (D1) timeframe, the stock shows a 1.65 USD resistance level and support at 1.20 USD. Recently, an uptrend has begun following a break above the downtrend’s resistance line. However, should the downward trend resume, the next price target could be around 1.05 USD.
For investors, overcoming the resistance at 1.65 USD presents an attractive buying opportunity, with a short-term target of 2.15 USD. For those with a medium-term investment perspective, maintaining a long position to reach up to 3.10 USD could be beneficial.
—
Ideas and other content presented on this page should not be considered as guidance for trading or an investment advice. RoboMarkets bears no responsibility for trading results based on trading opinions described in these analytical reviews.
The material presented and the information contained herein is for information purposes only and in no way should be considered as the provision of investment advice for the purposes of Investment Firms Law L. 87(I)/2017 of the Republic of Cyprus or any other form of personal advice or recommendation, which relates to certain types of transactions with certain types of financial instruments.
Risk Warning: CFDs are complex instruments and come with a high risk of losing money rapidly due to leverage. 69.88% of retail investor accounts lose money when trading CFDs with this provider. You should consider whether you understand how CFDs work and whether you can afford to take the high risk of losing your money.

VUZI: Bullish Gartley/Bullish Dragon w/Weekly Bullish DivergenceVUZI has Double Bottomed on the Weekly Timeframe at the PCZ of a Bullish Deep Gartley and is now attempting a Break-Hook-and-Go off the Spine of a Bullish Dragon it's formed at these levels while showing MACD Bullish Divergence. It would be ideal for VUZI to hold these levels and eventually break back above the 0.886 and to confirm it as support as well before taking off.

01oct2022llllllllllllllllllllllllllllllllllllllllllllllllllllllllllllllllllllllllllllllllllllllllllllllllllllllllllllllllllllllllllllll

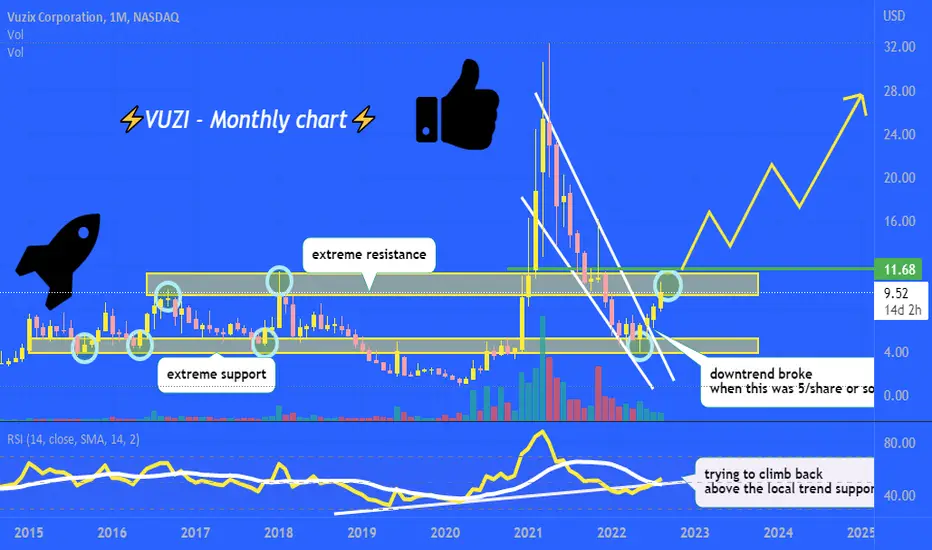
VUZI must clear the extreme resistance 👀lovely bounce from extreme support zone that goes back to 2015, followed by downtrend breakout around 5 dollars/share.
now at extreme resistance, above 11.68 I predict we see continuation towards all time highs.

Looking for buying opportunities on $VUZIThe $15 area seems to be a significant price point for this stock.
Going to be looking for entries if the price dips and creates a new low above or around the $15 level
No longer bullish if price is under the support area around $10

Long | VUZINASDAQ:VUZI
Possible Scenario: LONG
Evidence: Price Action
Entry point: 12.5 to 13 in case of pull-back, without pull: 14.75 is buy signal
TP: 16$
Call options, Strike 15$, 11/19/2021, 100 contracts, cost 13k, profit in target : 10k
*This is my idea and could be wrong 100%

VUZI can hit these price targets quick! watchout🚀we finally broke this downtrend after months of bleeding and consolidation. after long consolidation we usually see a big rally! so congrats the to the dip buyers.
price targets are 19.89/25.02/30.15 🏷 like and follow for more !

$VUZI, DailyDISCLAIMER:
I am not a financial or investment advisor. All information found here, including any ideas, opinions, views, predictions, forecasts, commentaries, suggestions, or stock picks, expressed, or implied herein, are for entertainment purposes only and should not be construed as personal investment advice. If you decide to invest, please make your own decision, or contact the specialists’ institutions. Thank you

vuzi. freaking missed it. maybe not too late.vuzi is turning around. I'm fully exhausted watching this stock, but it's doing the thing where some people start buying it.

Easy LongThis is a pretty clear setup, macro thematic of VR/AR combined with remote work...this is a no brainer, Expect this to trend up for quite some time as it will take a lot to turn it around > years of up.

1:4 Risk to Reward Ration fishing, with tight stop Loss▪️ From a Technical point of view:
High volume during past few days, highly possible for higher prices to come. with a quite tight stop loss might be a good chance to catch 1:4 Risk To Reward.
GL ☮️

VUZIVuzix (NASDAQ:VUZI) shares gained more than 15 percent, closing near its highs of the day on strong volume. The stock broke through resistance and out of flag formation. Looks good to go here. Its technical chart shows some bullish signals as both MACD and KD are now going up and the stock breaks above the 200 exp day moving average. Next resistance is now seen at $15.72 Long setup on watch.

VUZII lost track of all the bullish patterns, but argument for: falling wedge breakout, cup and handle, trendline support, Bull flag lol

VUZIAnybody else feel like we might get a rally post earnings? Broke out of falling wedge and now has a Bull pennant forming


VUZI - longI think with the push today wee saw the confirmation that $VUZI is likely bottomed and move up from here, for anyone who want information from the company, im just watching now a video about the annual shareholder meeting 21':
www.youtube.com
I will manually update the progress in the trade, I have no TP and will watch the stock manually to close - derisk or let it run - how it comes. Hope we can profit together.
