CAT
CAT closed at 222.9. I expect CAT to be able to continue it's way up to touch near 230. This is a daytrade idea, and entries are at 226 and 224.4. Above, we can see CAT touch 232-238 next. Keep an eye on DIA, if it breaks out, we can likely see CAT follow suit this week as well.
0Q18 trade ideas

CAT To Rise In Value?Good Day To The Investing World
Pretty much the only reason that CAT will rise in price is because of the unpredicted volatility. Since the value went sharp down, there will obviously be corrections on the stock. Meanwhile, if the price drops sharp, this may always be a big buy opportunity as it will correct itself straight after, giving you quick money. Also, we can see the Zachs Rating is giving us a #1 (Strong Buy).

Fundamentals - Caterpillar earnings 1/28Caterpillar (CAT) earnings are tomorrow on 1/28 at 6:30am. Caterpillar (CAT) reported Q3 September 2021 earnings of $2.66 per share on revenue of $12.4 billion. The consensus earnings estimate was $2.26 per share on revenue of $12.6 billion. Revenue grew 25.5% on a year-over-year basis. As you can see from this Fundamental analysis, Caterpillar is at a fair price right now with its P/E around average, based on the past 7 years.
Q4 December 2021 Consensus:
EPS = $2.22
Revenue = $13.21B
Fundamentals:
P/E = 22.67
EPS = $2.62
Revenue = $12.39B
Cash = $9.99B
D/A = .46
Div/Yld = 1.997
52 week high = $246.69
52 week low = $179.34
Do your own due diligence, your risk is 100% your responsibility. This is for educational and entertainment purposes only. You win some or you learn some. Consider being charitable with some of your profit to help humankind. Good luck and happy trading friends...
*3x lucky 7s of trading*
7pt Trading compass:
Price action, entry/exit
Volume average/direction
Trend, patterns, momentum
Newsworthy current events
Revenue
Earnings
Balance sheet
7 Common mistakes:
+5% portfolio trades, capital risk management
Beware of analyst's motives
Emotions & Opinions
FOMO : bad timing, the market is ruthless, be shrewd
Lack of planning & discipline
Forgetting restraint
Obdurate repetitive errors, no adaptation
7 Important tools:
Trading View app!, Brokerage UI
Accurate indicators & settings
Wide screen monitor/s
Trading log (pencil & graph paper)
Big, organized desk
Reading books, playing chess
Sorted watch-list
Checkout my indicators:
Fibonacci VIP - volume
Fibonacci MA7 - price
pi RSI - trend momentum
TTC - trend channel
AlertiT - notification
tickerTracker - MFI Oscillator
www.tradingview.com

Short CAT @ 205.53 Fractal BreakoutCAT crossed downward the last daily fractal of 202 on may 10. One day after, there is still a red zone bar, bearish divergent that provides an improved opportunity to enter.
Williams theory dictates that a Blue Light special would be entered after crossing the las lowest low, this would mean tomorrow (may 12) crossing below 203. 59 (todays low).
Im shorting today however, at 205.53. First confirmation would be crossing below 203.59 and then below 202 again.
Stop loss is price closing above the Balance Line (red). Target is whenever the trend ends, which is also signaled by price closing above the Balance Line.

$CAT with a Neutral outlook following its earnings #Stocks The PEAD projected a Neutral outlook for $CAT after a Negative over reaction following its earnings release placing the stock in drift C with an expected accuracy of 50%.

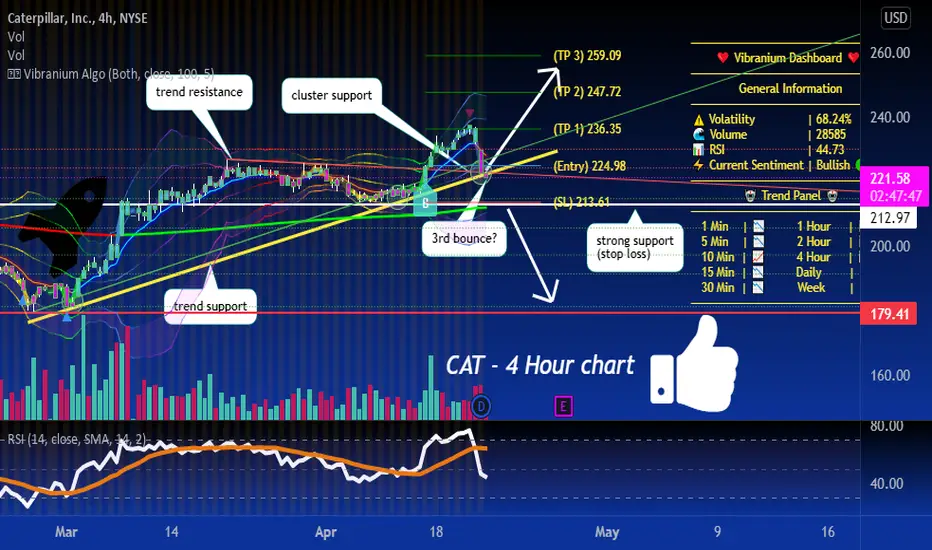
could see a big bounce off cluster support zonesCAT at a strong cluster support area! good chances that we bounce here and head to new highs later this year.
upside targets are 236.35-247.72-259.09
below 213 we can see a dump to 179 support
Cup and Handle/ Earnings 4-28 BMOAlso see a bull flag and price has broken upper trendline.
Resistance noted at buy side of cup. The other side, the sell side, is a high so it is not unusual to encounter resistance there.
There is a larger cup and handle with a break of 246.79 which is a bit above the high of this cup.
CAT has 8 earnings misses out of the last 19 reports. Some of the misses are on EPS, but majority are a miss on revenue. Guidance was not on this report I read, and can be crucial at earnings.
There has been significant insider selling in the last 3 months. Just FYI. Negative volume is high so large money is buying on down days. Cat does make agriculture equipment as part of it's business which has been a hot item since the supply lines were interrupted. Folks have to eat (o:
I plan to watch as sometimes things can get sticky in the days leading up to earnings. Long with a clear break of long entry level or possibly a fall to a strong level of support.
No recommendation

Caterpillar weakly Hello friends According to the price movement pattern We expect a 22% growth again In weekly timeframes

$CAT $CAT has an excellent 8 and 21 ema cross, which signals a nice bullish move. I also have a buy signal on the R.A.F indicator below. If $CAT can break through the blue resistance line on the chart, then it will have a nice upside move for a potential swing play.

CAT - more upsideCAT consolidated for 10 months forming a cup like pattern. There was a minor handle before we see a strong break up last Thurs on strong volume.
The odds are good that it has some room to go , though we are likely to face resistence and some consolidation @ 243. If it can clear this level, then the next targt is 260.
Disclaimer: Just my 2 cents and not a trade advice. Kindly do your own due diligence and trade according to your own risk tolerance and don't forget that money management is important! Cheers.

Cat ShortCondition: Ranging/trending. Overly ambitious sentiment that CAT will rebuild Ukraine.
Entry: Wait until after earnings. Test of trend, potentially an overbought daily stoch.
Stop: 0.5% above swing high from 18th Jan.
Target: 2:1 R minimum/ Early Feb consolidation/historic midline.
Downtrend noted since May 21
Current (general) preferred entry ticker conditions and entry signals are either.
a) Reversion to mean from overextension, providing there has been evident support from historical price action and/or a bullish/bearish pintail or rejection evident by an engulfing candle immediately after the supposed support/rejection.
b) Oscillators (Daily/Weekly Stoch as well as the Average Sentiment Oscillator) all providing confluence with a trend line/support level.
Maintain 2:1 RR, use retracements as much as possible. If over extended and sufficient confluence and I'm at my computer, consider a market order.
Establish confluence of support/resistance, trend, oscillators, congruent candles (pintail or engulfing reversal).

CAT Top of ChannelPretty simple one, This is sitting at the top of the channel that it has been trading in, I'm short here and will start taking profit below the 200 ema. Final target is 195.

CAT ,a gauge of economy, may retrace to 200 for a RS; TP=288CAT may be finishing the head of a head & shoulder pattern up to the 237 Resistance zone( also upper side of the green Megaphone). Then it may go down to 200 to make the RS this coming May. Measured target of this H&S will be 288 which is also 1.618 Fibo of the whole wave IV.
179.67 may already be the low of wave IV Megaphone pattern. The final wave V might be in 2023 where a BIG ABC correction may come to reset the market. (Recent yield curve inversion signals a recession within 1 or 2 years)
Not trading advice


$CAT LONG IDEA$CAT KITTY KITTY KONSTRUCTION looks great as it is approaching the top of its channel with some nice green volume. I'd look for a play to ATH following a 4hr smash through $225 level. HIGH WATCH SEND IT!!!

$CAT PT 213I think the war will slow down and agreements will be made, making this dump. Chart is for fun, just want to make record of my analysis, GG :)

CAT - 45 MThe area defined in blue was broken by the targets on the chart, the stop-closure is above the upper blue line and vice versa as well

CAT Forecast Options Playbullish market structure i have price breaking 218 to continue the bull run but before that happens i will be dropping down to lower time frame for better entries as prices prints a projected higher low lets see how it unfolds

CAT and DE: SHORT OF THE DAYCAT and DE are two of those companies that have been trading like TECH companies over the last year and they have significant moves to the downside coming over the next two weeks. Systematically, you can see the significant to then the consolidation phase. Look for a lot of selling over the next few weeks from these two stocks. I have a PT of 160 for CAT and 322 for DE.
Also, there has been insider selling from both of these companies. Most notably - Rajesh Kalathur, President, JD Financial & CIO, on March 07, 2022, sold 32,391 shares in Deere (DE) for $12,956,400.
Not financial advice

$CAT with a Neutral outlook following its earnings #Stocks The PEAD projected a Neutral outlook for $CAT after a Negative Under reaction following its earnings release placing the stock in drift D with an expected accuracy of 71.43%.
Cat is going for $250 with the market . +25% prospected move.Cat is going for $250 with the market . +25% prospected move.
A clear new trend is forming with multiple HH's and LL's with a monthly strong uptrend, thus we have a high probability of a prospected move ahead.
Target is $250 which is the 52WH .

Caterpillar Staggers After High-Volume DropCaterpillar was one of the first big cyclicals to rally back from 2020’s crash. But it’s been showing signs of fatigue more recently.
The first pattern on today’s chart is the lower high versus June. The broader S&P 500 and Dow Jones Industrial Average made new highs in early January, but CAT has gone more than six months without the same feat.
Second is the high-volume bearish gap on January 28. Its 5 percent drop that session was the biggest one-day decline in over a year.
Third, the selloff planted its shares under both the 50- and 200-day simple moving averages (SMAs). They have stayed there since. It’s also noteworthy that the 50-day SMA has remained under the 200-day SMA since late in the third quarter.
CAT has tried to hold a trend line that began in September following the recent plunge. Traders may now watch this pattern as key support, with the potential for more selling if it breaks.
There was also a bearish outside week as the stock peaked in mid-January:
Finally, the fundamental backdrop may be less supportive after CAT warned of costs pressuring margins last quarter.
TradeStation is a pioneer in the trading industry, providing access to stocks, options, futures and cryptocurrencies. See our Overview for more.
Important Information
TradingView is not affiliated with TradeStation Securities Inc. or its affiliates. TradeStation Securities, Inc., TradeStation Crypto, Inc., and TradeStation Technologies, Inc. are each wholly owned subsidiaries of TradeStation Group, Inc., all operating, and providing products and services, under the TradeStation brand and trademark. When applying for, or purchasing, accounts, subscriptions, products and services, it is important that you know which company you will be dealing with. Please click here for further important information explaining what this means.
This content is for informational and educational purposes only. This is not a recommendation regarding any investment or investment strategy. Any opinions expressed herein are those of the author and do not represent the views or opinions of TradeStation or any of its affiliates.
Investing involves risks. Past performance, whether actual or indicated by historical tests of strategies, is no guarantee of future performance or success. There is a possibility that you may sustain a loss equal to or greater than your entire investment regardless of which asset class you trade (equities, options, futures, or digital assets); therefore, you should not invest or risk money that you cannot afford to lose. Before trading any asset class, first read the relevant risk disclosure statements on the Important Documents page, found here: www.tradestation.com .

$CATPlaying a relief rally up towards gap fill, 0.5 fib extension and 200 Day MA. This could hopefully form a potential H&S pattern.
Along a horizontal support and has just bounced off a well tested diagonal support.
Daily RSI and MACD showing hidden bullish divergence.
Target = Gapfill/0.5 fib extension/200 Day MA
Stop = A close below diagonal support. (Take caution with a close under horizontal support)
