NFLX chop & dropI had a whole video that I created but couldn't manage to post. Nonetheless... I figured it out and will just share my points in this picture.
*below the 21 ema (1220), I believe we can target 1200 down to 1180. I'll be on the lookout for this trade until it happens.
That's it... that's the post. Enjoy Juneteenth.
0QYI trade ideas

NFLX gains the momentumNFLX is gaining strength.
Fundamentals: Netflix reported a 12.5% year-over-year increase in Q1 revenue, reaching $10.54 billion and surpassing expectations. Adjusted EPS rose by ~25% YoY to $6.61, coming in 16% above consensus estimates.
The company also issued bullish Q2 guidance, forecasting 15.4% revenue growth, supported by solid momentum in both subscriber growth and advertising revenue, further boosting investor confidence.
This overall situation puts NFLX in the list of momentum stocks.
From a technical standpoint, it consolidates in the widening chart formation, and may bounce off its bottom, which also corresponds to the area between 20-day moving average and lower band of the Bollinger Bands (20).

NFLX She got away #3Ahh yes the 3rd stock/idea/position I sold out of in order to go all in on $TSLA. I will stay the course with my plan, but when it hits I'm going to Diversify. You should only make mistakes once, if you repeat them you should cut your left nut. IDK, just have a real consequence so you don't F up again.
Currently it's overextended and needs a correction to 1100-1000....but what happens if they announce a stock split? oh yeah, this could moon..... again. fml

The Best Trading Strategy For 2025In this video you will see:
-The double top pattern
-The long lower shadow pattern
-The morning star
Now as you watch this video remember
to understand the following:
-The Rocket Booster Strategy
-The Reversal Strategy
-Candle Stick Patterns
Understanding these Top 3 Things
will help you digest this video very well.
Rocket boost this content to learn more.
Disclaimer:Trading is risky please use a simulation
trading account before you
trade with real money.Also learn risk management
and profit taking strategies.
Do not use margin.

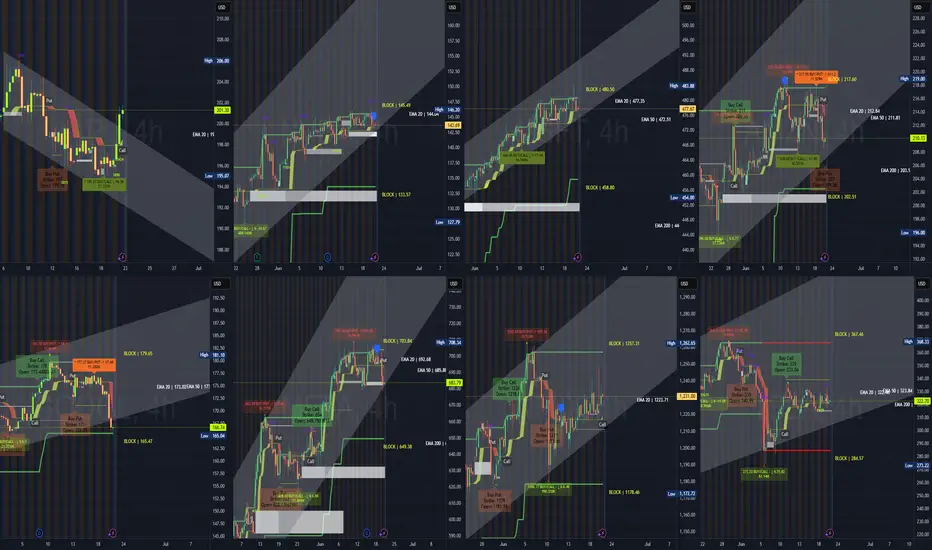
MAG7 - Jun 23, 2025 Institutional Swing Analysis – Jun 21, 2025
📈 AAPL
Trend: Reversal attempt in downtrend
Buy Zones (CALLs): 196 (accumulation)
Sell Zones (PUTs): 199 (distribution)
Support Block: —
Resistance: 201 → 204 → 206
Scenario: Above 200 = continuation to 204–206. Below 198 = back to 195–194.
📈 NVDA
Trend: Consolidating at resistance
Buy Zones: 142.5
Gap Support: 133.57 → 130.27
Support Block: 133.57
Resistance Block: 145.60
Scenario: Above 145.6 = breakout. Below 133.5 = gap fill toward 130.
📈 MSFT
Trend: Strong uptrend
Buy Zones: 466 (accumulation)
Gap Support: 458.8 → 450
Support Block: 458.80
Resistance Block: 480.50
Scenario: Holds 470 = test 485+. Below 458 = fill gap to 450.
📈 AMZN
Trend: Sideways in a wide range
Buy Zones: 212 (accumulation)
Sell Zones: 204, 200
Gap Support: 202.5 → 198
Support Block: 202.51
Resistance Block: 217.60
Scenario: Holding 210 = move to 217+. Below 202 = fill gap to 198–195.
📈 GOOGL
Trend: Bearish
Buy Zones: 175
Sell Zones: 172
Gap Support: 166.7 → 165.4
Support Block: 165.47
Resistance Block: 179.65
Scenario: Below 172 = gap test. Under 165 = risk to 160. Above 179.6 = reversal begins.
📈 META
Trend: Bullish but retracing
Buy Zones: 684
Sell Zones: 708
Gap Support: 683.8 → 649
Support Block: 649.38
Resistance Block: 703.84
Scenario: Holding 683 = move to 700+. Below 683 = gap fill to 649.
📈 NFLX
Trend: Sideways
Buy Zones: 1224
Sell Zones: 1178, 1200
Support Block: 1178.46
Resistance Block: 1257.31
Scenario: Over 1257 = breakout. Below 1220 = retest 1190.
📈 TSLA
Trend: Compressing sideways
Buy Zones: 313 (accumulation)
Sell Zones: 336, 319
Support Block: 284.57
Resistance Block: 367.46
Scenario: Above 336 = move to 355. Below 313 = test 300 → 284.
Profit taking on Netflix for the summer, only to buy in lowerNASDAQ:NFLX is still in a strong high time frame uptrend, I'm not saying the stock has turned bearish overall, however profits need to be taken when trading and this is one of those times.
I'd prefer to buy back in closer to $1,000 if possible though either way I'll keep 33% of my stack.

NFLX Short Setup: Bear Flag Break and Retest""
Simple Breakdown:
Pattern: Bear flag breakdown + lower high
Entry: $1,215.08 (break + retest zone)
Stop Loss: $1,230.02 (above recent high)
Target: $1,174.41 (prior support zone)
Risk/Reward: Approx. 1:2.7 ✅

Can Netflix Reach One Trillion Dollars? Can Netflix Reach One Trillion Dollars? The Market Already Bets on It
By Ion Jauregui – Analyst at ActivTrades
Netflix, the giant of digital entertainment, continues to cement its position as the global benchmark in streaming. With a market capitalization exceeding $515 billion, the platform is halfway to the trillion-dollar milestone, but more and more analysts and fund managers see this target as achievable in the medium term.
Strategies That Make the Difference
After the boom during the pandemic, Netflix faced fierce competition in its quest to gain and retain subscribers. The company responded with key measures: cracking down on password sharing, raising prices across its plans, and introducing an ad-supported subscription tier, an initiative that has significantly boosted performance metrics.
Thanks to this hybrid strategy, the company now boasts over 94 million monthly active users, many of whom fall within the highly desirable 18–34 age demographic, a segment with high long-term retention potential and strong appeal to advertisers.
Moreover, the platform has enhanced its advertising segmentation tools, enabling brands to reach their target audiences more precisely. Combined with Netflix’s data-driven content production model, this places the company in a highly competitive position compared to its industry peers.
Fundamental Analysis: Sustainable Growth and Competitive Edge
From a fundamental standpoint, Netflix is in a strong position with clear growth drivers:
• Revenue and earnings expansion: In the first half of 2025, the company reported over 15% year-on-year revenue growth and nearly 27% net income growth.
• Free cash flow on the rise: Both internal and external projections indicate that free cash flow (FCF) could double within five years, providing room for further content investment without increasing debt.
• Data-driven competitive advantage: Advanced analytics allow Netflix to optimize original content production based on viewing patterns, generating shows and films with higher success potential.
• Scalable model with increasing margins: The rising ARPU (average revenue per user) in the ad-supported tier suggests Netflix could boost margins without significantly raising operating costs.
• Low debt levels: With manageable net debt and healthy leverage ratios, the company retains financial flexibility for continued organic growth or share buybacks.
Analyst Ratings
According to TipRanks, 38 analysts currently cover Netflix stock. Of those, 29 rate it a Buy and 9 a Hold, with an average price target of $1,255.76.
• Highest price target: $1,600 – Jeffrey Wlodarczak (Pivotal Research)
• Lowest price target: $950
• JPMorgan rating: Hold, with a target of $1,220 – Doug Anmuth
These figures reflect solid market confidence in Netflix’s upward trajectory, though they also suggest that some of the optimism is already priced in.
Technical Analysis: Signs of Strength
Netflix closed Tuesday at $1,278.59, staying above key medium- and long-term resistance levels. The 50-period moving average has remained below the price since mid-April, reinforcing the bullish trend. The RSI is in overbought territory (71.62%), and although the MACD is no longer positive, momentum remains strong in the short term.
This is further supported by a Point of Control (POC) around the $985 level, which served as the support base for the previous upward leg. These mixed signals suggest that a consolidation phase could occur before the stock resumes a stronger upward movement.
The current upward channel has remained intact, pushing prices toward the upper bound, where a retest of limits is likely. A sideways phase between $1,282.57 and $1,400 may precede a new breakout attempt.
Conclusion
Netflix has shown exceptional adaptability in capitalizing on shifts in digital consumer behavior. With a solid financial foundation, sustainable growth, and unique competitive advantages in data and content, the company has a real shot at reaching a one-trillion-dollar valuation. Time and execution will ultimately decide whether that goal is achieved—but the groundwork is already in place.
*******************************************************************************************
The information provided does not constitute investment research. The material has not been prepared in accordance with the legal requirements designed to promote the independence of investment research and such should be considered a marketing communication.
All information has been prepared by ActivTrades ("AT"). The information does not contain a record of AT's prices, or an offer of or solicitation for a transaction in any financial instrument. No representation or warranty is given as to the accuracy or completeness of this information.
Any material provided does not have regard to the specific investment objective and financial situation of any person who may receive it. Past performance is not reliable indicator of future performance. AT provides an execution-only service. Consequently, any person acting on the information provided does so at their own risk.

The Classic 3 Step Rocket Booster StrategyThe rocket booster strategy is a classic.
This time around Netflix is on hot fire.
Netflix has outperformed Nvidia, Meta, And Apple.
-
No one is talking about Netflix and how its dominating
the stock market.
-
Am guessing that the reason being online entertainment
is on the rise.I remember about a year ago.
Hollywood writers went on strike.
-
This has destroyed the momentum of hollywood movies.
Today its no longer "cool" to watch the latest hollywood movie.
I never thought i would see this day come.
-
Today the "cool " crowd is on Netflix NASDAQ:NFLX
-
Now i want to show you how
to find this stock to trade.
-
First you need to understand the Rocket booster
strategy.
-
The 3 Step Rocket Booster Strategy
-
1-The price has to be above the 50 EMA
2-The price has to be above the 200 EMA
3-The price should gap up
-
That last step is very important so lets digest it using
the Stochastic RSI.
-
at the bottom you will see two lines.
-
That blue line crossed above the orange line.
This "gap" shows you momentum.
-
You can do this on the new tradingview screener
if you want a demonstration rocket boost this content
-
Rocket boost this content to learn more.
-
Disclaimer:Trading is risky please do not use margin.
Also use a simulation trading account first before you trade with real money
Also i want you to learn risk management and profit taking strategies
just in case you decide to use margin
no matter how small or large.
WEEK 16 - 20 JUN WAR, VIX OPTIONS, SPY MONTHLY OPTIONS ******** AAPL
Block High: 212.09
Block Low: 194.80
PUT Active: Strike 200.17
CALL Active: Strike 196
Open Gap: 198.22 → 195.70 (likely support retest or fill)
Channel: Bearish
Scenario:
Holding 195.70 = chance to fill gap to 198.
If 194.80 breaks = risk drops to 190–186.
******** NVDA
Block High: 145.00
Block Low: 137.46
PUT Active: Strike 145.25
Channel: Sideways
Scenario:
Support at 140–141 holding.
Over 145 = breakout. Below 137.5 = flush to 133.
******** MSFT
Block High: 479.37
Block Low: 457.50
PUT Active: Strike 475
Channel: Ascending
Scenario:
Strong demand near 470.
Above 479 = upside to 488+. Below 457 = pullback to 448.
******** AMZN
Block High: 217.60
Block Low: 207.64
PUT Active: Strikes 214, 212
CALL Active: Strike 212
Open Gap: 212.72 → 207.64
Channel: Downtrend with support defense
Scenario:
Gap can act as support. Bounce at 208–210 = move back to 215+.
Loss of 207.6 = risk to 202.
******** GOOGL
Block High: 179.65
Block Low: 169.91
CALL Active: Strikes 178, 175
PUT Active: Strike 172
Open Gap: 174.83 → ~170.6 (still active)
Channel: Uptrend
Scenario:
Above 176 = retest 179.
Below 172 = gap fill to 170, then 169.9 as key level.
******** META
Block High: 701.96
Block Low: 663.45
PUT Active: Strike 708.36
Open Gap: 688.60 → 670 (gap is open)
Channel: Soft descending
Scenario:
Holding 670 = chance to reclaim 700+.
Break of 663 = full gap fill to 640s.
******** NFLX
Block High: 1258.98
Block Low: 1187.95
PUT Active: Strike 1220
CALL Active: Strike 1190
Open Gap: None
Channel: Consolidation triangle
Scenario:
Breakout over 1229 = continuation to 1260+.
Below 1188 = pullback to 1160–1170.
******** TSLA
Block High: 356.53
Block Low: 277.59
CALL Active: Strike 313
PUT Active: Strike 336
Open Gap: 336.44 → 313.44 (wide open)
Channel: Broadening range
Scenario:
Defending 313 = move toward 336.
Loss of 313 = fills the gap to 300–290 range.

NFLX – Bearish Divergence Playing Out, $1,177 in FocusThis is a follow-up to my June 7 post where I highlighted a high-probability bearish divergence setup on Netflix. Since then, price has rejected from the supply zone and is now hovering above the critical $1,177 structure support.
🔍 What’s changed:
📉 Bearish divergence confirmed — price rejected the highs
🔻 Momentum continues to fade, RSI rolling down from >73
📊 Price now sitting on $1,177, the last higher low
📏 Fibonacci levels mapped for potential continuation if broken
📐 Key Levels:
Structure Support (still holding): $1,177
Breakdown targets (Fibonacci):
0.382 → $1,094
0.5 → $1,042
0.618 → $990
Resistance to monitor for retest: $1,240–$1,260
🧠 Outlook:
If $1,177 holds → we may bounce temporarily.
If it breaks → bearish continuation likely, targeting 5–10% lower.
The bearish divergence setup is now in motion. Structure will determine whether this turns into a full breakdown.

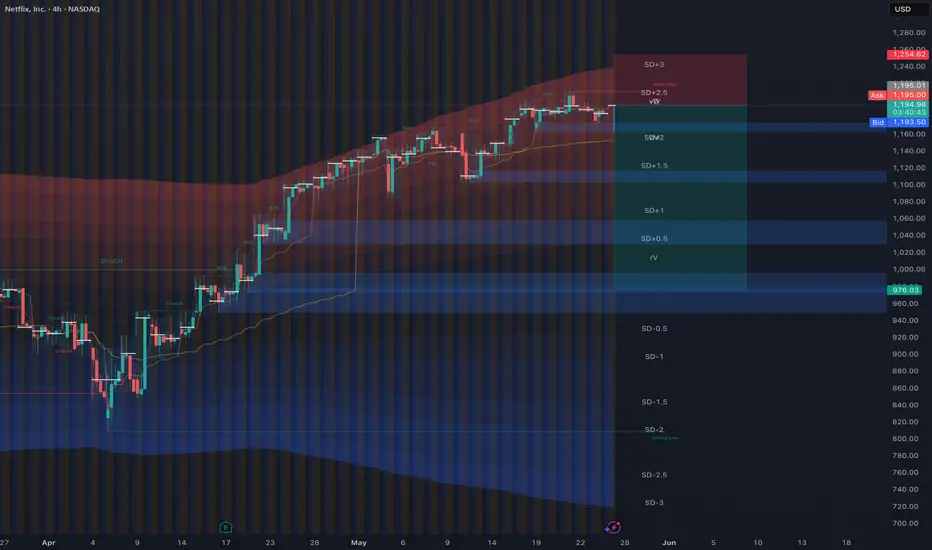
Unsustainable GrowthMy buy zones are below, as we approach the 1.618 extension this insane wave looks like it may out of steam soon. As a best-guess approach I will wait for the 0.618 price or go look for another stock if that doesn't materialize

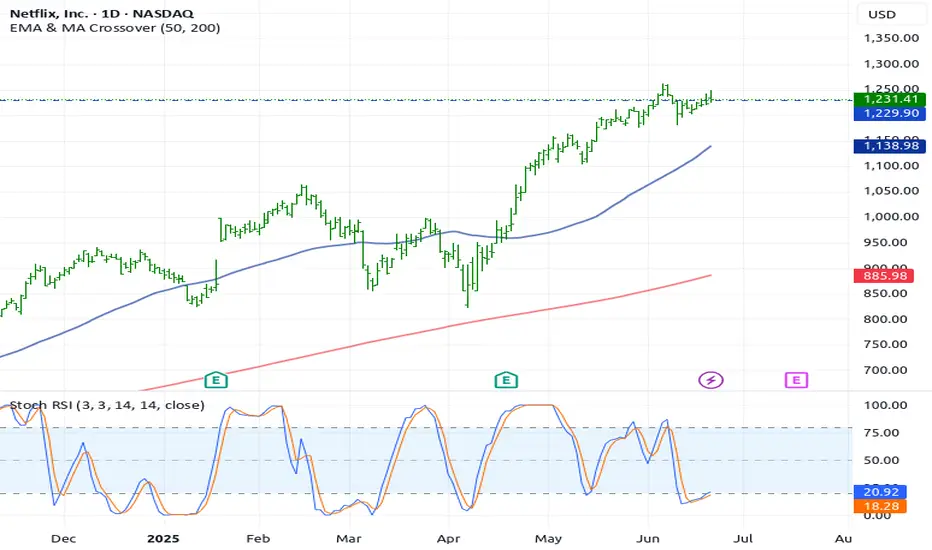
Netflix (NFLX) RSI Bearish Divergence Setting Up Major Rever📈 Summary:
Netflix has rallied +44% in just 60 days, entering a steep, parabolic move. However, technical exhaustion signs are now flashing across multiple indicators — suggesting a potential near-term top may be forming.
🔍 Key Technical Observations:
1. Bearish RSI Divergence
The RSI is making lower highs (~73) while price makes higher highs → classic bearish divergence.
Similar divergences in December and February led to drops of –12% and –18% , respectively.
2. Parabolic Move + Rising Wedge
Price has broken out of an orderly channel and is now moving parabolically , a pattern typically unsustainable.
The current structure resembles a rising wedge , often a reversal formation .
3. Volume Weakness
Volume has been declining throughout the recent push , signaling weak demand behind the rally.
No climactic buying — this raises the risk of a sharp drop if momentum fades .
4. MACD Losing Momentum
MACD histogram has flipped slightly negative.
A potential bearish crossover is brewing.
🧭 Strategy Outlook
🚨 Aggressive traders could look for short opportunities below $1,240 , where support may break.
🧠 Options traders might consider a bear call spread once a daily close confirms the wedge breakdown.
📌 Key Levels
Support to watch: $1,240 (break = confirmation)
Next support zone: $1,190–1,155 (EMA cluster)
Critical RSI trigger: break below 65 confirms bearish divergence playing out
🧩 Final Thoughts
The RSI divergence, parabolic structure , and volume behavior all align for a potential pullback . While the trend is still technically intact, risk-reward favors preparing for a reversal , especially with prior divergences leading to significant downside.

Trade3After securing profits from the first trade, I believe we might see a retest of the golden zone before a potential move down toward the previously marked area — at the very least.

Netflix Update:The 1-hour candle has closed below the golden zone of the
previous 1-hour candle (though I would have preferred a
close below the entire golden zone). Nonetheless, this gives
me enough confirmation to enter a short position. My
stop-loss will be triggered if a 15-minute candle closes above
the high of the hourly candle. The target is shown in the
chart.

NFLX Goes ParabolicIf you look at the monthly chart for NFLX, you will see how NFLX has screamed to new ATH over the last few weeks. Analysts have increased Netflix's price target to an absurd $1400+ while P/E sits at a very high 57.60. Over the next few weeks, I am expecting the broader market to selloff into July and have a PT of 1175 and 1106 for NFLX through the end of June through middle of July. 1241 is my final upside target for NFLX which it will likely hit today or tomorrow.

Bearish NFLXBearish Outlook on NFLX Despite Uptrend
While Netflix's stock has shown impressive growth- up 92%
over the past year and 37% year-to-date - I maintain a
bearish perspective due to several fundamental and technical
concerns:
1. Overvalued P/E Ratio:
Netflix is currently trading at a forward P/E ratio of
around 45x, significantly higher than many of its peers in
the streaming and tech sectors. This valuation implies
high expectations for future growth, which may not be
sustainable given rising competition and market
saturation. If growth slows even slightly, the stock could
face sharp corrections.
2. Intensifying Competition:
Free movie download sites and low-cost IPTV services
now offer broader content libraries at prices far below
Netflix's monthly subscription. These alternatives,
especially in emerging markets, pose a real threat to
Netflix's long-term subscriber growth.
3. Insider Selling Activity:
Key executives, including CFO Spencer Neumann and
Director Jay C. Hoag, have recently sold large amounts of
stock. While insider selling isn't always bearish, the
timing - near all-time highs - raises questions.
4. Analyst Price Target Hikes:
Recent bullish price target increases (e.g., Jefferies to
$1,400) could be interpreted as institutions looking to
exit positions by attracti ng buyers at higher levels,
especially after most short positions have been cleared.
5. Regulatory Risks:
Proposed U.S. tariffs on foreign film content could raise
costs for Netflix, forcing price hikes or reduced margins.
Technical Note:
Despite the uptrend, I remain cautious. My stop loss is tied to
the daily close. A break below key support on a closing basis
could confirm a reversal.

Netflix is a *little* over extendedNetflix chart looks bullish, but I do think now it looks over extended. Historically when it's broken above the Nadaraya-Watson Envelope upper band, it has retraced back down.

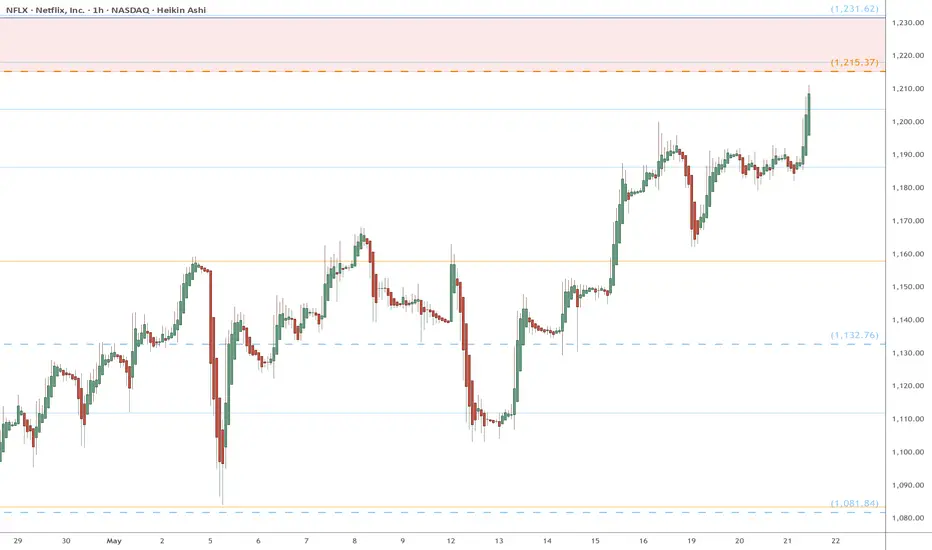
NFLX heads up into $1230: Major Resistance zone may give a DipNFLX has been on a tear but nearing a major resistance.
$1215.37 is a Golden Covid fib forming bottom bound.
$1231.61 is a minor Genesis fib forming the top bound.
It is PROBABLE that we see a dip from there.
It is POSSIBLE to consolidate within the zone.
It is PLAUSIBLE to break-and-retest to go more.
.
Previous Analysis that caught the BOTTOM
==================================================
.
NFLX BUYBUY NFLX at 978.00 to 909.00, riding it back up to 1225.00 to 1320.00 as Profit Targets, Stop Loss is at 820.00!
If anyone likes mumbo jumbo long useless analysis,
than this is NOT for you.
Also, if you are afraid of risk, failure, and want only a 100% sure thing, than...
run as fast as you can from here and from the markets,
because it is definitely NOT for you.
WARNING: This is just my opinion of the market and its only for journaling purpose. This information and any publication here are NOT meant to be, and do NOT constitute, financial, investment, trading, or other types of advice or recommendations. Trading any market instrument is a risky business, so do your own due diligence, and trade at your own risk. You can loose all of your money and much more.

NFLX Weekly Options Outlook — June 1, 2025🚨 Multi-Model Summary
This week’s analysis from top AI models (Grok, Claude, Llama, Gemini, DeepSeek) shows moderate bullish momentum for NASDAQ:NFLX , with a range of technical insights and trade strategies.
🧠 Model Highlights
Grok (xAI)
🔹 Technicals: Price above 10EMA, nearing overbought.
🔹 Sentiment: Bullish news (BofA), VIX low.
🔹 Trade: Buy $1290C @ $0.94 → PT $1.41 / SL $0.47
🔹 Confidence: 60%
Claude (Anthropic)
🔹 Technicals: Strong EMAs, bullish MACD on 5M.
🔹 Sentiment: BofA upgrade + options flow into $1300.
🔹 Trade: Buy $1220C @ $12.25 → PT $18–20 / SL $8
🔹 Confidence: 72%
Llama (Meta)
🔹 Technicals: Bullish near-term; RSI normalized.
🔹 Sentiment: BofA bullish note, minor CNBC drag.
🔹 Trade: Buy $1290C @ $0.94 → PT $2.50 / SL $0.40
🔹 Confidence: 65%
Gemini (Google)
🔹 Technicals: Uptrend, MACD divergence noted.
🔹 Sentiment: Strong BofA note, watch $1180 max pain.
🔹 Trade: Buy $1250C @ $4.40 → PT $6.60 / SL $2.20
🔹 Confidence: 60%
DeepSeek
🔻 Bearish Divergence
🔹 Technicals: Overextended short-term.
🔹 Sentiment: Max pain + put skew → downside risk.
🔹 Trade: Buy $1100P @ $0.71 → PT $1.77 / SL $0.35
🔹 Confidence: 65%
✅ Consensus Takeaways
🟢 4 out of 5 models lean bullish
📊 Price > EMAs, sentiment tailwind (BofA upgrade)
⚠️ Max pain at $1180 could act as late-week magnet
⚡ Risk-on setup but overbought—watch for short pullbacks
🎯 Chosen Trade Setup
💡 Trade Idea: Buy NFLX $1220C (2025-06-06)
💵 Entry: $12.25
🎯 Target: $18.40 (+50%)
🛑 Stop: $7.96 (−35%)
🔢 Size: 1 contract
🧠 Confidence: 70%
⏰ Entry: At open (Monday)
⚠️ Key Risks to Watch
RSI near overbought → potential pause
Max pain gravity at $1180 into Friday
Late-week gamma decay = faster premium loss
Macro news or earnings surprises may shift bias
📊 TRADE DETAILS (JSON)
json
Copy
Edit
{
"instrument": "NFLX",
"direction": "call",
"strike": 1220.0,
"expiry": "2025-06-06",
"confidence": 0.70,
"profit_target": 18.40,
"stop_loss": 7.96,
"size": 1,
"entry_price": 12.25,
"entry_timing": "open",
"signal_publish_time": "2025-06-01 16:24:59 EDT"
}

NFLX is looking nastyPositive sentiment at ATH, nobody even dares shorting it, all while being extremely overbought and consumers short on expendable income. I've seen this before.
NFA. TP and SL are not accurate, I just used the short position tool to show direction. I'm in position with 1100p looking to TP around 1065 and 980.
The 3 Reasons Why Netflix Stock Is A Good BuyIt has been one of the most stressful weeks of my life.
Filled with unexpected drama on my end.
Am trying to pass a medical exam so that
I can pursue a driving career. Thats my dream.But sadly
things are still in slow motion. Eventhough
pursuing a new dream has given me time to
reflect.Not only on my trading strategies, but also
on a personal level.
You need to write down and jorunal your
trades .This is what am doing.I am writing down all my
mistakes.And also my best trading ideas.
The 3 Reasons why am looking at this trade:
#1 - The Stochastic +RSI has crossed Below the
50 level - This shows you a divergence or in
other words a turning point.
#2 -The candle stick pattern you are seeing
is called: "The Northern Star" -This is a very bullish
candlestick pattern.
#3 -The main markets which include-
SP500
NASDAQ 100
Dow Jones 30
Are all going to trend upwards this coming week.
Word on the street is the Market is on fire🔥
The 3 Reasons NASDAQ:NFLX Is A Good Buy
This stock is following the rocket booster strategy
which has 3 steps as follows:
- The price is above the 50 Day Moving Average
- The pirce is above the 200 Day Moving Average
-The price is trending upwards.-In this case a bullish
candlestick pattern called the Northern Star .
This is how you find the best stocks to trade:Always look for
momentum.
In order to learn more rocket boost this content.
Disclaimer:Do not use margin.Trading is risky.Please
learn risk management and profit taking strategies.
Also feel free to use a simulation trading account
before you trade with real money.
