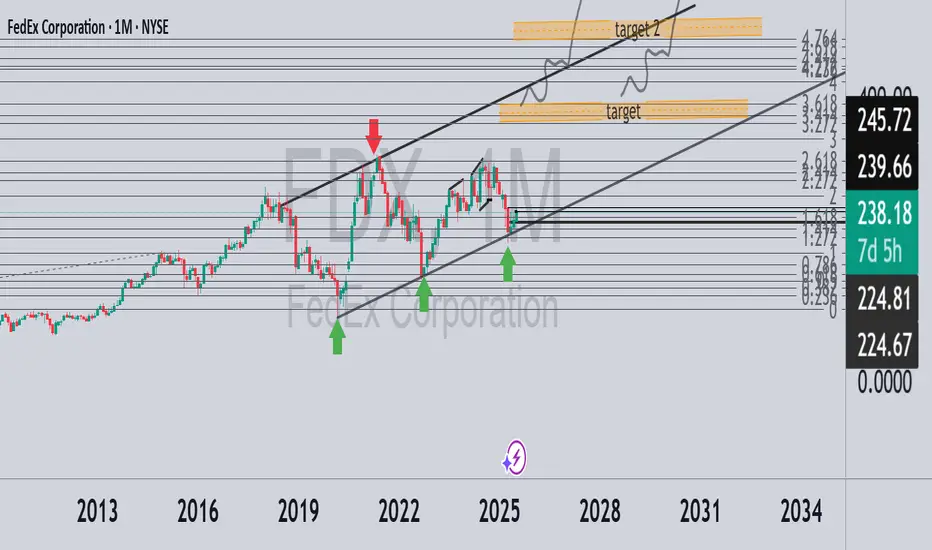
FedEx - Is the recovery process here yet? FDX The monthly chart of FedEx (symbol: FDX) shows a classic ascending channel pattern, with the price touching the bottom of the channel several times and finding support (green arrows), and on the other hand stopping several times at the upper resistance line (red arrow).
In July, we received a strong monthly candle with a jump of almost 5%, right on the central support line - which indicates the beginning of a new upward move.
🎯 Two main targets in the medium term:
Target 1: Around the 3.618 Fibonacci levels - a significant resistance area from the past. If we manage to break through it, we will continue to...
Target 2: Level 4.764 - the wider target according to the channel pattern.
✅ A clear similarity to what happened with CRWD stock in the past: there too we received a decline to support with a green monthly candle - which led to a strong breakout later.
👀 Reddit also noticed this as early as July 18, exactly at the moment when the positive deviation from the lower channel began – the first hint of a change in trend.
0QZX trade ideas
QuickView :FDXThe daily chart is rocking.
Bullish crossover, bullish Price action and Bullish ATR Break.
Looking for new positive price action.
Ready to catch it
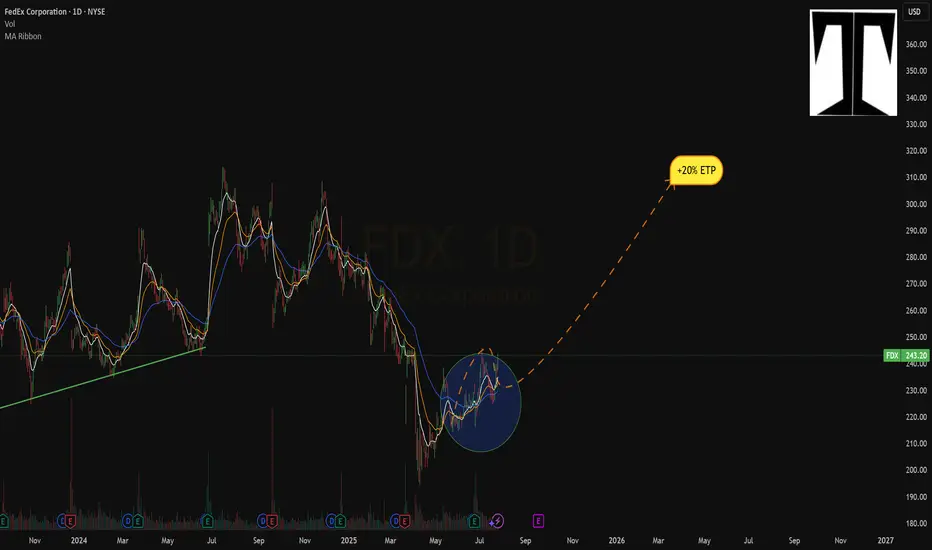
FedEx LongMy predictions are not investment advises...do your own analysis. I am not responsible for your losses.
The price will go up...to the target area..
If the prediction is correct please boost the idea.

FedEx (FDX) – Cautious Bullish SetupNYSE:FDX Price is testing the upper Bollinger Band, while Stochastic shows overbought conditions (78–82), which may trigger a pullback or sideways move.
✅ RSI remains strong above 50, showing momentum is still positive.
🎯 Idea: Wait for earnings or a breakout above $230–$231 zone for confirmation. Alternatively, look for entry after a small dip toward $222 support (SMA 20).
🕓 Earnings report is approaching – watch volatility!

Will FedEx See a Big Swing Following Next Week’s Earnings?Shares of FedEx NYSE:FDX have often swung quite violently following release of the delivery-service giant's quarterly earnings. What does FDX’s chart and fundamental analysis say might happen after the firm reports results next Tuesday (June 24)?
Let’s check:
A History of Big Swings
Looking at just FedEx’s past five quarterly reports, its stock did the following in next trading day:
-- March 23, 2024: Rose 7.4%.
-- June 26, 2024: Gained 15.5%.
-- Sept. 20, 2024: Surrendered 15.5%.
-- Dec. 20, 2024: Closed essentially flat at -0.05%.
-- March 21, 2025: Gave up 6.5%.
Oh, and that one not-so-violent-looking result -- the 0.05% loss on Dec. 20 December -- actually came during an extremely volatile session for the stock. FedEx shares had been up as much as 7% that day, but managed to give that all back by the close.
And as I write this column, the options market is pricing in FedEx seeing a 6%-8% move by next Friday's weekly expiration following next week’s earnings release.
FedEx’s Fundamental Analysis
Analysts’ consensus estimate for next week’s earnings called at last check for the company to report $5.91 in adjusted earnings per share on $21.8 billion of revenue.
That would represent a 9.2% gain year over year for adjusted EPS, but about a 1%-2% contraction in revenues.
But interestingly, 19 of the 20 sell-side analysts that I can find that cover FDX have lowered their earnings projections since the quarter began.
It’s also worth noting that FedEx raised its quarterly dividend on June 9 ahead of the upcoming earnings. I can’t say whether that means management is bracing for ugly results, but it does put that thought into my head.
FedEx’s Technical Analysis
Now let’s look at FDX’s chart going back to April 2024:
Readers will see that FedEx sold off rather sharply coming out of a so-called “double-top” pattern of bearish reversal that stretched from March 2024 to about March 2025 (marked “Top 1” and “Top 2” in the chart above).
What happened at that point is that the stock kept putting in lower highs. And once we got to April, the stock started putting in higher lows as well.
In fact, FDX has developed what’s known as a “pennant formation” over the past 10 weeks or so, as denoted by the two purple diagonal lines at the chart’s right.
What typically happens when these pennants close is that the underlying security will move violently one way or the other (although you can’t necessarily predict which way).
In this case, FedEx’s pennant happens to be closing just as the company is about to release earnings -- and we know what’s happened in the past when FDX reports (violent swings).
Add it all up and it suggests that many traders might employ strategies here that focus on volatility (such as straddles or strangles) instead of a directional play involving FedEx stock or options.
Looking at the rest of FedEx’s chart, we see that the stock’s Relative Strength Index (the gray line at top) is neutral to better-than-neutral.
FDX’s daily Moving Average Convergence Divergence indication (or “MACD,” marked with black and gold lines and blue bars at bottom) is also about as non-committal as we usually see.
The histogram of the stock’s 9-day Exponential Moving Average (or “EMA,” marked with blue bars) is close to zero-bound. So are both the 12-day EMA (black line) and 26-day EMA (gold line).
That could mean traders either expect no real reaction to next week’s earnings -- or are expecting an oversized reaction, but have no idea as to its direction.
(Moomoo Technologies Inc. Markets Commentator Stephen “Sarge” Guilfoyle had no position in FDX at the time of writing this column.)
This article discusses technical analysis, other approaches, including fundamental analysis, may offer very different views. The examples provided are for illustrative purposes only and are not intended to be reflective of the results you can expect to achieve. Specific security charts used are for illustrative purposes only and are not a recommendation, offer to sell, or a solicitation of an offer to buy any security. Past investment performance does not indicate or guarantee future success. Returns will vary, and all investments carry risks, including loss of principal. This content is also not a research report and is not intended to serve as the basis for any investment decision. The information contained in this article does not purport to be a complete description of the securities, markets, or developments referred to in this material. Moomoo and its affiliates make no representation or warranty as to the article's adequacy, completeness, accuracy or timeliness for any particular purpose of the above content. Furthermore, there is no guarantee that any statements, estimates, price targets, opinions or forecasts provided herein will prove to be correct.
Moomoo is a financial information and trading app offered by Moomoo Technologies Inc. In the U.S., investment products and services on Moomoo are offered by Moomoo Financial Inc., Member FINRA/SIPC.
TradingView is an independent third party not affiliated with Moomoo Financial Inc., Moomoo Technologies Inc., or its affiliates. Moomoo Financial Inc. and its affiliates do not endorse, represent or warrant the completeness and accuracy of the data and information available on the TradingView platform and are not responsible for any services provided by the third-party platform.

FedEx: Balancing Act or Precarious Gamble?Recent market activity highlights significant pressure on FedEx, as the logistics giant grapples with prevailing economic uncertainty. A notable drop in its stock price followed the company's decision to lower its revenue and profit outlook for fiscal year 2025. Management attributes this revision to weakening shipping demand, particularly in the crucial business-to-business sector, stemming from softness in the US industrial economy and persistent inflationary pressures. This development reflects broader economic concerns that are also impacting consumer spending and prompting caution across the corporate landscape.
In response to these domestic headwinds, FedEx has adopted a more conservative operational stance, evidenced by a reduced planned capital spending for the upcoming fiscal year. This move signals an emphasis on cost management and efficiency as the company navigates the current economic climate within its established markets. It suggests a strategic adjustment to align spending with the revised, more cautious revenue expectations.
However, this domestic caution contrasts sharply with FedEx's concurrent and ambitious expansion strategy in China. Despite geopolitical complexities, the company is making substantial investments to enlarge its footprint, building new operational centers, upgrading existing gateways, and increasing flight frequencies to enhance connectivity. This dual approach underscores the central challenge facing FedEx: balancing immediate economic pressures and operational adjustments at home while pursuing a long-term, high-stakes growth initiative in a critical international market, all within an uncertain global environment.

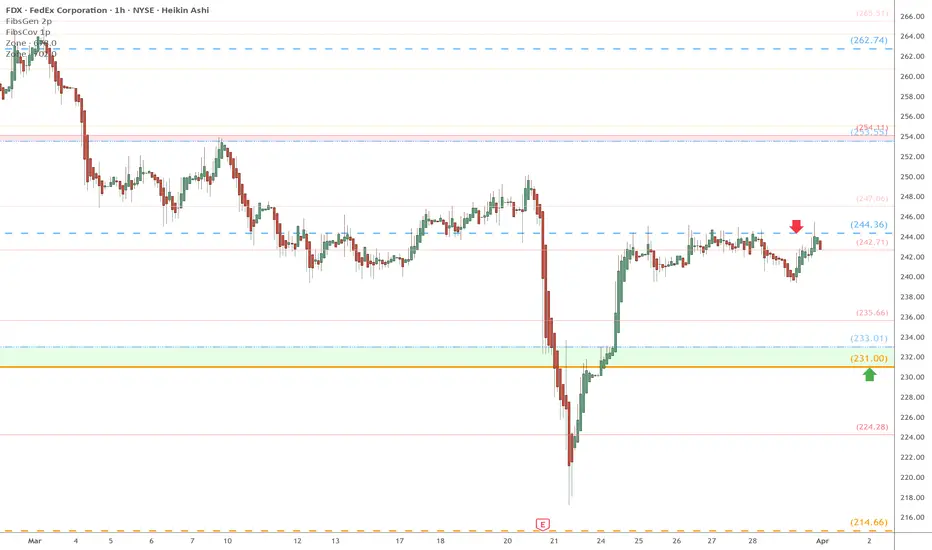
FDX watch $244.36: SemiMajor Covid fib giving furious resistanceFDX dumped upon last earnings but has been trying to recover.
Currently struggling against a semi-major covid fib at $244.26
It seems likely it will reject to green support zone $231 -233
======================================================
FDX FedEx Corporation Options Ahead of EarningsIf you haven`t sold FDX before the previous earnings:
Now analyzing the options chain and the chart patterns of FDX FedEx Corporation prior to the earnings report this week,
I would consider purchasing the 240usd strike price Calls with
an expiration date of 2025-3-21,
for a premium of approximately $12.00.
If these options prove to be profitable prior to the earnings release, I would sell at least half of them.

The #1 Power Of A Chart Patterns Analysis Am feeling low on courage and energy because of this i decided to do some yard maintenance work 😊
Just to remove my negative thoughts even as we trade mental health is very important.
Am following this awesome newsletter watchlist recommend to me by Tim Sykes.
This i where I got the idea of how to trade a break down strategy.
👇Let's look at this chart analysis together 👇
What you are looking at on the chart
Is called the Bearish Engulfing Pattern.
This is when the Red candlestick on the right is longer than the green candlestick on your left.
Also notice the rocket booster strategy on the downside:
1-The price is below the 50 EMA
2-The price is below the 200 EMA
3-The price is gapped down
The last step is very important now the a look at the the RSI moving averages the have crossed in a resistance zone...
In order to learn more about it rocket boost this content.
Disclaimer ⚠️ Trading is risky please learn more about risk management and profit taking strategies.Also feel free to use a simulation trading account before you use real money.

FDX 267.5 PUT Exp 2/21/25 (Win)Saw multiple confluences on higher timeframes. Broke a weekly uptrend to the downside, came back to retest the consolidation box it made, retested the weekly trend line break, Hit the 61.8% fibonacci retracement level, and formed a gap on a smaller timeframe.
Broke a structure level and broke a mini counter trend on the 1HR timeframe, came back to retest the level it broke and the counter trend, and then tanked to my take profit level for the win.

Major Price Movement Incoming for FDXSignalist has detected a precise pattern in NYSE:FDX trading activity, signaling that a substantial price movement is imminent. This isn’t a random fluctuation—it’s a carefully analyzed precursor to a significant market event.
📅 What to Expect:
⌛ Timeline: Anticipate a major move within the next 1 to 4 upcoming 3-hour candles.
📈 Monitor the Charts: Keep an eye on FDX’s price action over the next few candles.
Prepare Your Strategy: Whether you’re bullish or bearish, have your trading plan ready to capitalize on the move.

Long because of my algo and not this sh!tsh0w of a chartDo not adjust your eyes or screen. There are no parts of this chart missing. Either FDX management is horrifyingly poor at guidance or the analysts that follow this one are really poor at their jobs. No matter, this hopefully won't last long enough for me to worry about whoever is incompetent at their job.
Full disclosure: I am not personally trading this. Not because of the freakish chart, but because I am already exposed to 3 other stocks in the shipping space and I'm already too heavily exposed. I was going to go long NYSE:GPN , but about 2 min before the close it went up a few pennies and ruined my plan. It was the difference for my algo between GO and NO. I have learned to follow it unquestioningly and hopefully that one will be a go tomorrow.
So why FDX then? I screened every stock with a market cap of 2 billion and above and this one had the best track record with my algo. I only give you guys the best stuff...you're welcome. Also, earnings are in the rearview mirror at this point, which based on the chart, should be an obvious non-negotiable when trading this one.
Anyway, here's the deal. Throughout the backtest history going all the way back to May of 1978, my algo paired with this exit strategy are a near perfect 1603-1 on NYSE:FDX , although that 1 is a trade from this past early December that would technically still be open. Think of all the chaotic times that covers and it turned a profit every time.
The average gain per trade is 1.7% with an average holding period of 18 days. Now most of those trades closed in under a week, but some REALLY long trades during the Great Recession and others pooped in everyone else's punchbowl and ruined the average. Even with those, it has still produced an average gain per day held of .094% which is better than 2x the average daily return of SPY, historically.
Oh by the way, for the chart worshippers out there, I guess you can hang your hat on the fact that it closed juuuuust above support (such that it is with a chart like this one).
So IF I was trading this, per my usual strategy, I'll add to my position at the close on any day it still rates as a “buy” according to my algo, and I will use FPC (first profitable close) to exit any lot on the day it closes at any profit. Even though I'm not trading it personally, I'll update it as if I were.
270.03 would be my initial entry price, though it traded lower after hours.
As always - this is intended as "edutainment" and my perspective on what I am or would be doing, not a recommendation for you to buy or sell. Act accordingly and invest at your own risk. DYOR and only make investments that make good financial sense for you in your current situation.

Fedex Earnings Fedex earnings today , here is your trade at CMP, Target as marked .
#earnings #FEDEX #stock #market

FDX ....Fedex levels for todays earnings pt.1Simple and self explanatory for the levels of concern or price action...Fib lines and channels...play accordingly

FDX ....Fedex levels for todays earnings pt.2Simple and self explanatory for the levels of concern or price action..

FEDEX IS BULLISH Dec 15 2024 READ DESCRIPTION Fedex is looking very good at cmp but I will wait for lower levels around $274s to get a better RR. If yku have any questions feel free to leave a comment.

FDX has Bull Swing Trade PotentialI sometimes think analyists are on the smoke too often, however that makes picking off a panic sell easier.
In the screenshot I waited to see how serious the sell off was going to be and put in a light Buy Call Option trade on 9/24 with a sell target in the $270's depending on market condition. September has traditionally been an odder month than most so I cautious play my trades.

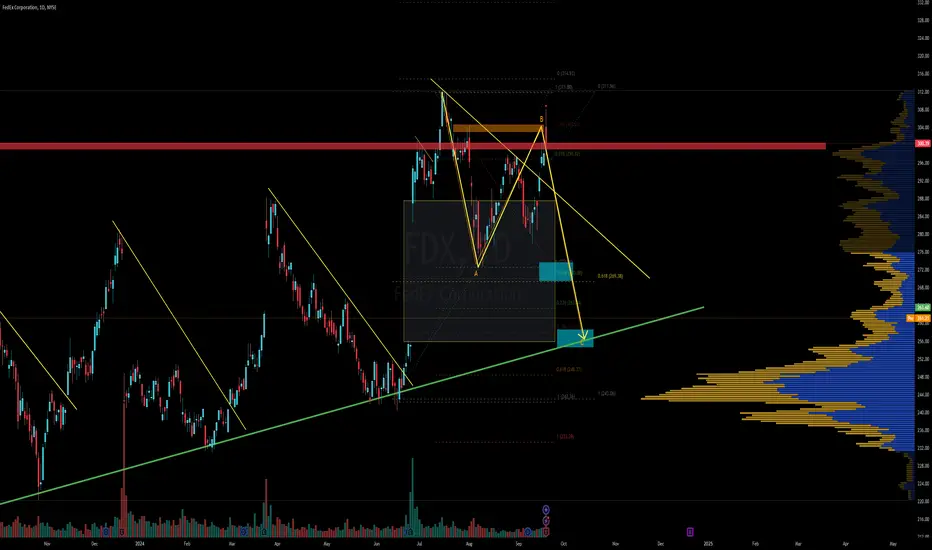
Technical Analysis on FedEx (FDX)Despite the long- and short-term uptrend, FedEx stock displays some peculiar behavior, with frequent gap ups and gap downs, mostly occurring around earnings reports. Some gap downs have reached up to 20%, but were quickly filled shortly thereafter.
Recently, the stock reached its all-time high, only to be rejected. Therefore, the $320 area serves as a strong resistance (RES) that needs to be broken for the stock to resume its bullish trend.
Bullish Scenario
Following the release of the latest earnings report and declining revenue, the stock dropped 15% in a single day, creating a new gap down. With this decline, the price is now approaching a key volume area, the POC zone around $250. This area could act as support, containing the price and potentially initiating a rebound.
Bearish Scenario
If the POC area fails to hold the price, the stock could continue its decline toward a static support zone around $200.
FedEx remains an interesting stock to watch, especially considering how it reacts in the coming weeks and its ability to maintain key support levels.

Lower oil lower operation Cost? Lower Operating Costs
FedEx relies heavily on fuel for its transportation network, which includes planes, trucks, and delivery vehicles. Fuel is one of FedEx's largest operational costs. If oil and gas prices are kept lower due to increased production, FedEx would benefit from reduced expenses in several ways:
Fuel for Aircraft and Vehicles:
Lower oil prices translate directly to cheaper jet fuel for their aircraft fleet and diesel for their ground vehicles, reducing overall shipping costs.
Increased Margins: As fuel is a major cost component, lower prices improve profit margins without requiring significant adjustments in FedEx’s pricing or operations.
Less Surcharge Pressure: FedEx (like other logistics companies) often imposes fuel surcharges on customers to offset rising fuel costs. When fuel prices drop, the company may reduce these surcharges, making its services more competitive without eating into profits.
2. Competitive Advantage
With fuel costs declining, FedEx can maintain its prices at competitive levels or even reduce them. Lower fuel expenses allow them to price more aggressively in relation to competitors such as UPS, DHL, and Amazon, especially in bulk shipments and long-distance international deliveries. It can also use the extra cash flow to invest in network improvements, further increasing its competitive edge.
3. Increased Demand for Shipping Services
Lower Shipping Costs Encourage Demand: Lower operating costs could enable FedEx to pass savings on to consumers and businesses, making shipping services more affordable. This could drive increased demand for shipping and logistics services, particularly in the e-commerce space.
Fuel-Intensive Business Models Benefit: Companies in sectors such as retail, manufacturing, and wholesale that rely on FedEx for shipping could see their own costs decrease, increasing their reliance on FedEx for cost-effective deliveries.
4. Boost to Consumer Spending
Lower gas prices generally boost consumer disposable income. With more money in consumers' pockets, they tend to spend more on goods, especially through e-commerce channels. Since e-commerce is a major driver of FedEx’s revenue, increased consumer spending can lead to more packages being shipped, benefiting FedEx’s bottom line.
5. Global Economic Growth
Low oil prices can stimulate broader economic growth by reducing transportation and production costs globally. As a company with international operations, FedEx is well-positioned to benefit from rising global trade and shipping volumes as businesses grow and expand in a lower-cost environment.

FDX is a BUY at $242++++We hit some support on Fridays drop but I believe this will gravitate lower to $242 strong support FDX is highly oversold on 4 hour and under charts but one day has room lower. Will be watching for under $245 to start a position and buy calls

Fedex Taking Flight?Fedex took a 10% dip today based on their earnings report on Sept. 19th, 2024. Their profit showed a decline of profit near $382 million year over year. However reading into it, they invested heavily in cost reductions and optimization that should start being evident in the next year or so. Fedex right now seems like an undervalued stock pick. We could possibly see a correction to the Gap Fill Target of 300$ in the next two or three weeks.

FedEx Shares Drop 13% Amid Weak Demand for Priority DeliveriesFedEx Corp (NYSE: NYSE:FDX ) witnessed a significant 13.28% tumble in its stock price as weak demand for high-margin priority delivery services led the company to slash its annual revenue forecast. This drop has raised concerns among investors, highlighting challenges faced by the global logistics giant. But is this decline a buying opportunity? Let’s break down both the fundamental and technical aspects of the situation.
Weak Demand and Forecast Downgrades
FedEx (NYSE: NYSE:FDX ), often seen as a bellwether for global trade, has struggled with declining demand for its priority shipping services, particularly between businesses, as companies look to cut expenses. CEO Raj Subramaniam cited weaker-than-expected industrial demand as a primary reason for the reduced profits, signaling a slowdown in global economic activity.
Key challenges that have impacted FedEx's financials include:
- Lower Revenue Forecast: The company downgraded its revenue growth forecast for fiscal 2025 to low single digits, compared to the previous expectation of low-to-mid single-digit growth.
- Profit Decline: FedEx also reduced the upper range of its full-year adjusted earnings per share (EPS) forecast to $20-$21, down from the previously projected $20-$22, reflecting a more competitive pricing environment and ongoing economic challenges.
- Contract Loss: The winding down of its contract with the U.S. Postal Service (USPS), FedEx's largest client, is expected to result in a $500 million hit to revenue in the current fiscal year. This is another significant blow as it reduces a critical revenue stream for the company.
However, amidst these difficulties, FedEx (NYSE: NYSE:FDX ) is undergoing a major restructuring with its **DRIVE program**, aimed at cutting billions in overhead costs and improving operational efficiencies. While the program’s savings are expected to accelerate over the coming quarters, analysts remain cautious about the near-term outlook, noting that FedEx's pricing power is constrained, especially in the competitive logistics market.
Despite these challenges, some analysts see a silver lining. JP Morgan’s Brian P. Ossenbeck mentioned there is “room for optimism” as cost savings from the DRIVE initiative take effect, particularly during the upcoming peak holiday season.
Technical Outlook: Gap Down Pattern and Potential Buy Zone
From a technical standpoint, FedEx’s sharp 13% drop has created an interesting setup for investors. The stock was already showing signs of exhaustion after its recent rally, and with this premarket decline, FedEx (NYSE: NYSE:FDX ) is entering oversold territory.
Key Technical Indicators:
As of yesterday, FedEx had an RSI of 64.97, placing it in the upper range but still not yet overbought. However, with the sharp premarket drop, the RSI will now head towards a sell zone, indicating potential overselling pressure. Also, FedEx's stock chart has exhibited multiple gap-up patterns that have remained unfilled since December 2023, March, and June 2024. With the current gap down in premarket trading, these unfilled gaps are now being addressed. Historically, gap patterns tend to be filled, suggesting that a rebound may occur once this downward gap is complete.
FedEx (NYSE: NYSE:FDX ) is now approaching a key technical support level formed in June 2024, around the $265-$270 range. This level could act as a floor, providing some price stabilization and potentially a buying opportunity for long-term investors.
Buying Opportunity?
With FedEx (NYSE: NYSE:FDX ) now approaching a significant gap down pattern and entering oversold conditions, it could be an opportune time for investors looking for a potential bounce. As the saying goes, "everything that goes up must come down and vice versa," and with FedEx (NYSE: NYSE:FDX ) filling these long-standing gap-up patterns, a reversal might be in the cards.
However, caution is warranted as market sentiment will likely remain fragile in the near term, especially as FedEx (NYSE: NYSE:FDX ) grapples with weak industrial demand and the upcoming USPS contract loss. That said, the DRIVE initiative’s cost-cutting efforts, coupled with a possible rebound in demand during the peak shipping season, may help FedEx recover.
Conclusion:
FedEx’s sharp 13% drop reflects deeper concerns about weakening demand and competitive pressures, but the company’s restructuring efforts and cost-cutting initiatives provide a glimmer of hope. On the technical side, the stock is approaching oversold conditions, and the filling of gap patterns suggests that a bounce could occur. For long-term investors, this dip may present a buying opportunity, especially if FedEx (NYSE: NYSE:FDX ) can successfully execute its DRIVE program and regain pricing power in the quarters ahead.
