Blackberry good for a breakout?I believe with news Tuesday BB may see a nice gain. Sell the news - you know how it goes.
0R0P trade ideas

Blackberry: the once-old-now-new fruit on the marketBlackberry is pure cash here. Cash money baby, and has been pure cash in this historical low zone for like 6 years, basically since Apple decided to go balls to the wall.
Blackberry is up to something, and I'd definitely bet on them. Last price markup from this zone resulted in tremendous gains.
Wyckoffian logic here, fellas. Plain and simple.

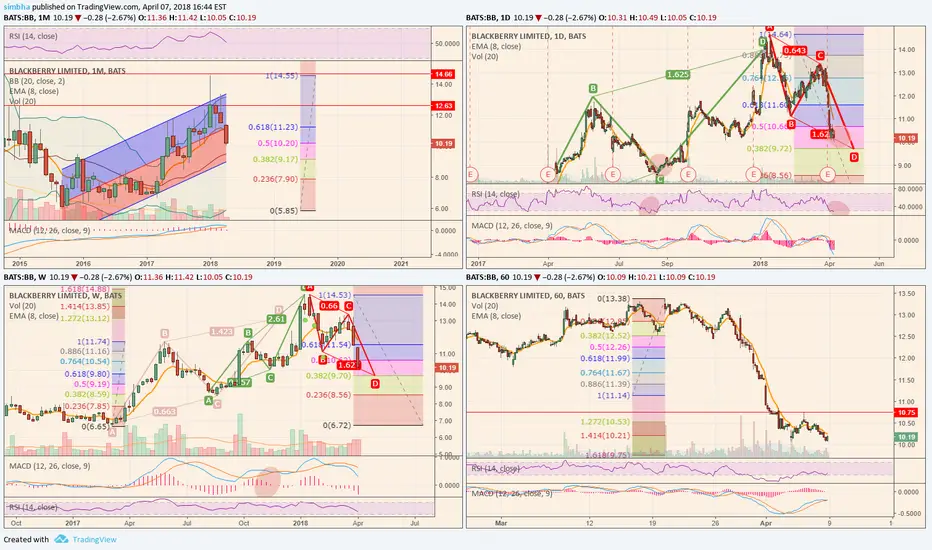
BlackberryTargets are in orange. Buy the thicc on volume gap. $11.50 rn is not a bad entry. unloading at first stop around $30. unload more at second orange box

Observing 10 / 100 period crossover on $BBLooks like a crossover of the lower-over-higher period moving average on $BB is afoot.

BB Summer GainsBB is turning things around, as usual earnings scared some investors off but they were better than expected so the gains that were lost, will be made again!

Blackberry_(NYSE:BB)_May_16_2018Since the demise of Nortel, Blackberry was the darling of the Canadian Tech Sector till about 2008. However, the rise of Apple combined with the Great Recession of 2008 caused the stock price of BB to drop from $130 to $40. Proliferation of touch screen phones running on Google's Android platform since then further contributed to
the stock's decline.
The stock was trading around the $9-10 range in 2016-2017. However there has been some recent interest in the company owing to its expertise in developing corporate security products and how those same technologies could be leveraged for the Internet of Things (IOT) world.
Currently, the intermediate term trend is bullish; the short term trend is bearish. I think the chart pattern can be either classified as:
1) Descending Triangle
2) Symmetric Triangle
The burden of proof leads me to believe that a descending triangle is more appropriate. I think by the next earnings call (later this month) we will know which way BB will break out.
If the breakout is towards the positive side, I see the stock price trading in the $14 price range. If the breakout is negative, I see support around $10.25. Based on the last few earnings report, my guess will be that the stock will make a breakout in a bullish manner. however, I will wait a few more days to confirm the trend before buying in.
Happy Trading!!!


$BB Trying to trend a little bullish?$BB continues to wind up against this $10.84 level, which I cannot much understand exactly why. A very interesting looking 1H chart, and this 4H chart with this pennant forming. What do you think?

Holding 50% retracements and possible further upside cycles. AI and the driverless car will get more traction in next generation cars.
Manufacturers will embed this AI(QNIX) into cars and ready to use and make it available for consumers. In fact, many cars have those Adaptive Cruise controls type of features. It means BlackBerry customer base and revenues should be incremental. Next generation applications should accelerate with 5G availability soon in 2019~2020.
MACD weekly indicator got reset nicely.
Good Luck !


BlackBerry- Daily Gann Fan Indicator Says Buy NowIf you are interested in buying stock and/or call bull credit spreads, this is time. Right away earnings and price action is a a major support of $13. Enjoy.


BLACKBERRY COULD GO LOWER GUYS!!Massive sell off on blackberry down to current lows.
I believe that this stock could gradually reach lows of 8.50.
Having said that, a reversal up to highs of 13.50 could potentially occur.
Let's Just Wait AND SEE!


BB double top despite earnings surpriseProof that the market can be better predicted with technical analysis. Despite beating earnings estimates during the quarter the price action is tanking after forming a double top.
Short on this for now but defenetly looking for a buying opportunity long term


Clear accumulationLook at volume. Clear uptrend established. $BB is a leader in security, gem of Canadian tech, and potential buyout option for larger tech. Severely undervalued.

Blackberry consolidating after revivalBB Has long been underground after failing to capture the hardware market. After switching their focus to software and being a contending in the driver less car market, they have made a huge comeback.
It ran into quite some Resistance at $15.7 cad (canadian chart, US is similar, simply extrapolate) and broke through with great force and is now consolidating onto old resistance turned support from a falling wedge pattern.
Defensively keeping an eye on this one, id potentially be a buyer at $15.7 levels. Look for signs of long term continuation of this bullish trend that the US stock market has been following.

