TSLA LONGAccumulating tesla shares - $300 is a very interesting area for TSLA, Looks like as long as we hold this area we should see $500 by end of year... much sooner.
0R0X trade ideas

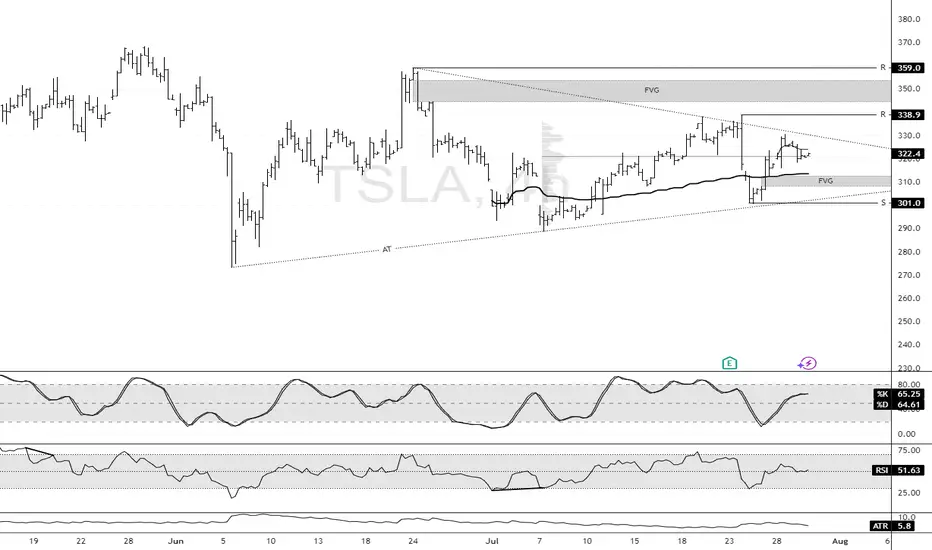
Tesla Builds Toward Fair Value GapFenzoFx—Tesla (#TSLA) bounced from the ascending trendline and closed yesterday's session at the volume point of interest, the $322.3 mark. This level is above the monthly VWAP, meaning bulls are gaining, and bears are losing money.
That said, we expect the uptick in momentum to resume, targeting $338.9, and if this level is breached, the stock will likely aim to fill the Fair Value Gap at $350.0.
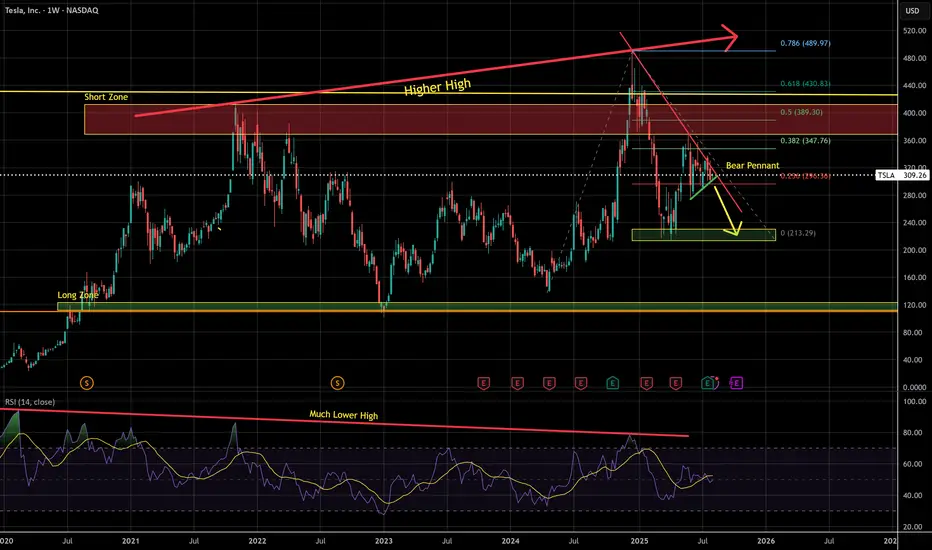
Bearish Pennant & Long Term Bearish DivergenceBearish pennant formed and sharp bearish divergence on the RSI, Elon personally receiving billions from the pockets of the company. This alludes to possible instability on the inside, despite being up a significant amount this year. Companies are like icebergs, cracks on the surface run deep, negative information is repressed.
In my opinion, a drawdown of over 25% seems in order
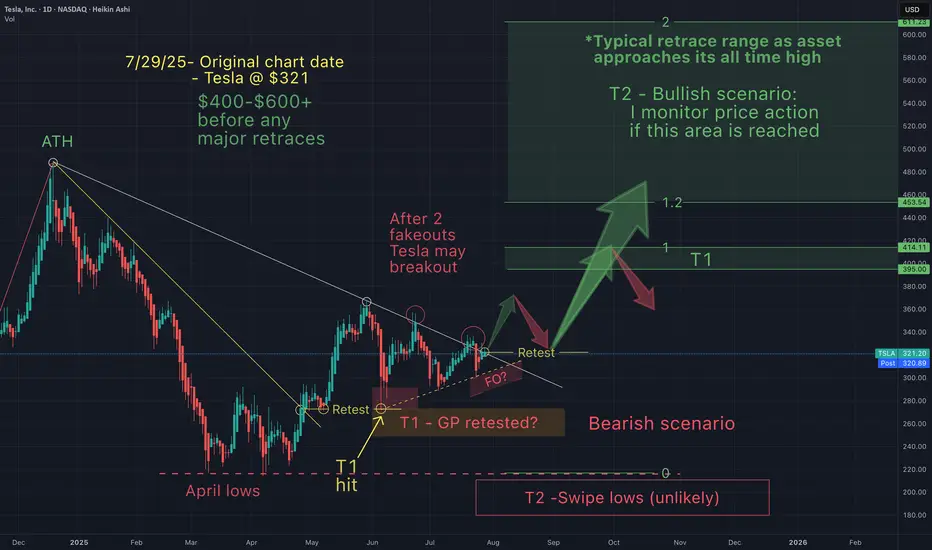
TSLA Honey Ticking Bull Trap! UPDATE 1This is an updated chart, as I keep being prompted to reach "My Target" by TV.
No matter how bad things get for Elona and TSLA, there are always people who are willing to pile in and buy at any price. The problem is the chart is showing lower highs, as TSLA no longer attracts the people needed to boost price, just like TSLA the brand. As a result, people keep getting honey ticked.
Don't Get HONEY TICKED!
As I always say, never EVER!! Invest in toxic people like Elona. They always blow themselves up in the end. It's in their nature!
Click Boost, Follow, subscribe, and let's reach 5,000 followers. ;)

Tesla - A story of an underdogSeveral of the Mag 7 are getting over heated, so I like to look at the ones that haven't caught up.
Since I don't have a crystal ball, I must consider the bearish and bullish scenarios.
As an investor I must pivot accordingly as one of these scenarios gets invalidated.
So on my charts you'll always see both scenarios. Today I'm leaning towards the bull.
Tesla just needs a narrative shift (ie -new invention etc), & price action changes in a heart beat.
Yet, price action really has less to do with the news making Elon a hero, then a villain and then back and forth...but moreso to do with price action patterns that just keep repeating.
So if we don't get a dead cat bounce, I believe Tesla could eventually head towards it's ATH, if this bull market continues.
WXY structure with a double topTesla has been in a uptrend with a corrective structure WXY. I am not sure if the WXY is a part of wave 5 terminal structure or a B wave. However expecting a double top or 78.6 retrace to 425-430 range as a minimum. For this scenario, an impulsive upside move is expected within the next few weeks. However the price needs to move back into the channel next week as a first step.

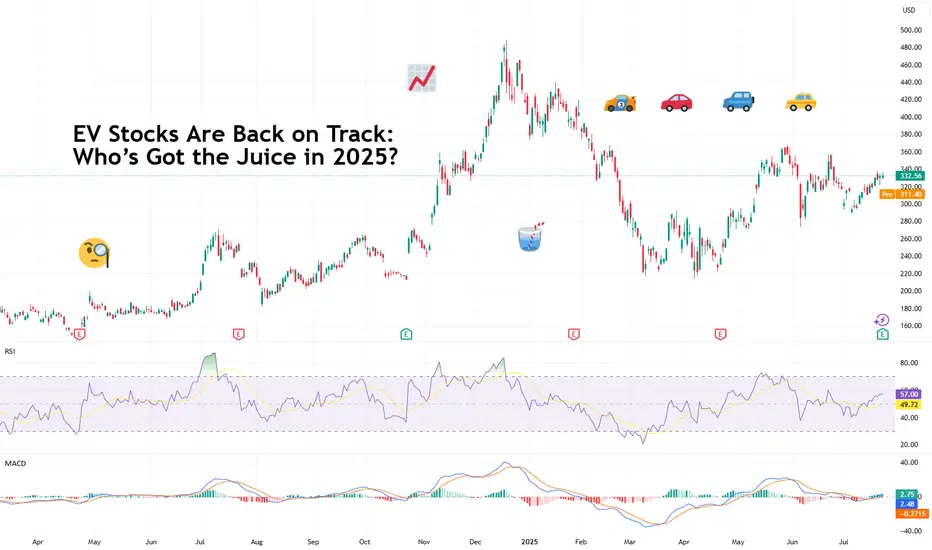
EV Stocks Are Back on Track: Who’s Got the Juice in 2025?This year is big for the EV sector so we figured let’s do a piece on it and bring you up to speed on who’s making moves and getting traction — both in the charts and on the road.
What we’ve got here is a lean, mean lineup of real contenders. Let’s go for a ride.
🚗 Tesla: Still King of the Road (for Now)
Tesla NASDAQ:TSLA isn’t just an EV company. It’s a tech firm, an AI shop, a robotaxi rollout machine, and an Elon-flavored media event every quarter. Even so, when it comes to margins, global volume, and name recognition, Tesla is still the benchmark everyone else is chasing.
In 2025, Tesla’s bounceback is fueled not just by EV hype but by its push into autonomous driving and different plays into the AI space.
The stock is down about 13% year-to-date. But investors love a narrative turnaround. Apparently, the earnings update didn't help the situation as shares slipped roughly 5%. Well, there's always another quarter — make sure to keep an eye on the Earnings Calendar .
🐉 BYD: The Dragon in the Fast Lane
BYD 1211 is calmly racking up sales, expanding across continents, and stealing global market share without breaking a sweat. The Chinese behemoth is outselling Tesla globally and doing it with less drama and more charge… literally .
Vertical integration is BYD’s secret weapon — they make their own batteries, chips, and even semiconductors. The West might not be in love with BYD’s designs, but fleet operators and emerging-market governments are. And that’s where the real growth is.
⛰️ Rivian: Built for Trails, Not Earnings (Yet)
Rivian NASDAQ:RIVN still feels like the Patagonia of EV makers — rugged, outdoorsy, aspirational. Its R1T pickup truck has cult status, but the company had to tone down its ambitions and revised its guidance for 2025 deliveries to between 40,000 and 46,000. Early 2025 projections floated around 50,000 .
The good news? Rivian is improving on cost control, production pace, and market fit. The bad news? It’s still burning cash faster than it builds trucks. But for investors betting on a post-rate-cut growth stock rally, Rivian may be the comeback kid to watch. It just needs a few solid quarters.
🛋️ Lucid: Luxury Dreams, Reality Checks
Lucid NASDAQ:LCID , the one that’ll either go under or make it big. The luxury carmaker, worth about $8 billion, came into the EV game promising to out-Tesla Tesla — with longer range, more appeal, and a price tag to match.
But here’s the rub: rich people aren’t lining up for boutique sedans, especially when Mercedes and BMW now offer their own electric gliders with badge power and a dealer network.
Lucid’s challenge in 2025 is existential. The cars are sleek, the tech is strong, but the cash runway is shrinking and demand isn’t scaling like the pitch deck promised.
Unless it nails a strategic partnership (Saudi backing only goes so far), Lucid could end up as a cautionary tale — a beautifully engineered one, but a cautionary tale nonetheless. Thankfully, Uber NYSE:UBER showed up to the rescue ?
💪 NIO : Battling to Stay in the Race
Remember when NIO NYSE:NIO was dubbed the “Tesla of China”? Fast forward, and it’s still swinging — but now the narrative is more about survival than supremacy. NIO's battery-swap stations remain a unique selling point, but delivery volumes and profitability are still trailing.
The company’s leaning into smart-tech partnerships and next-gen vehicle platforms. The stock, meanwhile, needs more than just optimism to get moving again — it’s virtually flat on the year.
✈️ XPeng: Flying Cars, Literally
XPeng’s NYSE:XPEV claim to fame used to be its semi-autonomous driving suite. Now? It's working on literal flying vehicles with its Land Aircraft Carrier. Innovation isn’t the problem — it's execution and scale.
XPeng is beloved by futurists and punished by spreadsheets. It’s still getting government love, but without a clear margin path, the stock might stay grounded.
🏁 Li Auto: The Surprise Front-Runner
Li Auto NASDAQ:LI doesn’t get the headlines, but it’s quietly killing it with its range-extended EVs — hybrids that let you plug in or gas up. A smart move in a country still building out its charging infrastructure.
Li is delivering big numbers, posting improving margins, and seems laser-focused on practicality over hype. Of all the Chinese EV stocks, this one might be the most mature.
🧠 Nvidia: The Brains of the Operation
Okay, not an EV stock per se, but Nvidia NASDAQ:NVDA deserves a spot on any EV watchlist. Its AI chips are running the show inside Tesla’s Full Self-Driving computers, powering sensor fusion in dozens of autonomous pilot programs, and quietly taking over the brains of modern mobility.
As self-driving becomes less sci-fi and more of a supply-chain item, Nvidia's value-add grows with every mile driven by data-hungry EVs.
🔋 ChargePoint & EVgo: Picks and Shovels
If you can’t sell the cars, sell the cables.
EV charging companies were once seen as the “safe bet” on electrification. Now they’re just seen as massively underperforming.
ChargePoint BOATS:CHPT : Still the leader in US charging stations but struggling with profitability and adoption pacing. Stock’s down bad from its peak in 2021 (like, 98% bad).
EVgo NASDAQ:EVGO : Focused on fast-charging and partnerships (hello, GM), but scale and margin pressures remain.
Both stocks are beaten down hard. But with billions in infrastructure funding still flowing, who knows, maybe there’s potential for a second act.
👉 Off to you : are you plugged into any of these EV plays? Share your EV investment picks in the comments!
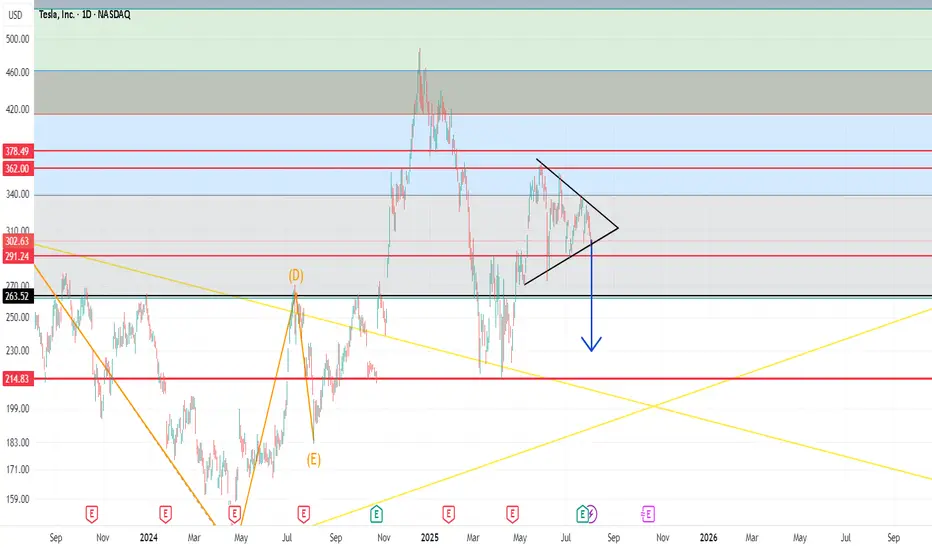
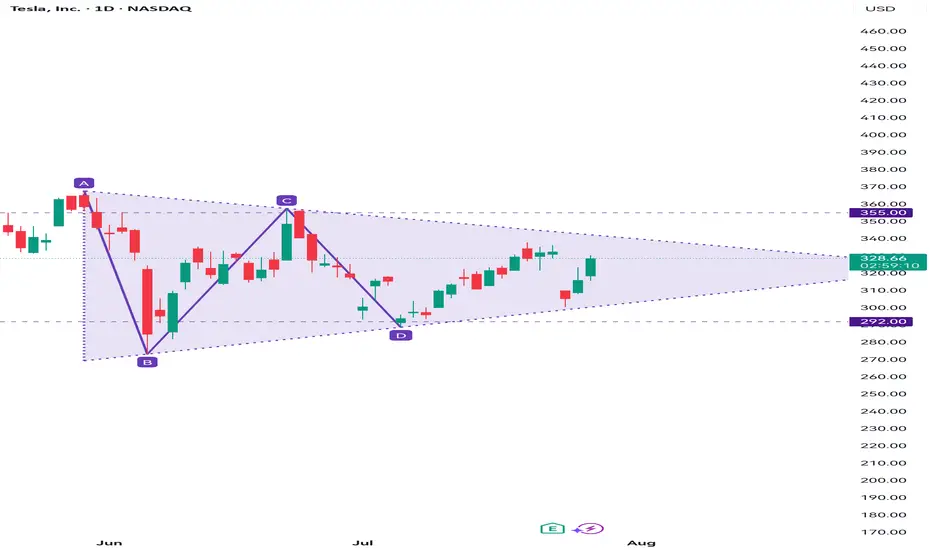
Bearish Triangle: TSLAWaiting for TSLA to breakout 292 to form a bearish triangle pattern.
Target price: 22X
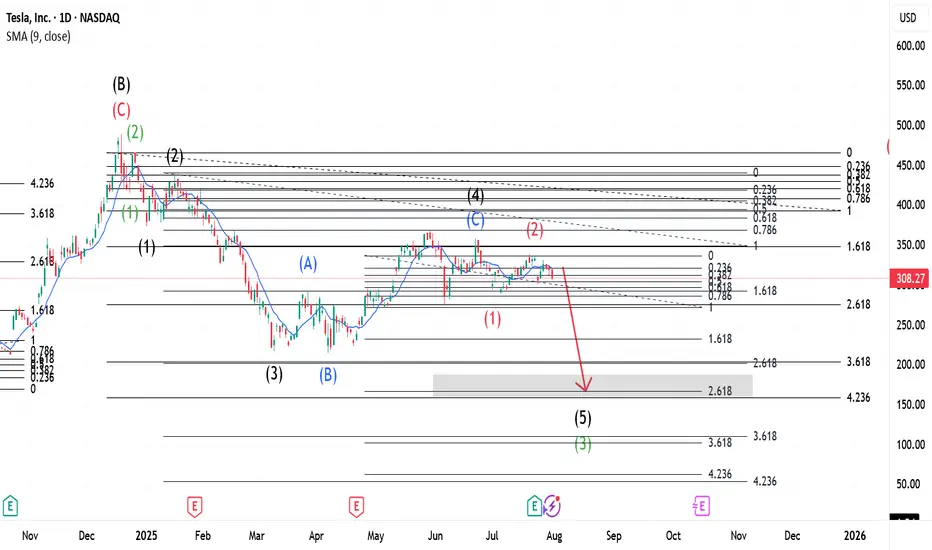
$TSLA ~ Elliott Wave Updates.This whole wave is Wave C(Black) that started when Wave B(Black) was completed. This Wave C(Black) expresses itself in 5 main waves shown in Green. Wave 2(Green) was a Zigzag and a Flat should be expected for 4(Green). Meanwhile, Wave 3(Green) expresses itself in a 5 wave move shown in Black- with Wave 2(Black) being a Zigzag, our 4 was a Flat. This Flat is shown as Blue ABC. When Wave 4(Black) completed, our Wave 5 began which upon completion, would be Wave 3(Green) of the main wave. Wave 2(Red) is a Flat and a Zigzag should be expected after 3(Red).
Go to for more information of the same.
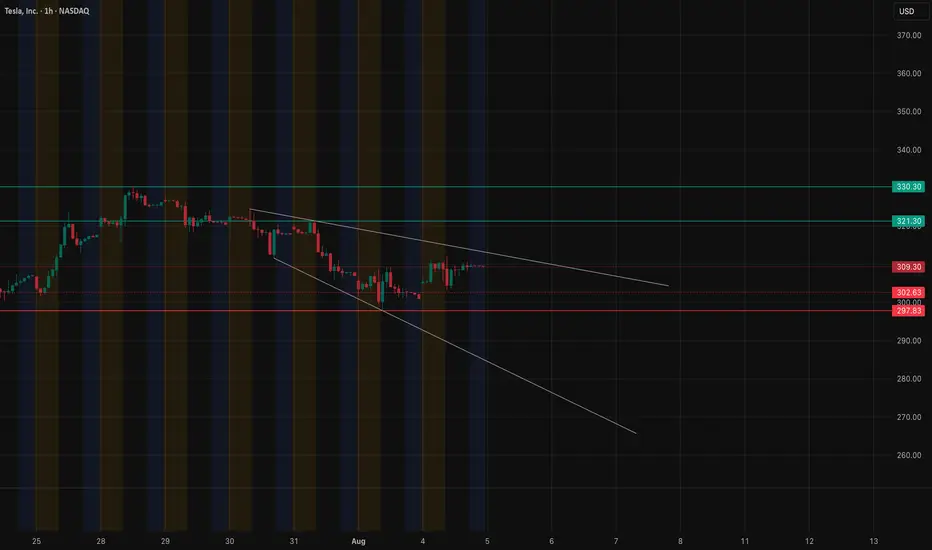
TSLA Attempting Breakout – Watching $312 Key Level. Aug. 5TSLA Attempting Breakout – Watching $312 Key Level 🚀
Technical Overview (1H)
TSLA is consolidating just below the critical $312 resistance, aligning with the Highest Positive GEX and 2nd Call Wall (57.55%). A breakout above this level could trigger a gamma squeeze toward $317.5 and potentially $325.
Support sits at $300 (Major Put Support -58.42%). If this fails, bears could push toward $295 and $290. Price is currently forming a falling wedge, a bullish reversal pattern if confirmed.
GEX & Options Flow Insights
* Highest Positive GEX: $312 – Strong resistance; breaking above can fuel upside momentum.
* Major Call Walls: $317.5, $325 – Profit-taking zones for bulls.
* Major Put Support: $300 – Bears will defend here; losing it invites heavier selling.
* Call/Put Positioning: CALLs 31.3% vs Puts – Skew still leans slightly bullish, but gamma flip is near $300.
My Thoughts
TSLA is coiling for a potential move. As long as price holds above $300, the risk/reward still favors a bullish breakout play. However, failure to clear $312 could see a pullback into $305–$300 range before another attempt.
Trade Ideas
Bullish Scenario:
* Entry: On a breakout above $312 with strong volume
* Targets: $317.5 → $325
* Stop-Loss: Below $305
Bearish Scenario:
* Entry: Rejection at $312 and loss of $305
* Targets: $300 → $295
* Stop-Loss: Above $315
15-Minute Short-Term Setup
* Intraday traders should watch for a mini breakout retest above $310 for scalps to $312+.
* If $307 fails intraday, momentum could stall toward $304–$302.
Disclaimer: This analysis is for educational purposes only and does not constitute financial advice. Always do your own research and manage your risk before trading.
TESLA Lagging BehindA compelling reason to buy Tesla stock now—despite it being beaten down—is the asymmetric risk-reward setup driven by its depressed valuation relative to long-term growth potential. Sentiment is currently low due to concerns about EV demand, competition, and Elon’s distractions, but this pessimism is largely priced in. Meanwhile, Tesla still holds massive optionality: AI-driven autonomy, energy storage, and Dojo supercomputing. If even one of these verticals scales meaningfully, current prices may prove a generational entry.
At the moment, we are hitting some of my key support levels being the anchored vwap from the low , as well as the previous Value Area High range retest within the formation of this broader triangle, suggesting a potential continuation to the upside should we get a strong breakout.
I will be watching for further down side as the current risk is only approx 6-7% for a potential upside of 60%-70% , a massive Risk to reward.
Should this reclaim the downtrend vwap, it can be a strong sign of strength for this stock to move back to ATH's as tesla is massively lagging behind.

Tesla High Risk of $255Tesla is Stuck under $430 ATH resistance and at high risk of falling back to $255 support.
Tesla is no longer growing and Musk is polarizing and alienating their mostly progressive leaning customer base. This stock simply makes zero sense for a 200 pe ratio.

TSLA Weekly Bearish Play — August 2, 2025
🔻 **TSLA Weekly Bearish Play — August 2, 2025** 🔻
🚨 **Multi-Model Consensus Signals a Tactical Put Opportunity**
### 🔍 Market Snapshot:
* **Daily RSI:** 39.9 (Bearish)
* **Weekly RSI:** 53.2 → Falling
* **Volume:** Weak (0.8x last week)
* **Options Flow:** Neutral (C/P Ratio \~1.04)
* **VIX:** 20.38 → Favorable for Options Plays
* **Institutional Support:** Weak
---
### 🔮 Model Consensus:
📉 **All major models (xAI, Google, Claude, Meta, DeepSeek)** confirm:
* Bearish momentum on both daily + weekly RSI
* Weak volume = cautious institutional behavior
* Volatility setup perfect for short-dated puts
---
### 🎯 Viral Trade Setup:
**💥 Trade Type:** PUT (Short TSLA)
**🔻 Strike:** \$300
**📆 Expiry:** 2025-08-08
**💰 Entry Price:** \$6.65
**🎯 Target Exit:** \$10.64 – \$13.30 (60%-100% gain)
**🛑 Stop Loss:** \$3.99
**📊 Confidence:** 65%
**📍 Entry Timing:** Monday open
**🕒 Signal Timestamp:** 2025-08-03 01:33:56 EDT
---
### ⚠️ Key Levels:
* Support to watch: **\$297.82**
* News/event risks: Stay alert ⚡
* Use tight risk controls for weekly plays!
---
🔥 **If you trade TSLA — don’t sleep on this one.**
Bearish consensus + clean setup = **high-probability weekly play.**

TESLA: Bullish Continuation & Long Trade
TESLA
- Classic bullish setup
- Our team expects bullish continuation
SUGGESTED TRADE:
Swing Trade
Long TESLA
Entry Point - 302.63
Stop Loss - 296.98
Take Profit - 312.87
Our Risk - 1%
Start protection of your profits from lower levels
Disclosure: I am part of Trade Nation's Influencer program and receive a monthly fee for using their TradingView charts in my analysis.
❤️ Please, support our work with like & comment! ❤️

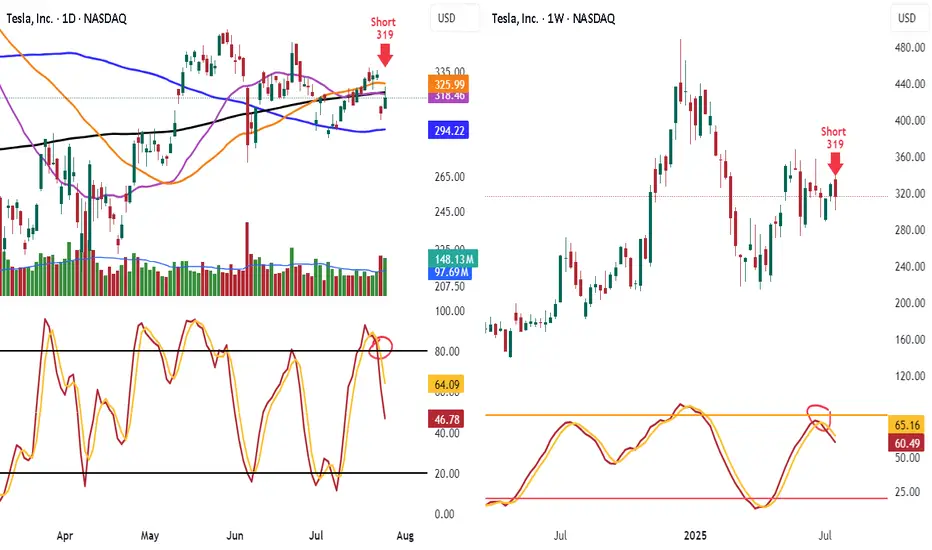
Shorted TSLA 319 Look at TSLA hit 50 day and 200 day MA and failed and know under them
Look at the lower highs and see the stoch heading down
Know lets look weekly stoch heading down and lower highs
Target is 100 day ma 294.22 take some off. When it breaks will add back on
Have trailing stop in place
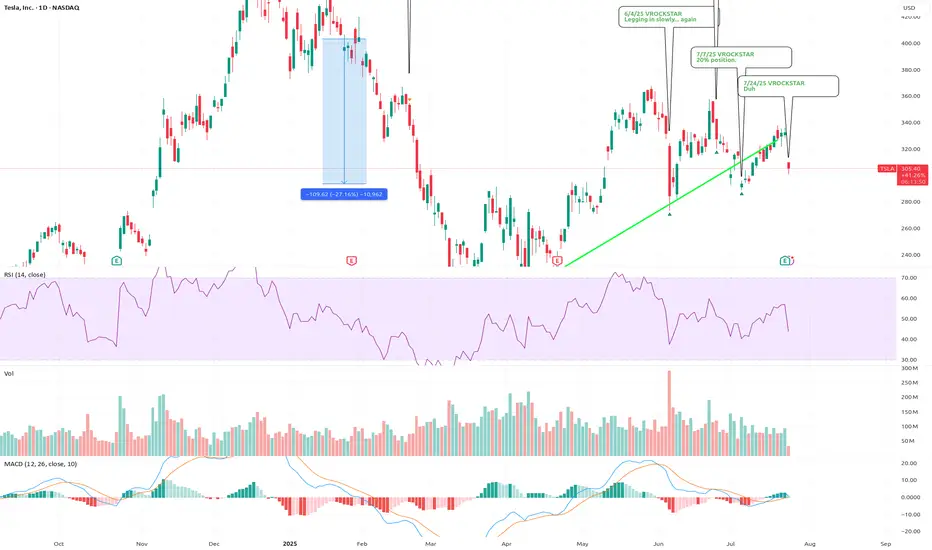
7/24/25 - $tsla - Duh 7/24/25 :: VROCKSTAR :: NASDAQ:TSLA
Duh
- ppl focused on ST FCF (all over X!) is 100% of the reason why when you put the pieces together, you realize that while ST this might not behave like anyone expects... LT, TSLA is v likely going to in, elon's own words, be the largest cap in the history of capital markets
- two leading robots with leadership position in IRL AI
- profitable, is all that matters
- have not yet hit the S-curve
was super lucky to trim some of this last week
now i'm back to sizing into a full position, not yet there like on that silly political dump, but i'm nearly 10% (20% is my max size).
V
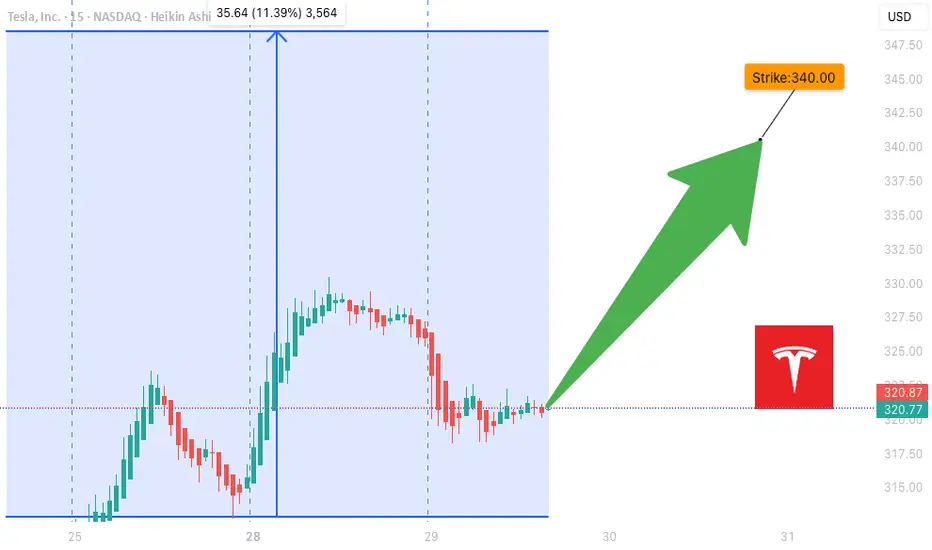
SLA Moderate Bullish Setup – Weekly Play for 08/01 Expiry
## ⚡ TSLA Moderate Bullish Setup – Weekly Play for 08/01 Expiry
🎯 *"Volume confirms it. RSI supports it. Time to strike—or stand by."*
---
### 🔍 Market Intelligence Snapshot:
📊 **Consensus**: Moderately Bullish
📈 **Weekly RSI**: Rising
📉 **Daily RSI**: Still Neutral (momentum building)
📉 **VIX**: Low → Great environment for call buying
📦 **Volume**: Strong institutional activity across models
---
### ✅ Recommended Trade Setup:
**TSLA \$340 CALL (Exp: Aug 1)**
💰 *Entry*: \~\$0.88
📈 *Target*: \$1.38
🛑 *Stop*: \$0.35
📆 *DTE*: 3 Days
🎯 *Entry*: Market Open
⚖️ *Confidence*: 65%
---
### 🔧 Model Blended Strategy Notes:
* Meta & Anthropic: Suggest ATM/ITM (\$327.50–\$330) → safer, higher cost
* Google & xAI: Prefer \$340–\$342.50 for a better risk/reward
* DeepSeek: Targets \$320 but with heavier premium
🧠 *Takeaway*: \$340 offers a balanced shot — affordable, but still responsive to upside flow.
---
### ⚠️ Risk Notes:
* ⏳ Time Decay → Quick exits = better outcomes
* 📰 External news or earnings reactions = watch for sudden volatility
* 🎯 Position size = keep light due to only 3 DTE
---
### 📊 TRADE SNAPSHOT (JSON):
```json
{
"instrument": "TSLA",
"direction": "call",
"strike": 340.0,
"expiry": "2025-08-01",
"confidence": 0.65,
"profit_target": 1.38,
"stop_loss": 0.35,
"size": 1,
"entry_price": 0.88,
"entry_timing": "open",
"signal_publish_time": "2025-07-29 10:16:14 UTC-04:00"
}
```
---
### 🧠 Quick Captions for Social:
* “TSLA bulls waking up? \$340C looks lit for the week 📈🔥”
* “Call volume surging. RSI rising. Low VIX. This \ NASDAQ:TSLA 340C might run 💥”
* “Risk-managed breakout shot — in and out fast 🎯”
TSLA: 308.27Bullish Entries: 312.00/318.00 Stop 316.00 / Target 322.00–325.00
Bearish Entries: 304.00/300.00 Stop 302.00 / Target 296.00–292.00. Note: If the open starts above 312.00, we should wait for it to touch 318.00. Then, 320.00 is the entry for the previous day's bearish trend reversal and the new uptrend.

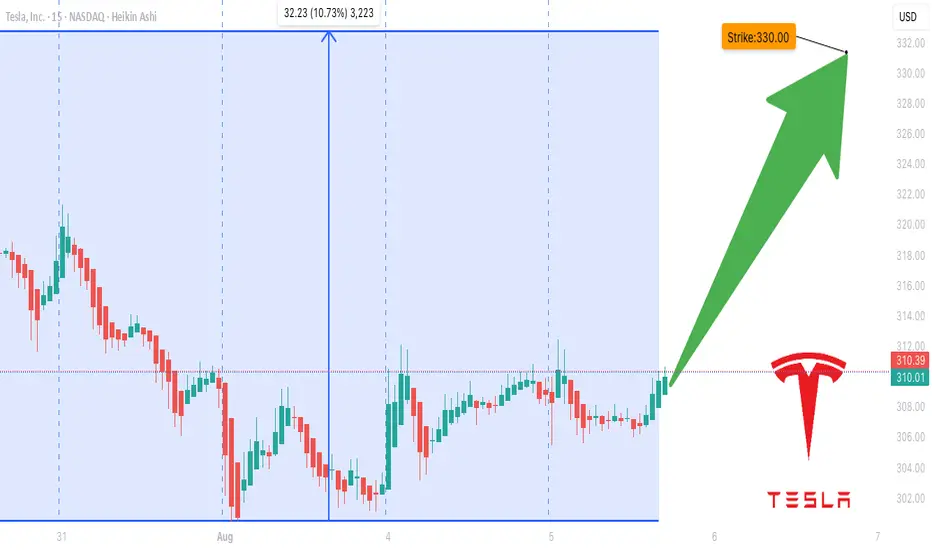
TSLA Don't Miss Out
### 🔥 TradingView Viral Post Format 🔥
---
### 📢 **Title:**
**TSLA Options Surge? \$330 Call Could Double in 3 Days — Here's the Setup** 🚀📈
---
### 📝 **Description:**
Tesla’s options market is flashing **moderate bullish signals** this week! 📊
✔️ Call/Put Ratio: **1.39** (Bullish)
✔️ RSI (Daily & Weekly): **Rising**
⚠️ Volume is light, but sentiment leans bullish.
🎯 **Trade Idea:**
Buy TSLA \$330 Call (Exp: Aug 8)
💰 Entry: \$0.85
🎯 Target: \$1.70
🛑 Stop: \$0.43
⏱️ Confidence: 65%
⚡ Gamma risk rising with time decay — tight execution is key.
Is this the breakout or a bull trap? Let’s watch it play out 👀
👇 Drop your thoughts or setups in the comments!
---
### 🏷️ **Tags (for TradingView):**
```
#TSLA #Tesla #OptionsTrading #CallOptions #BullishSetup #TSLAOptions #StockMarket #WeeklySetup #TradingStrategy #TechnicalAnalysis #TradeIdea #MomentumTrade #UnusualOptionsActivity #TradingView
TSL PatienceTSL Fractal. Another several months of accumulation until December 2027 Chop then Parabolic. Chop Chop Chop. Dollar Raising Risk Off. Bitcoin Topping. Dollar Bottoming.

Sitting Right on the 200-Day EMATSLA is sitting right on the 200-Day EMA here while holding this wedge for quite some time. TSLA's Bollinger Bands are starting to squeeze, indicating a significant move is forthcoming, and moving averages (MA 5/10/30/60) are flattening, indicating a loss of bullish momentum. It will be interesting to watch from here.

A Strategic Long Opportunity Amid VolatilityCurrent Price: $316.06
Direction: LONG
Targets:
- T1 = $324.00
- T2 = $328.50
Stop Levels:
- S1 = $312.50
- S2 = $308.00
**Wisdom of Professional Traders:**
This analysis synthesizes insights from thousands of professional traders and market experts, leveraging collective intelligence to identify high-probability trade setups. The wisdom of crowds principle suggests that aggregated market perspectives from experienced professionals often outperform individual forecasts, reducing cognitive biases and highlighting consensus opportunities in Tesla.
**Key Insights:**
Tesla’s stock presents both short-term risks and long-term upside opportunities. Despite recent earnings misses and margin compression, its pivot into AI and robotics offers significant growth opportunities. Upside resistance zones near $325-$330 create favorable price targets, while support levels at $307-$310 suggest strong buying interest. This environment could favor a long trading strategy, provided disciplined risk management is maintained.
**Recent Performance:**
Tesla recently experienced notable sell-offs following disappointing earnings, attributed to compressed margins and weaker EV demand. However, the stock rebounded 3.5% from last week’s lows, signaling resilience amid uncertainty. Year-to-date, Tesla remains one of the top-performing stocks with a 54% price increase, reflecting strong underlying investor confidence in its long-term story.
**Expert Analysis:**
Market experts are divided on Tesla’s trajectory. Near-term fundamentals appear challenging with declining revenue (-12% YoY) and price cuts impacting profitability. However, bullish projections from analysts such as Kathy Wood highlight Tesla’s potential for disruptive innovation in AI and robotics. Its ambitious initiatives like robo-taxi deployment add speculative appeal but also introduce scaling and regulatory risks.
**News Impact:**
Tesla’s upcoming robo-taxi launch in San Francisco is poised to impact market sentiment significantly. While safety drivers will be required during the initial rollout, scalability and regulatory challenges could limit the project’s immediate impact. Meanwhile, recent disappointing earnings results may weigh on sentiment in the short term while providing an opportunity for potential retrishments off support levels.
**Trading Recommendation:**
Given the current setup, Tesla appears poised for long-term growth, with upside resistance levels suggesting a viable rally opportunity. Investors should consider taking a bullish position while maintaining stops near key support zones to mitigate downside risks. This balanced approach aligns well with Tesla’s speculative appeal and broader investor sentiment.
