Tesla in the waiting room as revenue slidesTesla is a global innovator that is changing the world. As a general rule, many investors have a saying: Never bet against Elon. They're not wrong. Elon delivers. But the short term is messy.
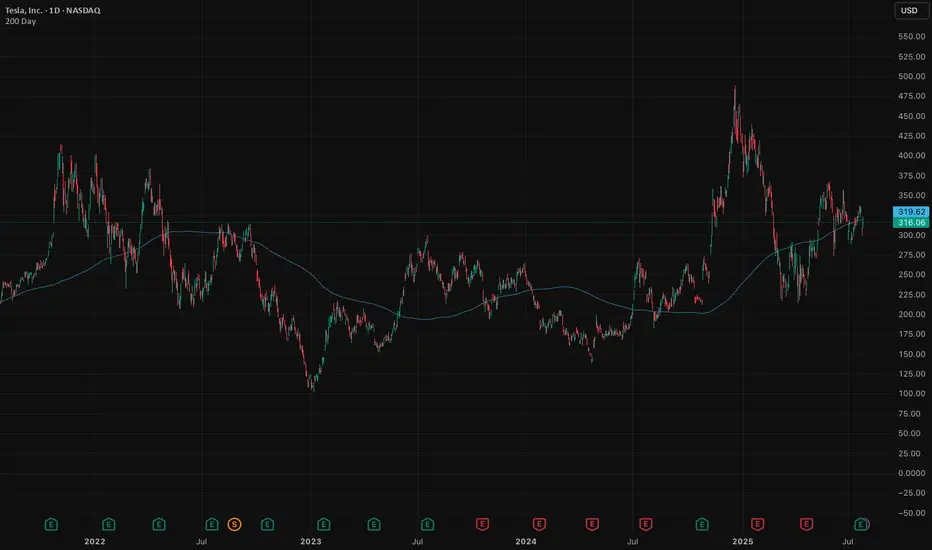
The stock is hovering around its 200-day moving average, a critical test. Break lower and we could see $290, maybe $260. That’s not panic, it's just price catching up to reality.
The auto business is deep in a downcycle. Q2 deliveries fell 14%, with revenue down 12%. Profits squeezed. Classic cyclical move. Nothing new here. But it’s weighing on momentum.
The upside isn’t about cars, it's autonomy, robotaxis, AI (Grok in cars). That’s where Tesla becomes a $2 trillion company. Musk knows it and is building for the future (100,000 GPU super cluster). He’s already shifting the story.
But that future is 6–12 months out, maybe longer.
In the meantime, we sit in the waiting room. Auto volumes need to stabilise. Robotaxi needs scale. Optimus requires proof and some definitive timeframes to get the market excited. That creates a 3–6 month narrative gap. Markets hate gaps.
Earnings last week were among the softest (though expected). EPS fell 23%. Free cash flow almost vanished. No real catalysts until next quarter. If the broader market sells off, which looks likely, Tesla takes more heat.
But let’s not lose the plot. Tesla is still Tesla. Long-term vision remains. Musk’s execution record is unmatched. Bet against him and you lose, eventually.
Short term, expect weakness. Patience required. If the stock breaks $315 with conviction, we’d expect further weakness before the real upside re-emerges.
Wait, watch, then pounce.
The forecasts provided herein are intended for informational purposes only and should not be construed as guarantees of future performance. This is an example only to enhance a consumer's understanding of the strategy being described above and is not to be taken as Blueberry Markets providing personal advice.
0R0X trade ideas
Two Trades to go Bullish on TSLAHello, I’m The Cafe Trader.
We’ve been tracking the MAG 7, and Tesla is the next focus for our short-term options or swing trade strategy.
I’m looking at two scenarios that are likely to play out with TSLA over the next few weeks.
For fundamental and long-term analysis, check my other article on TradingView.
⸻
Even though we’re sitting near the middle, bulls have just pushed into a bearish liquidity level (marked “Bottom of Supply”). We don’t know how much supply is left here, but the fact that bulls are pressing in suggests the bears are losing steam. This doesn’t mean price won’t pull back—it just means bearish follow-through may be weaker.
With that in mind, here are the two main scenarios:
⸻
1. Green Arrow — Bullish Test of Sellers
– Stock
If bulls keep the pressure on, we may see a test of the “Big Sellers” zone. The reaction there will tell us a lot.
If we see a sharp rejection (a quick tag followed by a flush) or a fake breakout that reverses, I’d approach longs more cautiously.
However, an aggressive entry long around the “Top of Demand” (around $321) could make sense, especially considering how buyers have been stepping in. This setup is primed to retest highs.
– Options
Pricing will be key here—especially post-earnings (EOD).
I’d look 2 weeks out. If you can snag a 335C for $5.00–$7.00, that’s solid.
Target profit would be into the Big Sellers zone. If we get a strong move before then that nets 3R–5R, I’d take it.
⸻
2. Red Arrow — Bearish Reaction + Big Buyer Support
– Stock
If earnings disappoint, we could see a shift in momentum. That said, big buyers should step in around $295.
This is actually the more likely scenario in my view.
From there, I’d look for a swing back up into the 330–350 range.
We’ll need to see how sellers handle the drop—are they aggressive, or is it just a lack of buyer interest?
Either way, this could align well with long-term buy zones.
– Options
On a flush to $295, I’d look for 3–5 day expiration calls around the 305 strike. @ a price between $1.50–$1.70 (look for 2-3R)
After the bounce, I’d expect a pause or retest of the uptrend line.
Then I’d look 2–3 weeks out for the 325C or 330C, ideally between $3.00–$5.00.
I’ll keep an eye on option pricing and update if we reach that level.
⸻
That’s all for short-term TSLA.
Follow for more charting and trade ideas.
📲 @thecafetrader

Unpack the Range, How to buy TeslaHello, I’m The Cafe Trader.
As part of our MAG 7 series, I’m going to show you how to find good pricing on TSLA for your long-term portfolio.
There’s a lot of hype surrounding Tesla right now — and for good reason. From a long-term investment standpoint, the future looks promising. But we still want to enter at the right price.
In my previous article, I gave TSLA a strong buy at $210–$220, and there were multiple opportunities in that range. But that was a few months ago. Let’s take a look at what the charts are telling us today.
⸻
🔲 In the Middle of a Big Range
With a range from $212 to $488, Tesla offers plenty of opportunity for traders — but for investors, it can stir up anxiety.
If you’re holding shares around $330+ and considering selling just to break even, here are three reasons you may want to reconsider:
⸻
1. 🚀 Future Prospects
Tesla is packed with upcoming catalysts:
• Grok AI release
• The highly anticipated Model Q
• Megapack energy storage scaling on an industrial level
These innovations, along with strong brand momentum, could drive the stock 2x, 3x, even 5x over the next few years.
⸻
2. 📈 Trending Up
While some may argue we’re forming a double top, a deeper look at the weekly or monthly chart shows no real signs of weakness. If you’re investing — not just trading — you need that longer-term perspective.
Tesla remains in an uptrend with healthy structure and plenty of strength in the larger timeframes.
⸻
3. 🛡️ Learn to Hedge Your Position
Even if we see 20–30% downside from supply zones, there are ways to protect yourself.
Hedging with options — such as buying puts — can reduce downside risk without selling your shares. If done correctly, you can turn a large drawdown into a smaller loss or even a profit on the hedge.
⚠️ Only do this if you understand how options pricing and time decay work.
⸻
🧠 Passive vs. Aggressive Sellers
Today (July 21st), TSLA tapped into a supply zone and rejected quickly — a sign that sellers are still active around $330, while buyers lack confidence to push through.
🔹 Passive Selling
These are quiet, standing orders — often from large sellers who don’t want to move the market. They sell gradually to avoid spooking buyers.
🔹 Aggressive Selling
This is intentional unloading — where sellers push to exit their position quickly, even at the cost of driving the stock down.
What we saw today looked like passive selling — I’ll cover this in more detail in my short-term TSLA article.
⸻
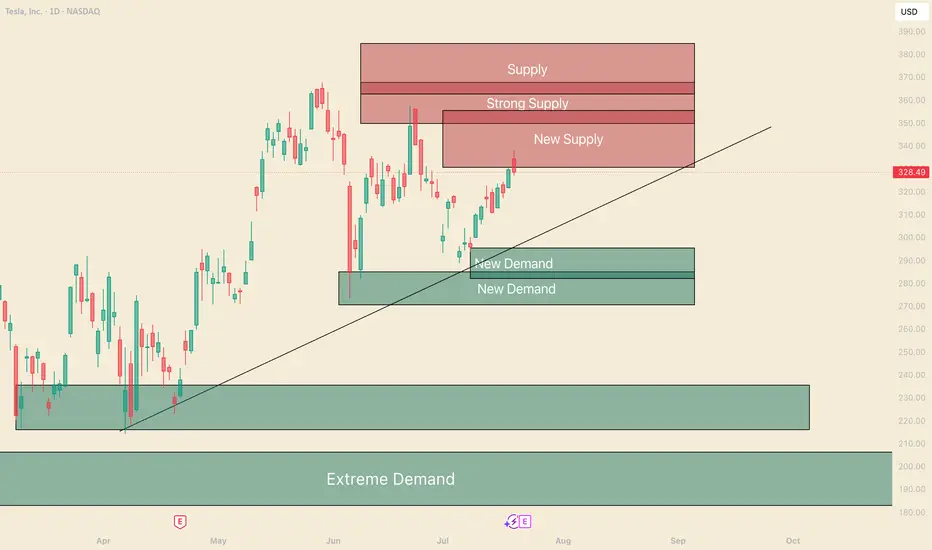
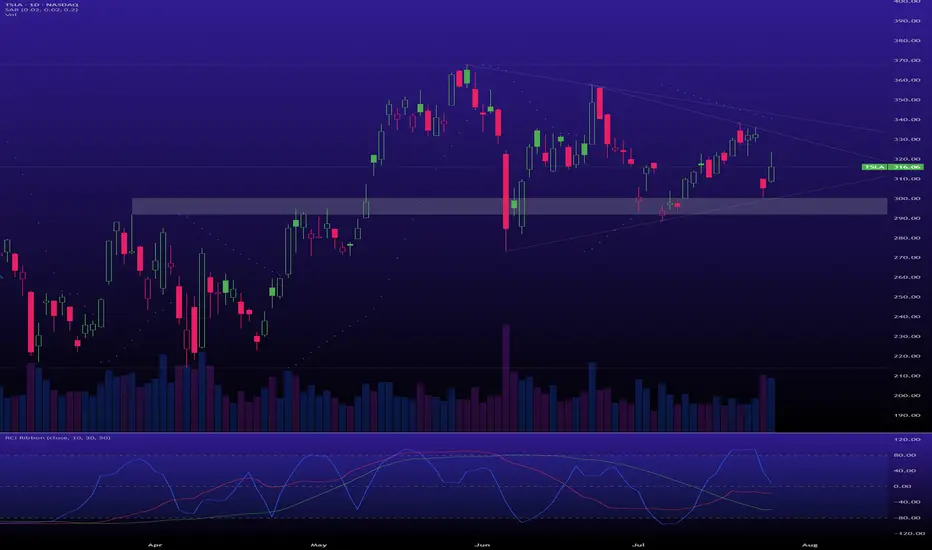
📊 My Buy Zones for TSLA
Fair Price: $296–$310
• $296 is the top of recent buying liquidity
• $310 is the bottom of the current uptrend
• This is where aggressive buyers may show up if sellers ease off
Good Price: $270–$284
• $284 is a strong support level where reinforced buyers have stepped in
• This has been a hot zone and a likely area for long entries to return
Steal Price: $220–$235
• Not marked on the chart, but this zone is high-demand territory
• Even with bad press or short-term issues, this would be a great long-term value buy
⸻
That's All for TSLA Long Term. Follow and stay tuned for a short term analysis.
@thecafetrader
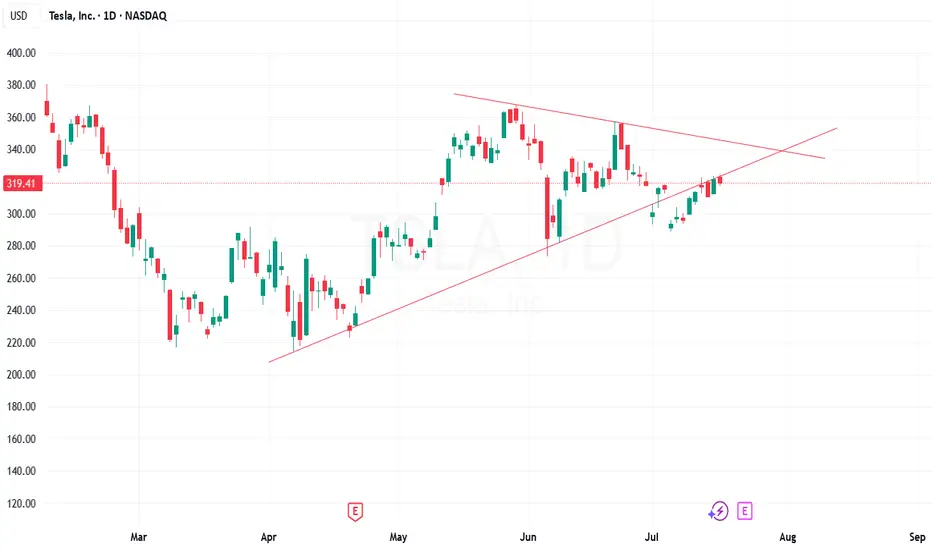
Expected to go in Bearish Mode - Keep watchDaily candle clearly says, retracement from the triangle breakout line completed. It showing as reversal.
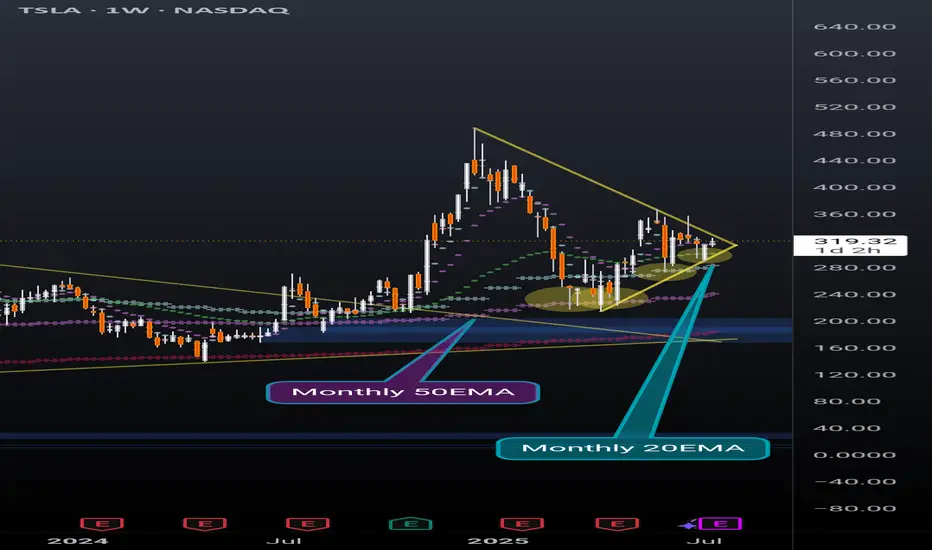
TSLA weekly coiling into something powerfulNever doubt the power of TSLA. Recently broke out of a huge pennant, and now nearing the end of another pennant while simultaneously holding support above the daily 20EMA(overlayed on this weekly chart).
Also recently found support off of the monthly 20EMA (overlayed on this weekly chart) and took 2 direct hits on the monthly 50EMA (overlayed on this weekly chart) before that and rallied up. It will take a lot to crush this setup but anything can happen. Possibly a longer pennant formation.
I'm just a cat not a financial advisor.
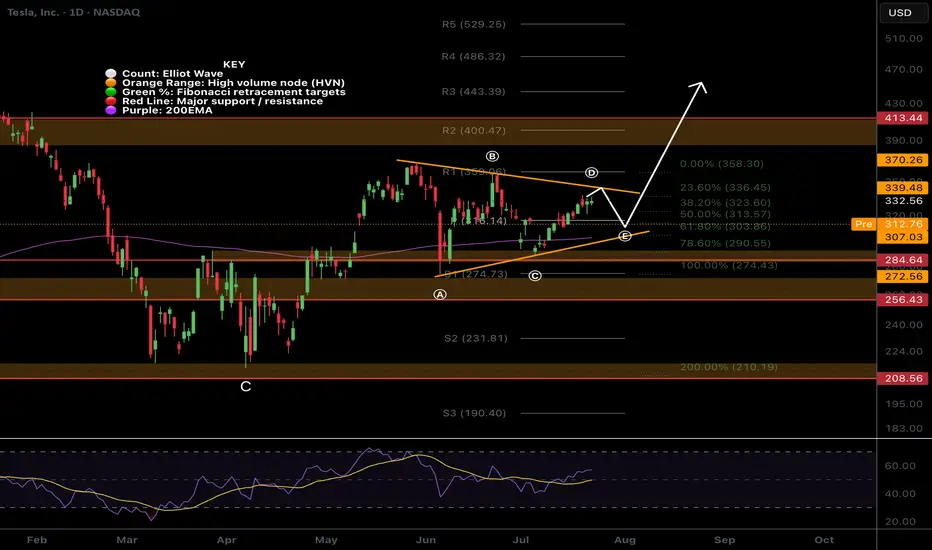
$TSLA Triangle?NASDAQ:TSLA triangle has presented itself with the recent price action. Triangle pattern target is $443 at the R3 daily pivot.
Wave e is expected to end at the daily pivot and wave d break is the signal to go long.
Analysis is invalidated below wave c.
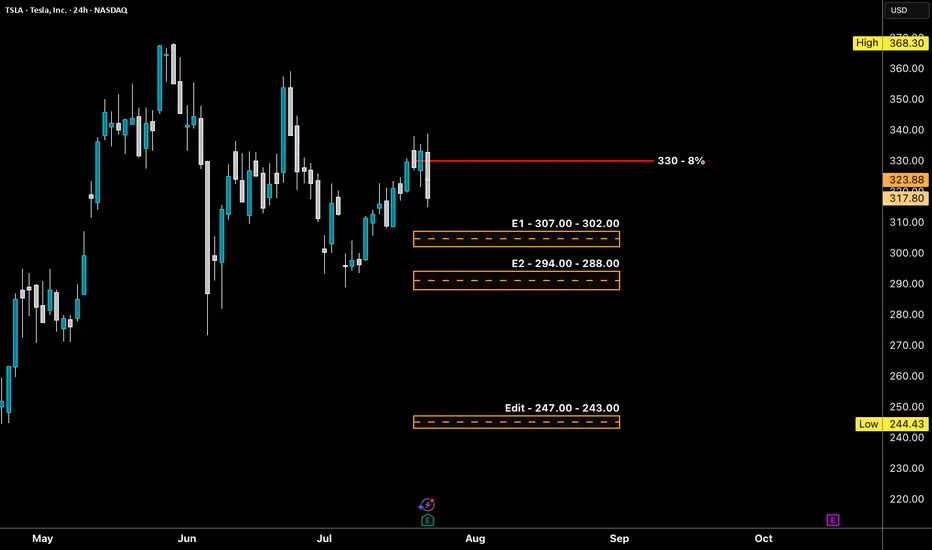
TSLA - LONG Swing Entry Plan NASDAQ:META - LONG Swing Entry Plan
Entry Zone 1: $307.00 – $302.00
→ Open initial position targeting +8% from entry level.
Entry Zone 2: $294.00 – $288.00
→ If price dips further, average down with a second equal-sized entry.
→ New target becomes +8% from the average of Entry 1 and Entry 2.
Edit Zone (Aggressive Demand): $247.00 – $243.00
→ If reached, enter with double the initial size to lower the overall cost basis.
→ Profit target remains +8% from the new average across all three entries.
Risk Management:
Stop Loss:
Risk is capped at 12% below the average entry price (calculated across all executed positions including the Edit Zone).
Position Sizing Approach:
Entry 1: 1x
Entry 2: 1x
Edit Zone: 2x
→ Total exposure: 4x
→ Weighted average determines final TP and SL calculations.
______________________________________
Legal Disclaimer
The information provided in this content is intended for educational and informational purposes only and does not constitute financial, investment, or legal advice or recommendations of any kind. The provider of this content assumes no legal or financial responsibility for any investment decisions made based on this information. Users are strongly advised to conduct their own due diligence and consult with licensed financial advisors before making any financial or investment decisions.
Sharia Compliance Disclaimer: The provider makes no guarantees that the stocks or financial instruments mentioned herein comply with Islamic (Sharia) principles. It is the user’s responsibility to verify Sharia compliance, and consultation with a qualified Sharia advisor is strongly recommended before making any investment decisions
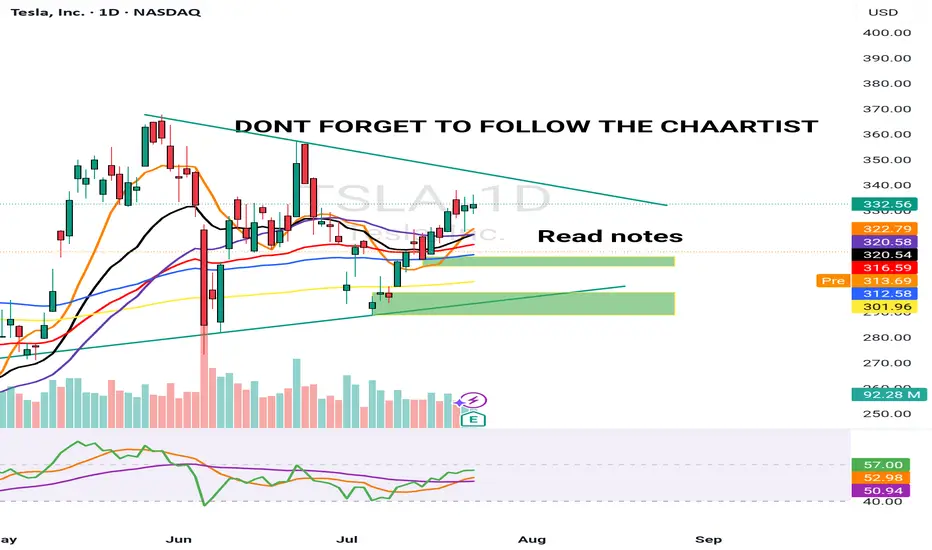
TESLA PRICE ACTION 22 JULY 2025This is the price action for Tesla. i have discussed indicators as well. Do not blindly trade without understanding the logics. I am long here with stocks & calls.
NOTE: DO NOT BLINDLY BUY

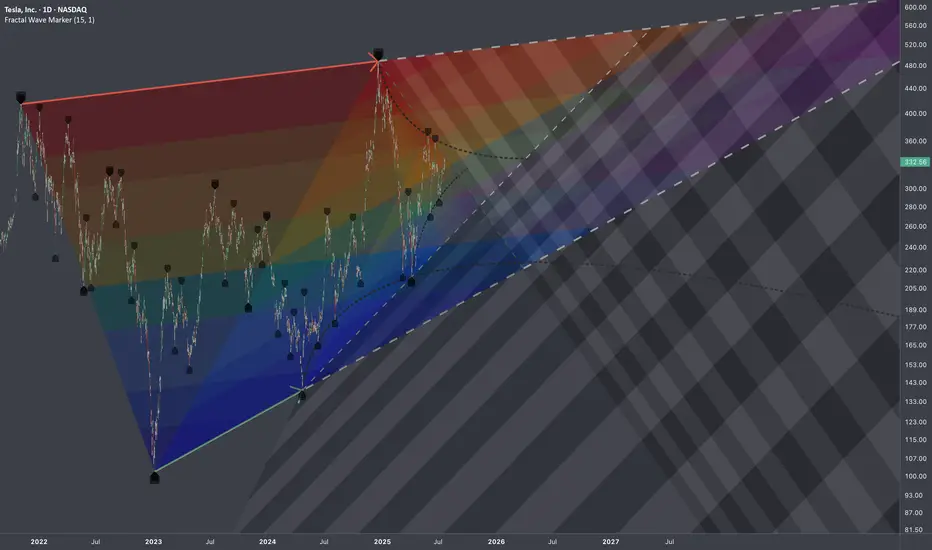
$TSLA: Multi-Scale DensityResearch Notes
Identified structural compressions happening within two periods:
This set has provided a perfect opportunity to study exponential fibs with growth rate starting from phi^1/4 applied to area of expression of squeeze.
Geometrically, gives a better sense of a continuity than regular fibs.
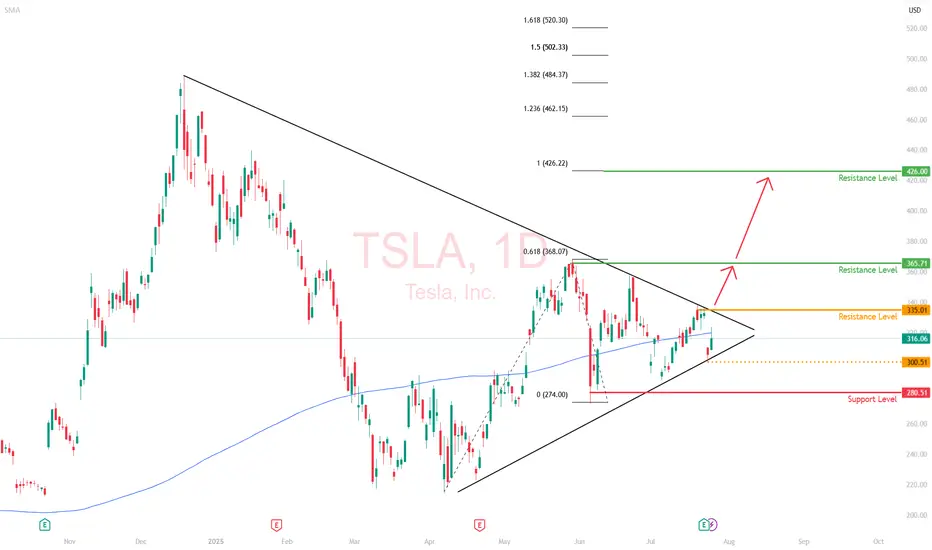
Tesla (TSLA) | Short-Term Compression, Long-Term ExTesla’s daily chart is coiled, with price currently trading at $316, sitting along the 200-day moving average. This looks like a consolidation phase with significant moves building up.
Price Action Snapshot
TSLA sold off last week, rejecting the $335 resistance level before finding footing around $300. The previous range of $280 and $365 is now tightening.
Immediate resistance sits at $335 with a clean breakout above that zone likely triggering momentum back toward the upper range of $365.
The recent drop does not seem like a capitulation move; it's likely institutional redistribution. Smart money is repositioning, not exiting.
Market Is Focused on the Wrong Data
Tesla’s Q2 earnings were objectively weak. Revenue fell 12%, deliveries dropped, and operating margins got clipped.
But this correction isn't all about fundamentals. It is about the market adjusting to a company evolving beyond traditional valuation models.
While most investors are trying to value Tesla like a car company, it’s spending this entire phase retooling itself into an AI and autonomy-first enterprise. That transition doesn't show up in EPS yet (but it will).
The Bigger Picture is Being Missed
The robotaxi rollout in Austin is live. Expansion into California, Phoenix, and Florida is on the roadmap.
Tesla is building a vertically integrated, owner-driven ride-hailing model that could eventually bypass both Uber and legacy OEMs entirely.
Optimus is no longer a lab prototype—it’s moving toward scalable production by 2026.
If Tesla even partially succeeds in general-purpose robotics, it will unlock a Technology Acceptance Model (TAM) that dwarfs the current EV narrative .
Daily Technical Outlook
We’re currently in a bullish compression, with higher lows forming against the resistance area of $365. If $280 holds and the price continues to grind within this wedge, it sets up a volatility breakout scenario.
The breakout level to watch is $335. A daily close above that reopens $365. And beyond that, the resistance level is at $426.
My View
Tesla is compressing, both in price and narrative.
The long game is quietly coming into focus, where the risk/reward skews asymmetrically in favor of the upside.
This daily compression won’t last forever, and when it resolves, the move will likely be outsized.
TSLA to $420 - $454 areaTSLA is ready and primed to move into the $420 - $454 area over the coming quarter. This is a good options play.
We will encounter a little expected resistance at the $360 area, then an aggressive move to the $420 area.

$TSLA is in an accumulation phase.A classic Wyckoff scenario is playing out, offering a prime opportunity if you have the nerve for it.
Support: The key support zone is $300 - $305. As long as this holds, the bullish thesis is intact.
Resistance: The primary target is the top of the multi-month accumulation range, around $370 - $380. A breakout above this would signal the start of a major new markup phase.
TSLA: Sell ideaHigh probability of a decline in TSLA according to the pattern shown on the chart. Target 271.62.

TSLA BUY+++ WEDGE FORMING $339 first targetTSLA, like AAPL, is forming a bullish wedge which likely will break to the upside. First target is $339 at wedge resistance then will reevaluate
$TSLA Bad earnings reactionI was lucky to sell before earnings. Rebuying here. NASDAQ:TSLA had a bad earnings reaction, but otm calls getting bought at the open today 8/8 315c @8.3 for $2 million

CUP AND HANDLE $TSLA TO $515 MINIMUMThe cup and handle is a bullish chart pattern commonly used by traders to spot potential buying opportunities. It features a rounded "cup" formation followed by a slight downward drift forming the "handle." This pattern typically signals a continuation of an upward trend once the handle completes its consolidation phase.
ROBOTAXI BOOM
BUY NOW NASDAQ:TSLL NASDAQ:TSLA

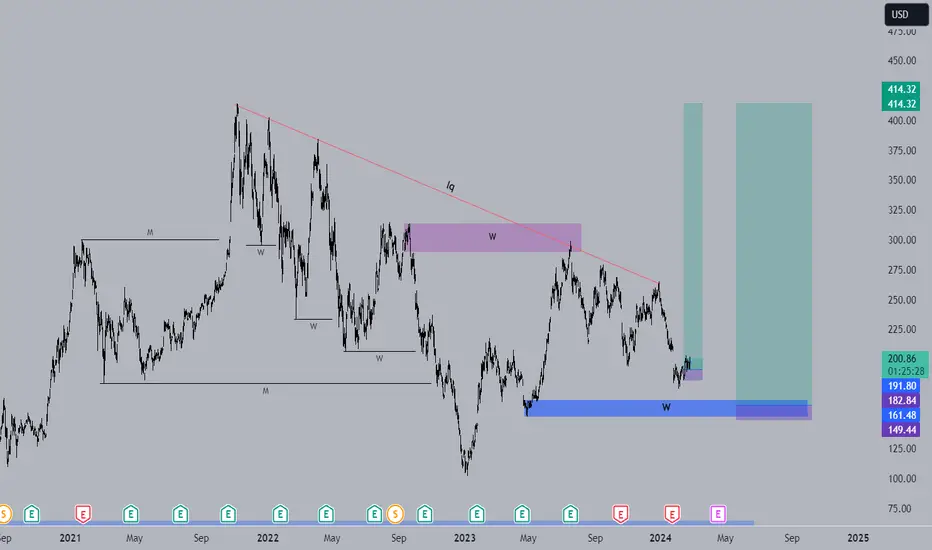
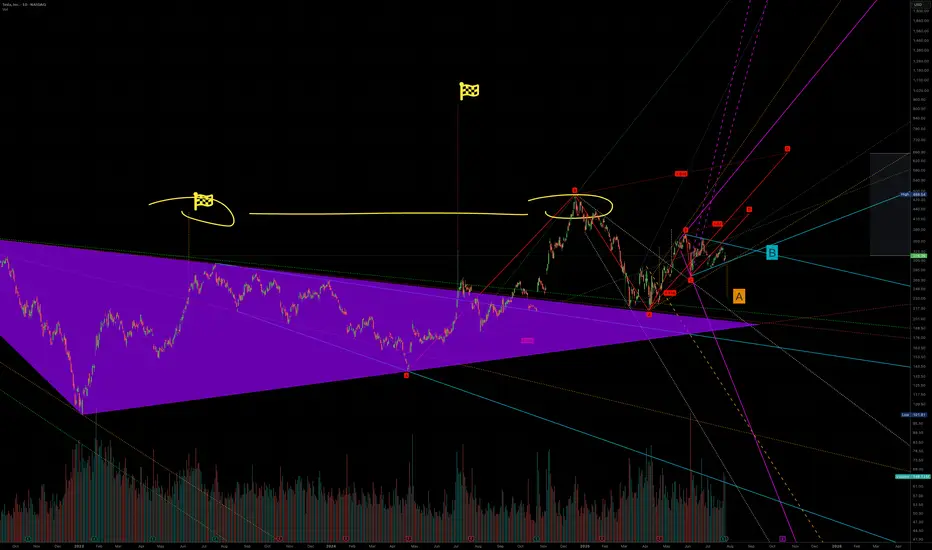
A to 236 or B killing A to 420Tesla is one of those stocks that is heavily manipulated algorithmically. When we were in an uptrend and needed a little push, a large fractal was created that could break a previously formed structure which should have taken us to $236(A). Interestingly, a very strong symmetrical triangle has emerged, influencing this upward movement, and the final price—due to some mystical reason—seems to be $420(B). It’s also worth noting that this whole move is being influenced by another similar structure whose target is above $600. So, if we analyze everything that’s happening, a 12% drop in sales means nothing compared to what Tesla will gain from robots, restaurants, and robotaxis, which I call RRR
Cup & HANDLE + Mini Double Bottom: $TSLA to $610 ScenarioI maintain a bullish stance on Tesla ( NASDAQ:TSLA ), supported by a compelling combination of technical patterns and strong fundamental drivers. The current chart setup reveals a Cup and Handle formation complemented by a Mini Double Bottom, both of which are classic bullish continuation patterns. These suggest a potential breakout scenario that could drive NASDAQ:TSLA to $610 by year-end.
Technical Roadmap:
Gap Fill to $408: Anticipated earnings momentum, particularly from the Robotaxi segment, is likely to propel the stock to fill the previous gap at $408.
Consolidation at $450: Following the gap fill, I expect a consolidation phase forming a “box” around the $450 level.
Breakout to $610: A decisive breakout above $450 could trigger a strong rally toward the $610 target.
***Current Key Catalysts Supporting the Bullish Thesis:
Robotaxi Expansion: Tesla’s autonomous driving initiative is gaining traction, with Robotaxi developments expected to significantly boost revenue and margins.
India Market Entry: Tesla’s upcoming launch in India opens access to one of the world’s largest and fastest-growing EV markets.
In-House Chip Development & Dojo 2 Expansion: Continued investment in AI infrastructure and custom silicon enhances Tesla’s competitive edge in autonomy and robotics.
Tesla Diner Launch: The near-completion of Tesla’s themed diner adds to brand visibility and customer engagement.
Global EV Adoption: Tesla continues to benefit from rising EV demand across multiple international markets.
Optimus Robot Hype: Growing interest in Tesla’s humanoid robot project could unlock new revenue streams and investor enthusiasm.
Favorable Macro Trends: A declining interest rate environment supports higher valuations for growth stocks like Tesla.
Institutional Accumulation: Recent trading activity suggests that institutional investors are accumulating shares within the current range.
Grok AI Integration: The integration of Grok AI into Tesla vehicles could enhance user experience and differentiate Tesla’s infotainment ecosystem.
Investment Strategy:
I recommend initiating or increasing exposure to NASDAQ:TSLL (leveraged Tesla ETF) ahead of the upcoming earnings report. This could offer amplified returns if the bullish scenario plays out. Consider accumulating further on any dips, particularly during the consolidation phase around $450.
BUY NOW NASDAQ:TSLA NASDAQ:TSLL

TSLA 24 JULY 2025I have marked 2 levels in green boxes. Price is inside this box pre market and TSLA is down -8.5% from the highs of $338 post market till $310 & -7.5% down from yesterday's close
A better level is the lower demand zone but its not the best. Price has not hit any major resistance.
My job is to read the data & trade. I am still bullish & 10% up down move is normal for Tesla &
This could be a "BEAR TRAP".
Bitcoin, SPX, Ethereum, Tesla: Whats Next? BTC appears to be showing distribution signs.
I do believe BTC local top is in, but alt coins like Ethereum can still push a bit higher.
Ethereum short around 3900-4000 looks promising
Tesla fell sharply on the back of cash flow burn and expenditures.
Investors are also fearful of sales decline and loss of EV credits.
SPX hit major long term resistance today. Coupling this with a depressed Vix we are likely setting up for a pullback in the market.
Small caps saw distribution today on the back of rising yields. A failed breakout observed on IWM chart.

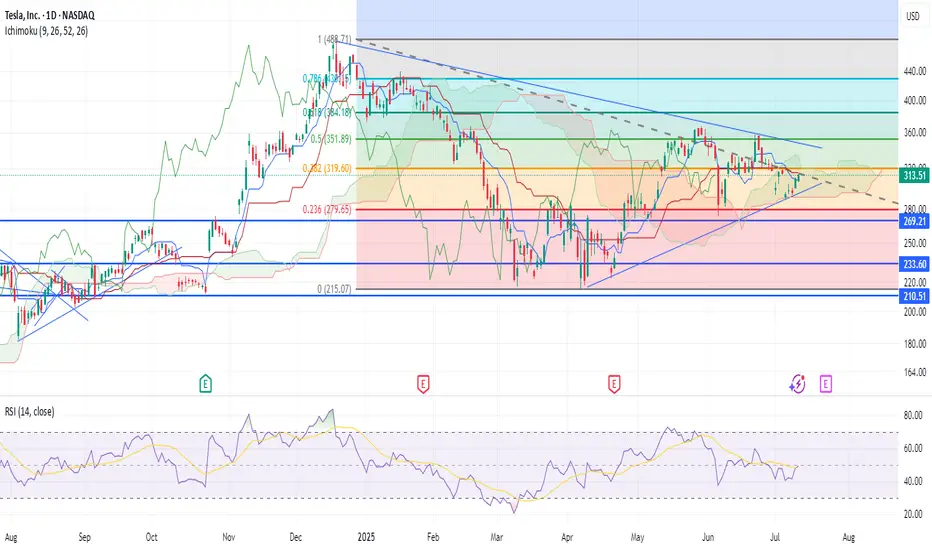
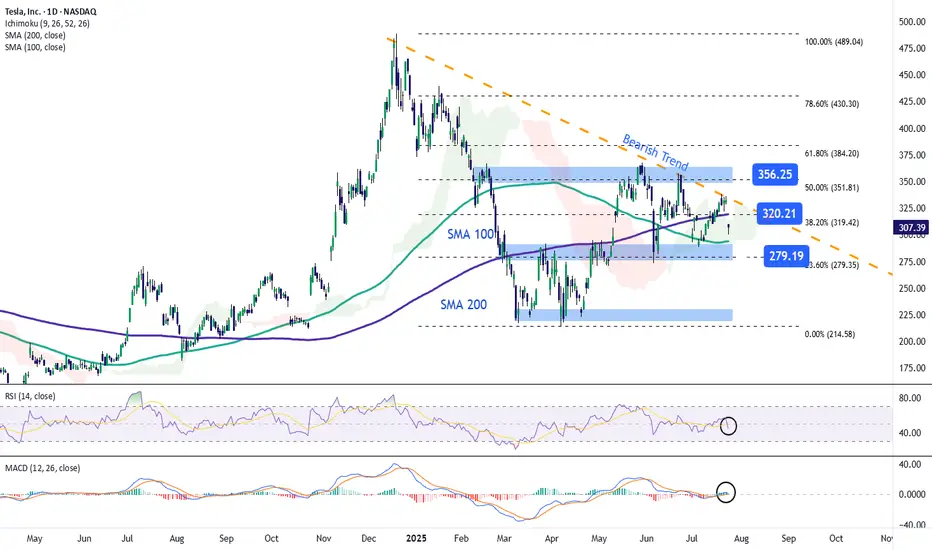
Tesla Stock Returns to the $300 ZoneShortly after reporting earnings, Tesla stock fell more than 9% in the final hours of trading. This new bearish move is mainly due to the company’s earnings per share (EPS) of $0.40, which missed expectations of $0.43, and revenue of $22.5 billion, below the projected $22.74 billion. These figures indicate that Tesla failed to meet market expectations, triggering a sustained downward trend in the stock. This move could extend further unless new catalysts emerge to restore investor confidence.
Downtrend Remains Intact
Recent price action has been clearly bearish and continues to reinforce a downtrend that began forming in late December. So far, there has been no significant bullish correction to challenge this structure, making the bearish pattern the dominant technical setup in the short term.
Technical Indicators
RSI: The indicator remains below the neutral 50 level, suggesting that selling momentum continues to build. If the downward path persists, bearish pressure may grow stronger in upcoming sessions.
MACD: The MACD histogram is currently hovering around the zero line, showing signs of technical indecision. However, if it crosses clearly below zero, it would confirm a more sustained bearish momentum.
Key Levels to Watch:
$356 – Major Resistance:
This level corresponds to the 50% Fibonacci retracement. A break above this zone could threaten the current downtrend.
$320 – Nearby Resistance:
Aligned with the 200-period simple moving average and the 38.2% Fibonacci level, a close above this point could reignite bullish sentiment and trigger a short-term upward move.
$280 – Key Support:
This is a critical support level, aligned with the 23.6% Fibonacci retracement. A breakdown here could extend the ongoing bearish trend.
Written by Julian Pineda, CFA – Market Analyst
TSLA Earnings Play (Bearish Bias)
🚨 TSLA Earnings Play (Bearish Bias) 🚨
Earnings Date: July 23, 2025 (AMC)
🧠 Confidence: 75% Bearish | 🎯 Target Move: -10%
⸻
🔍 Key Takeaways:
• 📉 TTM Revenue Growth: -9.2% → EV demand weakness
• 🧾 Margins Under Pressure: Gross 17.7%, Operating 2.5%, Net 6.4%
• ❌ EPS Beat Rate: Only 25% in last 8 quarters
• 🐻 Options Flow: High put volume at $330 strike
• 🧊 Low Volume Drift: Trading above 20/50MA but losing steam
• 📉 Sector Macro: EV competition + cyclical headwinds
⸻
🧨 Earnings Trade Setup:
{
"instrument": "TSLA",
"direction": "put",
"strike": 300,
"expiry": "2025-07-25",
"entry_price": 2.02,
"confidence": 75,
"profit_target": 6.06,
"stop_loss": 1.01,
"entry_timing": "pre_earnings_close",
"expected_move": 7.1,
"iv_rank": 0.75
}
⸻
🛠️ Trade Details:
Parameter Value
🎯 Strike Price $300 PUT
💰 Premium Paid $2.02
📅 Expiry Date 2025-07-25
🛑 Stop Loss $1.01
🚀 Profit Target $6.06
📏 Size 1 Contract
⏱ Entry Timing Pre-Earnings
📊 IV Rank 75%
🕒 Signal Time 7/23 @ 14:14 EDT
⸻
📈 Strategy Notes:
• 🧯 IV Crush Risk: Exit within 2 hours post-earnings
• 🎲 Risk/Reward: 1:3 setup | Max Loss: $202 | Max Gain: $606+
• 🧭 Volume Weakness & put/call skew signal downside
• 🧩 Macro + Tech + Flow Alignment = Tactical bearish play
⸻
🧠 “Not all dips are worth buying — this might be one to short.”
📢 Drop your thoughts — would you take the trade or fade it?
