0R18 trade ideas

BEST BUY - IN WAVE 5Based on Elliott wave analysis, BBY is on its final uptrend wave (5) of wave 5 of its current uptrend cycle.
Projected target to hit end of wave 5 is at ballpark value of USD148.7 before starts its ABC correction.
But do expect another 5 waves uptrend cycle after ABC correction.
Happy trading!

Best BuyFeeling about this one. Price broke out of downtrend and is testing resistance.
Strike Price: $114-$120
What do you think?
Like, Follow, Agree, Disagree

$BBY with a neutral outlook following its earnings #StocksThe PEAD projected a neutral outlook for $BBY after a negative under reaction following its earnings release placing the stock in drift D
If you would like to see the Drift for another stock please message us. Also click on the Like Button if this was useful and follow us or join us.

Head and Shoulders on Daily with Bearish Engulfing Under 200MAWe broke the neckline lets see if we get a dump from here.

Best Buy to Fill previous gap?With this market correction, we can see that Best Buy (BBY) is down to a support very much nearing a previous gap from July 2020. If the market continues to Bear, it is likely we see that Best Buy will in turn fill the gap and potentially retest previous resistances (now supports). This move can take a few months, but the dip will be a nice buy for long term BBY.
Otherwise, if the market begins to recover, we could see Best Buy return to previous highs, RSI is quite low, MACD is beginning a bullish indication, however the Market is very volatile. Play this safe, and buy at support, and average down.
Thanks for Viewing!

Cup and Handle Earnings 2-25 BMOEarnings before market open on the 25th.
We all know BBY can beat and still go down of miss and go up, or vice versa.
Targets for C&H pattern are based on the depth of the cup by subtracting the prior cup high from the cup low. I add 10 cents as a rule to that for a long entry level to try and avoid the R that may lurk there. I then add targets break out level verses the cup high using fib levels. Some may do this process differently.
To get mid cup which is a good source of support if the handle low fails, take that number and divide by 2.
It is hard to say Long when earnings are coming up because you just never know the market's response. Many of the stocks that have fallen after an earnings beat recently were in rising wedges or they were parabolic. Then others that are in a bullish pattern but still fall after a beat..so go figure (o:
There is also an inverted cup and handle pattern as well.
There have been a few rising wedges, but it appears BBY has broken bottom trendlines of each so far and recovered. Rising wedges are usually a terminal pattern as there are not many, in some case practically no one, left to buy the stock when pull back comes because they already bought it. It is usually popular stocks that gets stuck in these wedges it seems. This pattern interrupts supply and demand, but can be a very long term pattern. It is not valid until the bottom converging trendline is broken, and they usually slip out eventually. A strong stock may not fall too far..ie..NEE..I am hoping it's fall will be complete soon as it has broken the bottom trendline of it's own RW recently.
Not a recommendation.
Having a plan helps me know what I need to do if price goes up or if price goes down. Because a plan should include your targets d what price you want to get out if it turns on you, and they do sometimes. Some jot down the date they bought it and why they bought it as well as the profit and loss after selling. I look back and see what anything I need to be careful about in the future.
Without a plan you can lose your chips, then you can not play anymore (o:

BBY Going LongSeen a bit of a similarity in a previous run. I think BBY has shown some strength and with earnings approaching, seems there's some excitement about their performance.

BBY over 116.56Nice cup and handle forming, if it can cross the VPOC and get above recent intraday high this can see a nice move. Recent daily candles show that there's buying pressure to move higher but it just hasn't been able to hold the gains.

Buy Best Buy Co(BBY)I like to believe that price in this stock will rich the level I marked on chart 118.0
If you trade US stocks, consider going long.
Stop Loss : 105.42


BBY Cup and HandleKeeping an eye out for the break of handle around $116. Holding nicely on the 8ema. First target is the test of 52 week high at $124.89. A solid push above that can lead to the 2nd target of $133-$134 which is approximately the measured move. Although stochastic is in the overbought region it is crossed up signaling more upside to come.

Recognizing Short Squeeze Using VolumeThis is a recent short squeeze of BBY. I thought this would be a great example of how short squeezes can be identified with a basic understanding of volume and supply and demand. The text on the chart reads left to right.


Long | BBYNYSE:BBY
Possible Scenario: LONG
Evidence: Price Action
This is my idea and could be wrong 100%.
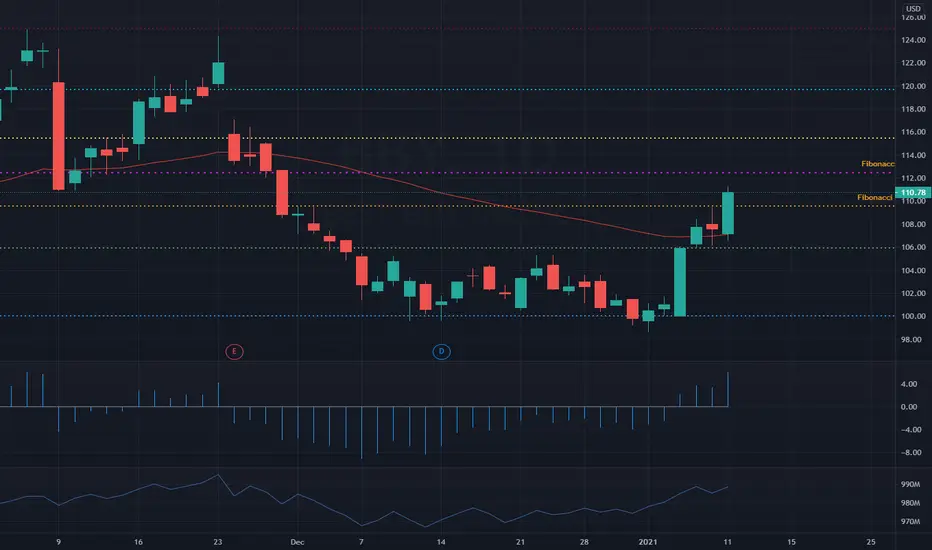
BBY Correction Wave PredictionI think we see short term upside to the 110 resistance area before it makes its B-C Wave correction to fill the gap below.
There is a bullish divergence on the rsi vs the chart which points to shortterm upside
In 2 instances on the lower lows, when a support area is hit buying volume picks up for that day.
Volume is also declining, and eventually will break out.
TLDR: Short term uptick in price before a final drop to fill the gap below

BBY lower low made, invalidates previous 1-2 setupStopped out of trade after invalidation of our 1-2 setup off the lows made earlier in the month. Waiting on some consolidation and signs of 1-2 start before taking entry again.
Disclaimer: The proceeding content is informational only and based on information available when created. It is not an offer or a solicitation nor is it tax or legal advice. It does not consider your financial circumstances and objectives and may not be suitable for you.
Copyright Rohan Karunaratne 2020


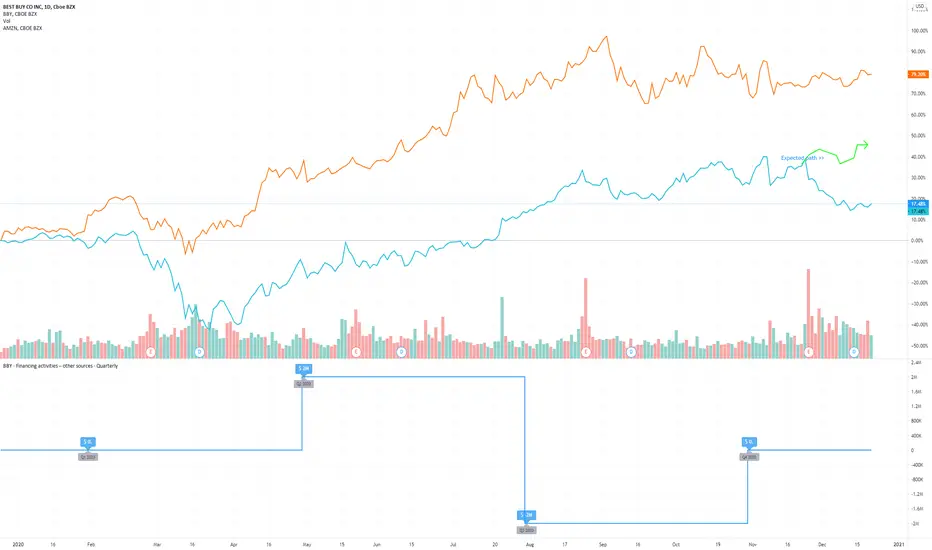
Potential 20+% up side in very short timeOne year compare between AMAZON and Best Buy. You can see BBY going the wrong path even after giving amazing results. If there was problem with COVID then both AMAZON ,BBY and other retailers should have suffered the same fate.
BBY @ buying pointPrice respecting long term resistance, Seasonal trends in favour, OBV on the right trend, ready to move above $109 again.

BBY Look for a buy around USD 80 dollar areaBest buy Inc look for a potential buy at USD 80 area , the trend for long term is up and take profit at USD 140 to USD 160.
