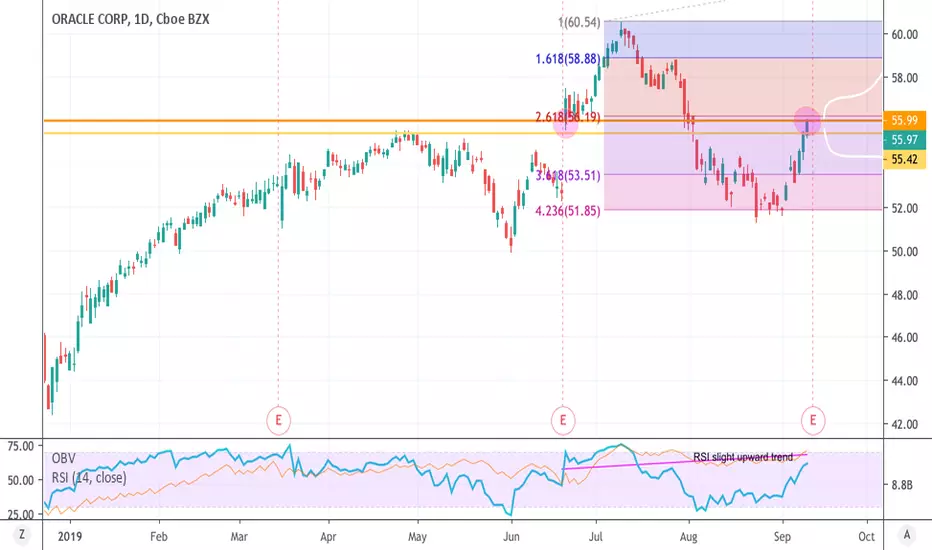
ORCL technicals at resistance level with earningsTechnical Analysis
On June 20th, we started and important channel, and we are back at this level at $55.5
Since this date, we have a slight RSI upward trend, with an even bigger OBV uptrend.
Fibonacci retracement level at 50%
Important dates
Earnings will be announced Thursday September 12th, after the close.
0R1Z trade ideas
$ORCL Next Earnings could hit $63There is nothing stopping $ORCL breaking the into the 60's when the market opens.
Target $60 - $61 and take profit


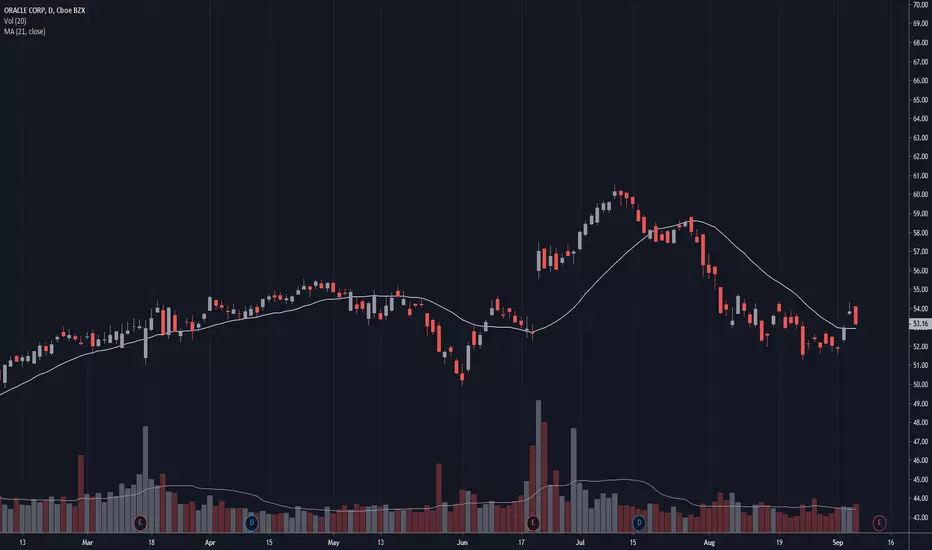


ORCL GAP Fill ReversalORCL has just closed a 5% gap in its chart, this typically follows a reversal to where the price was before the gap, which is considered the new upward resistance. This is a gap fill reversal for a 5% profit potential. I'll use the 200 sma as my stop alert.

Daily ORCL stock price trend forecasts analysis.12-JUL
Investing position: In Rising section of high profit & low risk
S&D strength Trend: In the midst of an adjustment trend of downward direction box pattern price flow marked by limited rises and downward fluctuations.
Today's S&D strength Flow: Supply-Demand(S&D) strength flow appropriate to the current trend.
read more: www.pretiming.com
Forecast D+1 Candlestick Color : GREEN Candlestick
%D+1 Range forecast: 0.5% (HIGH) ~ -0.6% (LOW), 0.1% (CLOSE)
%AVG in case of rising: 1.1% (HIGH) ~ -0.4% (LOW), 0.8% (CLOSE)
%AVG in case of falling: 0.5% (HIGH) ~ -1.0% (LOW), -0.4% (CLOSE)

ORCL - SWING TRADE What a beautiful setup for a gap and trap swing trade.. Look at all these people trapped..

$ORCL see if this has a day 2 see $ADBE for reference May not be the day for it but watching to see if ORCL can clear 57.50

Oracle surprises naysayers with ambitious projections for 202The epiphany of OLD TECH NYSE:ORCL announced quarterly revenue of $11.1 billion today, yielding earnings of $1.16 per share. Analysts were expecting the company to report revenue of $10.95 billion and earnings of $1.07 per share.During a very upbeat earnings call, CEO Safra Catz said she expects fiscal 2020 revenue to grow “faster” than in the previous year and projected “double-digit” earnings-per-share growth.
"Our high-margin Fusion and NetSuite cloud applications businesses are growing rapidly, while we downsize our low-margin legacy hardware business. The net result of this shift away from commodity hardware to cloud applications was a Q4 non-GAAP operating margin of 47%, the highest we've seen in five years," said CEO Safra Catz.
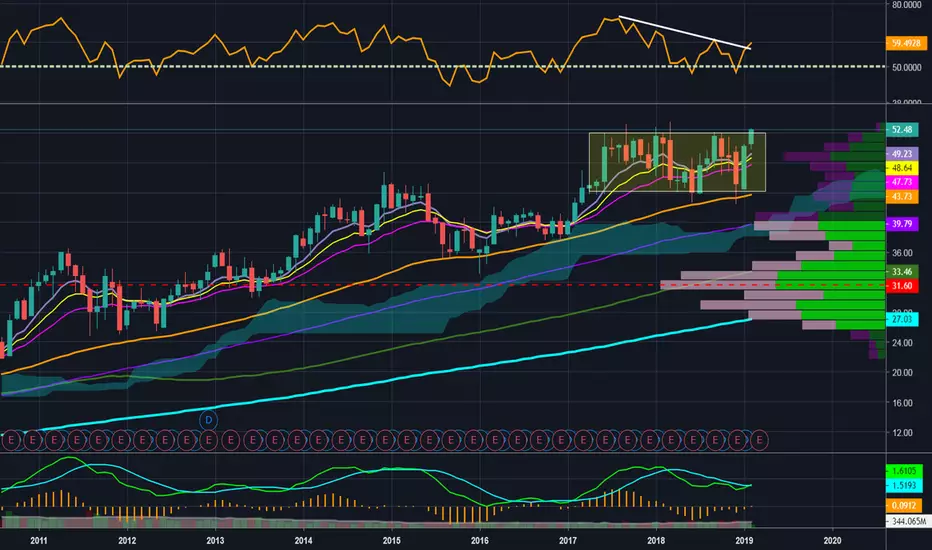
Technically the stock is setting up for a major breakout from a 2 year channel, afterhours the stock has moved above all MA'S and Ichimoku cloud is now support.


THE WEEK AHEAD: ORCL, GDXJ, TBT, TLT, SMH, OIHEARNINGS
ORCL (50/29) releases earnings on Wednesday after market close, so look to put on a play in the waning hours of Wednesday's New York session.
Pictured here is a non-standard short strangle, with the short call side doubled up in order to compensate for greater than one dollar wide strikes: 1.30 credit, break evens at 48.70/58.15, and delta/theta of -5.52/58.15.
As of Friday close, the June 21st to July 19th monthly volatility contraction is from 46.6% to 29.3% or about 29.7%.
Look to manage intratrade by rolling the untested side toward current price on approaching worthless with a 50% max take profit target.
Generally, I don't play stuff this small that doesn't have dollar wides, since rolling intratrade can be a headache, as can rolling out, since there is limited strike availability. It's really another aspect of liquidity, which is not only about the width of markets intraexpiry, but also about the availability of expiries out in time, as well as strikes.
BROAD MARKET
EEM (27/20)
QQQ (23/20); NDX (24/20)
IWM (23/19); RUT (25/19)
SPY (21/15); SPX (19/15)
EFA (16/13)
With 33 days to go in the July cycle and 61 to go for August, we're kind of in the "in between" for the 45 days 'til expiry sweet spot, so I would wait until August comes closer into view for either broad market or sector if you want to keep things in that 45 days 'til expiry wheelhouse.
SECTOR EXCHANGE-TRADED FUNDS
Top 5 By Rank: GDXJ (62/31), TBT (52/24), TLT (51/12), SMH (50/31), OIH (49/40).
SINGLE NAME WITH EARNINGS IN THE REAR VIEW
A lot of earnings start kicking off in the July cycle, so would wait to play these as earnings announcement volatility contraction plays instead of wading in here and getting caught in a volatility expansion.
ME PERSONALLY
To keep things simple, mundane, and boring throughout the summer months, I'm looking to just to play broad market for the next couple of cycles -- SPY/SPX, QQQ/NDX, and IWM/RUT. (See, e.g., RUT Sept Iron Condor below).


Oracle $ORCL breaking out of two year box rangeORCL also seeing monthly RSI break out and MACD looks to cross bullish
ORCL Short Price rejection at 51.50 . The hourly chart was broken but recover and forming a double top or M . This might takes weeks for a nice drop.


ORACLE Sell IdeaORACLE Sell Idea @Monthly Supply Zone (50.70 - 53.44)
Sell Limit: 50.50
Stop Loss: 53.70
Take Profit: 40.54
Risk Management = 0.01/$100, With Stop Loss
Risk Management = 0.01/$200, No Stop Loss
Recommended Leverage not to exceed 1:50
Recommended Risk Ratio 1:2 – 1:3
Close partially the contract once it reaches 50% of profit, Move stop loss over the entry level
Close partially the contract once it reaches 80% of the profit


ORACLE: POTENTIAL HARMONIC PATTERN ON THE MAKINGORACLE is still in a downtrend. Look to the price action on the level posted on chart for a potential completion of this harmonic pattern
