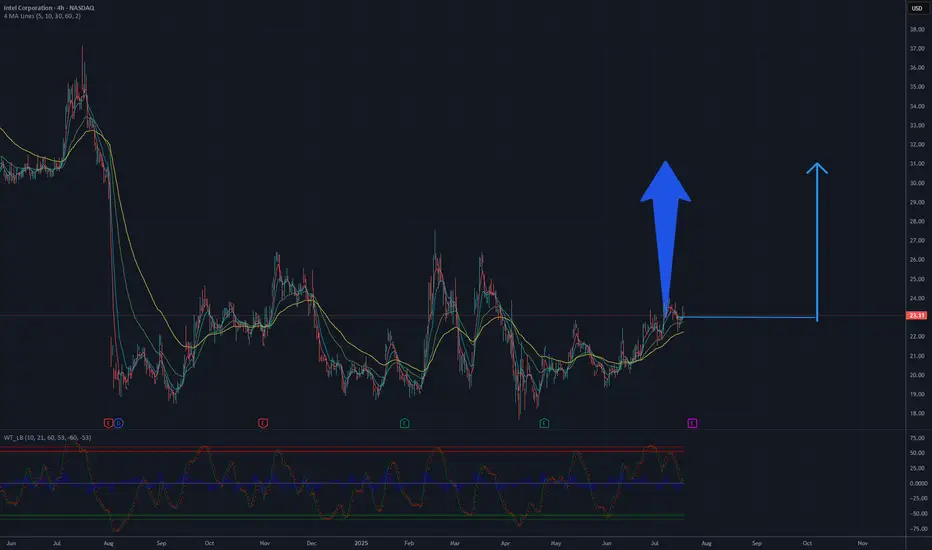
Bullish?Anyone have any thoughts? Im thinking 9/19 24C. Its looking primed and I just saw the short squeeze news, not that it could really mean anything, but what do yall think?
Next report date
—
Report period
—
EPS estimate
—
Revenue estimate
—
−4.48 USD
−18.76 B USD
53.10 B USD
4.35 B
About Intel Corporation
Sector
Industry
CEO
Lip-Bu Tan
Website
Headquarters
Santa Clara
Founded
1968
FIGI
BBG00QKLW2G6
Intel Corp. engages in the design, manufacture, and sale of computer products and technologies. It delivers computer, networking, data storage, and communications platforms. The firm operates through the following segments: Client Computing Group (CCG), Data Center and AI (DCAI), Network and Edge (NEX), Mobileye, Accelerated Computing Systems and Graphics (AXG), Intel Foundry Services (IFS), and All Other. The CCG segment consists of platforms designed for notebooks, 2-in-1 systems, desktops, tablets, phones, wireless and wired connectivity products, and mobile communication components. The DCAI segment delivers solutions to cloud service providers and enterprise customers, along with silicon devices for communications service providers and high-performance computing customers. The NEX segment offers computing system solutions from inflexible fixed-function hardware to general-purpose compute, acceleration, and networking devices running cloud native software on programmable hardware. The Mobileye segment develops driving assistance and self-driving solutions. The AXG segment provides products and technologies designed to help customers solve the toughest computational problems. Its products include CPUs for high-performance computing and GPUs targeted for a range of workloads and platforms, from gaming and content creation on client devices to delivering media and gaming in the cloud, and the most demanding high-performance computing and AI workloads on supercomputers. The IFS segment refers to full stack solutions created from the foundry industry ecosystem. The All Other segment represents results from other non-reportable segments and corporate-related charges. The company was founded by Robert Norton Noyce and Gordon Earle Moore on July 18, 1968 and is headquartered in Santa Clara, CA.
Related stocks

Is it a time for INTEL? 32 $ will be soon.The Intel Corporation (INTC) chart on NASDAQ illustrates the stock price dynamics from 2024 to July 2025. Initially, the price rose to a peak in the first half of 2024, followed by a significant decline, reaching its lowest point around 24 USD by the end of 2024. Since then, the price has been conso
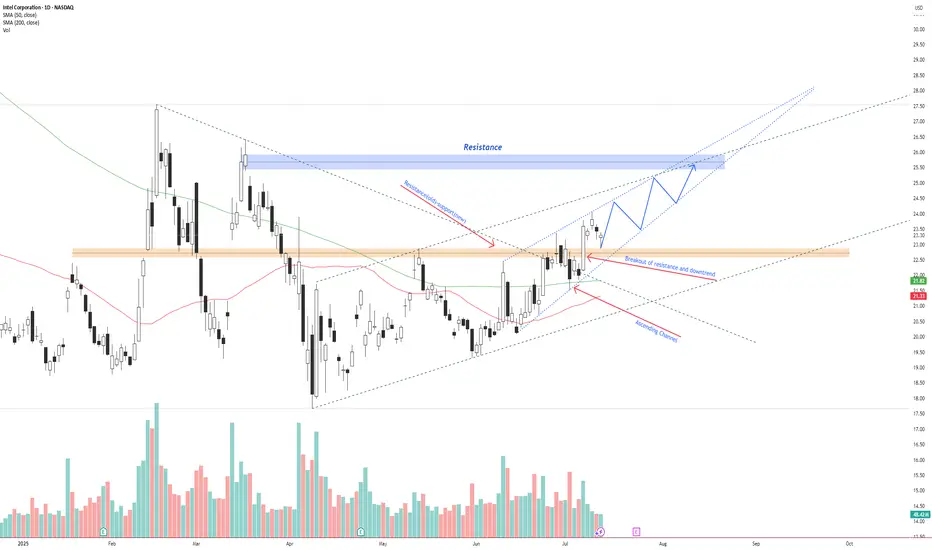
INTC – Breakout Confirmed, Bullish Continuation Inside AscendingIntel NASDAQ:INTC has broken above previous resistance and a descending trendline, confirming a bullish reversal.
Price is currently respecting an ascending channel and forming higher highs and higher lows. The breakout retest around $22.50 has held as new support.
If the current structure rem
I could be wrong.... but: Earnings breakout? Intel has certainly tested the patience of investors lately. That said, it’s in these moments — when sentiment turns and many walk away — that opportunity quietly builds. I’m maintaining my position, currently averaging around $24 per share alongside a sizable options exposure.
What makes this cycl
Intel Share Price Hits 3-Month High Without Clear CatalystIntel (INTC) Share Price Hits 3-Month High Without Clear Catalyst
Intel Corporation (INTC) stocks rose by over 7% yesterday, making them one of the top performers in the S&P 500 index (US SPX 500 mini on FXOpen). As a result, the stock price reached its highest level in three months.
What’s notab

Intel Falling Wedge on the Weekly Time Frame.If we can hold and get above the 200 EMA on the weekly time frame then we can target the 0.382.
The main target would be the golden pocxket at 0.618.
The target is $50 located at the 0.786.

INTC wyckoff channel INTC technicals show its in a wyckoff channel with lots of accummulation over the past couple weeks-months; VPA confirms buyers are positioned already.
In case of a breakout it would look to close the gap, consolidate before continuing up.

Intel - The rally starts!Intel - NASDAQ:INTC - creates a major bottom:
(click chart above to see the in depth analysis👆🏻)
For approximately a full year, Intel has not been moving anywhere. Furthermore Intel now trades at the exact same level as it was a decade ago. However price is forming a solid bottom formation at

INTCThe INTC stock analysis on the weekly timeframe shows the formation of strong patterns and is currently within excellent demand zones, as indicated by the green area on the chart. Our target is the specified supply zone.

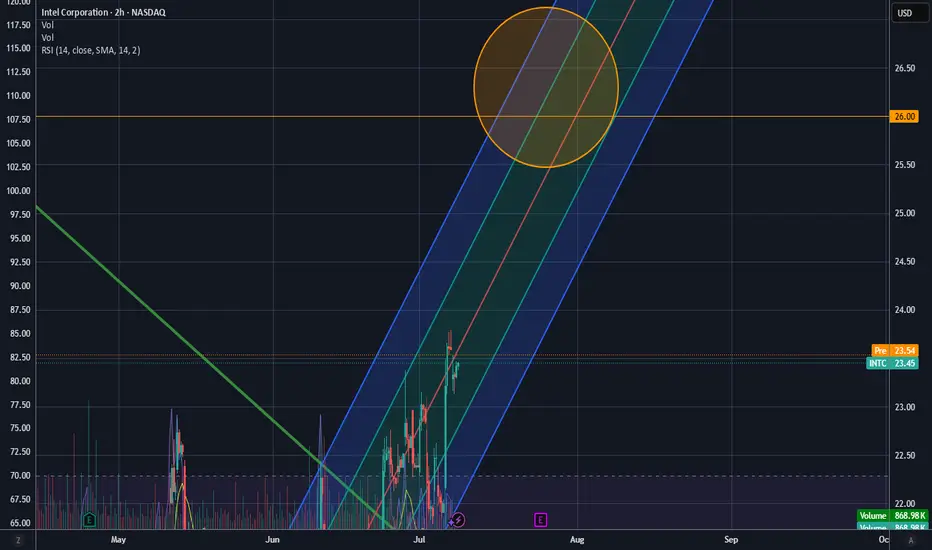
To 26$The price has been repeating the same pattern for months…
It drops to the $19 support level (blue line), then climbs back up to the $22 resistance (purple line).
When it breaks above $22, it rallies to $26 (light blue line), only to fall back to $19 after failed breakouts.
Last week, it closed ab

See all ideas
Summarizing what the indicators are suggesting.
Neutral
SellBuy
Strong sellStrong buy
Strong sellSellNeutralBuyStrong buy
Neutral
SellBuy
Strong sellStrong buy
Strong sellSellNeutralBuyStrong buy
Neutral
SellBuy
Strong sellStrong buy
Strong sellSellNeutralBuyStrong buy
An aggregate view of professional's ratings.
Neutral
SellBuy
Strong sellStrong buy
Strong sellSellNeutralBuyStrong buy
Neutral
SellBuy
Strong sellStrong buy
Strong sellSellNeutralBuyStrong buy
Neutral
SellBuy
Strong sellStrong buy
Strong sellSellNeutralBuyStrong buy
Displays a symbol's price movements over previous years to identify recurring trends.
US458140BK5
INTEL 20/60Yield to maturity
8.22%
Maturity date
Feb 15, 2060
US458140BX7
INTEL 21/61Yield to maturity
8.11%
Maturity date
Aug 12, 2061
US458140BW9
INTEL 21/51Yield to maturity
8.00%
Maturity date
Aug 12, 2051
US458140AS9
INTEL CORP. 15/25Yield to maturity
7.96%
Maturity date
Jul 29, 2025
INTC4914060
Intel Corporation 3.25% 15-NOV-2049Yield to maturity
7.90%
Maturity date
Nov 15, 2049
US458140BV1
INTEL 21/41Yield to maturity
7.46%
Maturity date
Aug 12, 2041
INTC4633368
Intel Corporation 3.734% 08-DEC-2047Yield to maturity
7.38%
Maturity date
Dec 8, 2047
US458140AV2
INTEL CORP. 16/46Yield to maturity
7.31%
Maturity date
May 19, 2046
US458140AY6
INTEL CORP. 17/47Yield to maturity
7.30%
Maturity date
May 11, 2047
INTC4969550
Intel Corporation 4.95% 25-MAR-2060Yield to maturity
7.03%
Maturity date
Mar 25, 2060
INTC5456467
Intel Corporation 5.05% 05-AUG-2062Yield to maturity
7.00%
Maturity date
Aug 5, 2062
See all 0R24 bonds
Curated watchlists where 0R24 is featured.


Frequently Asked Questions
The current price of 0R24 is 23.56 USD — it has increased by 0.90% in the past 24 hours. Watch INTEL CORP COM USD0.001 stock price performance more closely on the chart.
Depending on the exchange, the stock ticker may vary. For instance, on LSE exchange INTEL CORP COM USD0.001 stocks are traded under the ticker 0R24.
0R24 stock has risen by 2.09% compared to the previous week, the month change is a 11.57% rise, over the last year INTEL CORP COM USD0.001 has showed a −53.38% decrease.
We've gathered analysts' opinions on INTEL CORP COM USD0.001 future price: according to them, 0R24 price has a max estimate of 28.30 USD and a min estimate of 14.00 USD. Watch 0R24 chart and read a more detailed INTEL CORP COM USD0.001 stock forecast: see what analysts think of INTEL CORP COM USD0.001 and suggest that you do with its stocks.
0R24 reached its all-time high on Apr 17, 2019 with the price of 59.52 USD, and its all-time low was 16.04 USD and was reached on Jun 11, 2025. View more price dynamics on 0R24 chart.
See other stocks reaching their highest and lowest prices.
See other stocks reaching their highest and lowest prices.
0R24 stock is 2.79% volatile and has beta coefficient of 1.65. Track INTEL CORP COM USD0.001 stock price on the chart and check out the list of the most volatile stocks — is INTEL CORP COM USD0.001 there?
Today INTEL CORP COM USD0.001 has the market capitalization of 101.37 B, it has decreased by −2.69% over the last week.
Yes, you can track INTEL CORP COM USD0.001 financials in yearly and quarterly reports right on TradingView.
INTEL CORP COM USD0.001 is going to release the next earnings report on Jul 24, 2025. Keep track of upcoming events with our Earnings Calendar.
0R24 earnings for the last quarter are 0.13 USD per share, whereas the estimation was 0.01 USD resulting in a 1.81 K% surprise. The estimated earnings for the next quarter are 0.01 USD per share. See more details about INTEL CORP COM USD0.001 earnings.
INTEL CORP COM USD0.001 revenue for the last quarter amounts to 12.67 B USD, despite the estimated figure of 12.30 B USD. In the next quarter, revenue is expected to reach 11.97 B USD.
0R24 net income for the last quarter is −821.00 M USD, while the quarter before that showed −126.00 M USD of net income which accounts for −551.59% change. Track more INTEL CORP COM USD0.001 financial stats to get the full picture.
Yes, 0R24 dividends are paid quarterly. The last dividend per share was 0.13 USD. As of today, Dividend Yield (TTM)% is 2.15%. Tracking INTEL CORP COM USD0.001 dividends might help you take more informed decisions.
As of Jul 24, 2025, the company has 108.9 K employees. See our rating of the largest employees — is INTEL CORP COM USD0.001 on this list?
EBITDA measures a company's operating performance, its growth signifies an improvement in the efficiency of a company. INTEL CORP COM USD0.001 EBITDA is 7.37 B USD, and current EBITDA margin is 12.56%. See more stats in INTEL CORP COM USD0.001 financial statements.
Like other stocks, 0R24 shares are traded on stock exchanges, e.g. Nasdaq, Nyse, Euronext, and the easiest way to buy them is through an online stock broker. To do this, you need to open an account and follow a broker's procedures, then start trading. You can trade INTEL CORP COM USD0.001 stock right from TradingView charts — choose your broker and connect to your account.
Investing in stocks requires a comprehensive research: you should carefully study all the available data, e.g. company's financials, related news, and its technical analysis. So INTEL CORP COM USD0.001 technincal analysis shows the neutral today, and its 1 week rating is sell. Since market conditions are prone to changes, it's worth looking a bit further into the future — according to the 1 month rating INTEL CORP COM USD0.001 stock shows the sell signal. See more of INTEL CORP COM USD0.001 technicals for a more comprehensive analysis.
If you're still not sure, try looking for inspiration in our curated watchlists.
If you're still not sure, try looking for inspiration in our curated watchlists.