REGN | Regeneron Pharmaceuticals – Macro Reaccumulation SetupPublished by WaverVanir International LLC | 06/12/2025
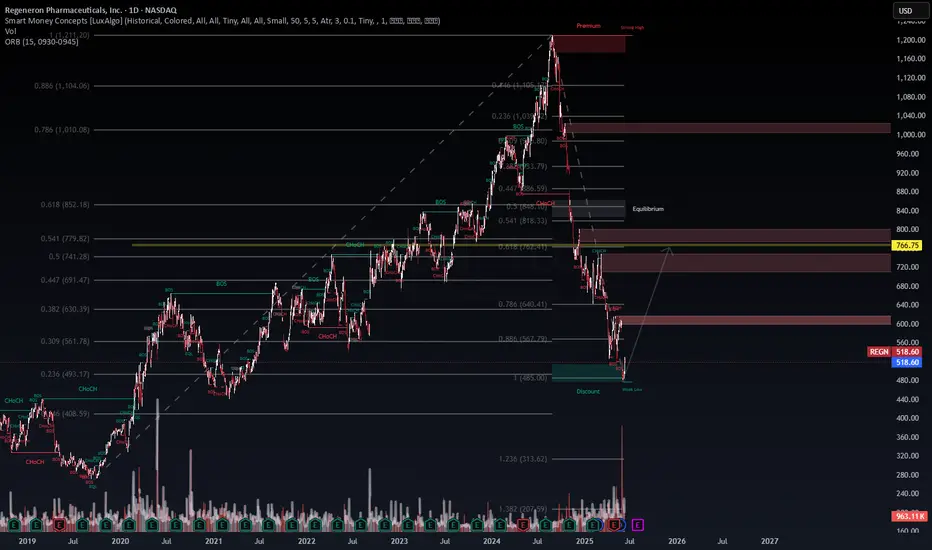
Regeneron has completed a deep retracement, touching the 0.886 Fibonacci level (~$567) and entering a strong discount zone, coinciding with a weak low sweep and increasing volume — suggesting potential accumulation by institutions.
🔍 Key Confl
Next report date
—
Report period
—
EPS estimate
—
Revenue estimate
—
42 USD
4.41 B USD
14.20 B USD
104.07 M
About Regeneron Pharmaceuticals, Inc.
Sector
Industry
CEO
Leonard S. Schleifer
Website
Headquarters
Tarrytown
Founded
1988
FIGI
BBG00JRY9CR9
Regeneron Pharmaceuticals, Inc. is a biotechnology company, which engages in the discovery, invention, development, manufacture, and commercialization of medicines. Its product portfolio includes the following brands: Dupixent, Evkeeza, Eylea, Inmazeb, and Kevzara. The firm accelerates the traditional drug development process through its proprietary VelociSuite technologies such as VelocImmune, which uses unique genetically humanized mice to produce optimized fully human antibodies and bispecific antibodies. The company was founded by Alferd G. Gilman, Leonard S. Schleifer, George Damis Yancopoulos, and Eric M. Shooter on January 8, 1988, and is headquartered in Tarrytown, NY.
Related stocks
Regeneron Pharmaceuticals 3 Red Quarters in a row = 80% BullishSet Up: 3 Red Quarter in a row 80% a trough has being struck EXCEPT
2004 when we had 5 Red Quarters which resulted in (-78%)
- Risk down is still $260

Regn relative to SPX is getting "First timer" on RSi , B% & MACDRegn Relative to SPX is getting hammered big time !!!
Unless we are about to crash like 1929 = $1, these
readings we are seeing have not been seeing since ever !!!

Regeneron Pharmaceuticals Q2-Q3 Confirmed "Troughing in ProgressIF we do not crash like many Elliottsions are suggesting implying of Grand 5th wave since 1929...
iF we do not start WW3...
IF everything utterly absolute out there in the pharmaceutical industries locally
and globally...
IF our studies of the relation between XLV and Regeneron Pharmaceuticals is
r

REGN - Investment …We have the weekly and monthly MACDs reset in the basement and we have reached my blue long term trend line at the bottom of the channel. This a real company …sell off has been way overdone.

REGN – Bullish Engulfing + RSI Divergence at Weekly DemandRegeneron (REGN) is showing strong technical signals of potential reversal from a key weekly demand zone, replicating a setup similar to March 2021.
🔹 Bullish Engulfing Candle forms directly at the demand zone after a multi-month downtrend.
🔹 Volume Spike confirms strong buyer interest.
🔹 RSI shows

Regeneron Pharmaceutical's MFI implying "Trough in the making"1/ Using just this indicator " Alon" is a very dangerous game like you can blow up your
account !!!
2/Non the less, such readings accompanied by (-86%) or ( 78-%) or (-91%) draw downs
such as on the chart above has resulted in the past, in 3 occasions, in big and historical
bullish moves !!! "Gener

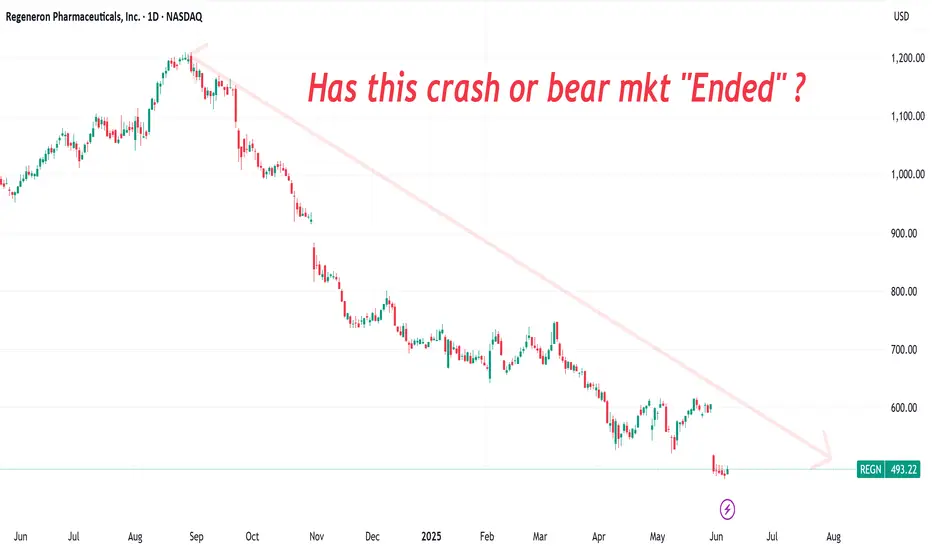
Regn's Bear market is getting close to an "End" or not ?This is 101 crash and bear market together no " Pause" No "Rest" area
one almost straight line going down and hardly you can count the waves !!!
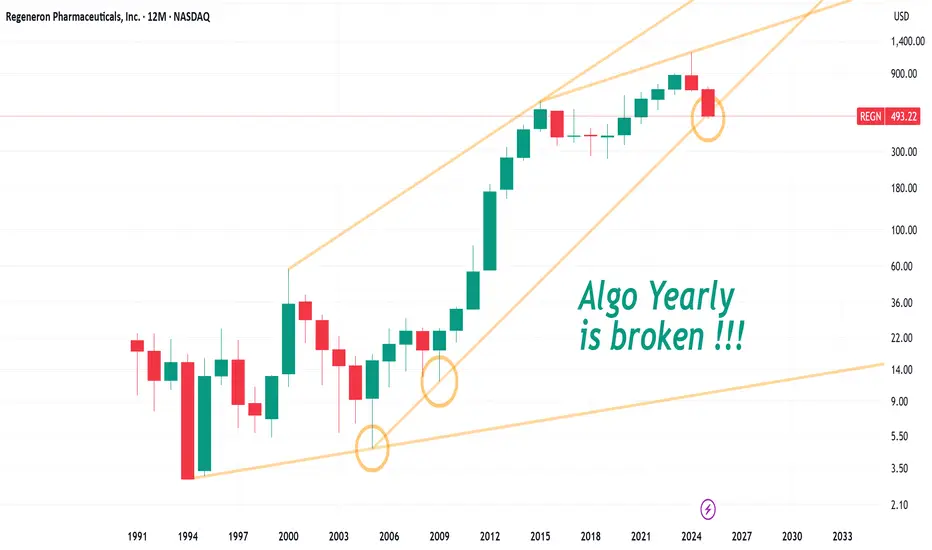
Regn's Yearly Algo chart is broken "Flash Red" unless W bounce 101 Trend analysis nothing fancy here just a line on the algo method of charting
This is a fact not a suggesting of up down movements.
Regn's RSI reading is at it's lowest since IPO Monthly!!45%-500% Moves were followed after registering higher readings all else absolute !!!
Past performance dose not guarantee futures returns but this reading is "One of a kind"
to say the least !!!

See all ideas
Summarizing what the indicators are suggesting.
Neutral
SellBuy
Strong sellStrong buy
Strong sellSellNeutralBuyStrong buy
Neutral
SellBuy
Strong sellStrong buy
Strong sellSellNeutralBuyStrong buy
Neutral
SellBuy
Strong sellStrong buy
Strong sellSellNeutralBuyStrong buy
An aggregate view of professional's ratings.
Neutral
SellBuy
Strong sellStrong buy
Strong sellSellNeutralBuyStrong buy
Neutral
SellBuy
Strong sellStrong buy
Strong sellSellNeutralBuyStrong buy
Neutral
SellBuy
Strong sellStrong buy
Strong sellSellNeutralBuyStrong buy
Displays a symbol's price movements over previous years to identify recurring trends.
REGN5027988
Regeneron Pharmaceuticals, Inc. 2.8% 15-SEP-2050Yield to maturity
7.35%
Maturity date
Sep 15, 2050
REGN5027987
Regeneron Pharmaceuticals, Inc. 1.75% 15-SEP-2030Yield to maturity
4.77%
Maturity date
Sep 15, 2030
See all 0R2M bonds
Curated watchlists where 0R2M is featured.


Frequently Asked Questions
The current price of 0R2M is 564 USD — it has increased by 1.87% in the past 24 hours. Watch REGENERON PHARMACEUTICALS INC COM STK USD0.001 stock price performance more closely on the chart.
Depending on the exchange, the stock ticker may vary. For instance, on LSE exchange REGENERON PHARMACEUTICALS INC COM STK USD0.001 stocks are traded under the ticker 0R2M.
0R2M stock has fallen by −0.34% compared to the previous week, the month change is a 5.54% rise, over the last year REGENERON PHARMACEUTICALS INC COM STK USD0.001 has showed a −48.33% decrease.
We've gathered analysts' opinions on REGENERON PHARMACEUTICALS INC COM STK USD0.001 future price: according to them, 0R2M price has a max estimate of 940.00 USD and a min estimate of 504.00 USD. Watch 0R2M chart and read a more detailed REGENERON PHARMACEUTICALS INC COM STK USD0.001 stock forecast: see what analysts think of REGENERON PHARMACEUTICALS INC COM STK USD0.001 and suggest that you do with its stocks.
0R2M reached its all-time high on Aug 27, 2024 with the price of 1,210 USD, and its all-time low was 274 USD and was reached on Oct 3, 2019. View more price dynamics on 0R2M chart.
See other stocks reaching their highest and lowest prices.
See other stocks reaching their highest and lowest prices.
0R2M stock is 8.12% volatile and has beta coefficient of 0.74. Track REGENERON PHARMACEUTICALS INC COM STK USD0.001 stock price on the chart and check out the list of the most volatile stocks — is REGENERON PHARMACEUTICALS INC COM STK USD0.001 there?
Today REGENERON PHARMACEUTICALS INC COM STK USD0.001 has the market capitalization of 60.33 B, it has decreased by −2.11% over the last week.
Yes, you can track REGENERON PHARMACEUTICALS INC COM STK USD0.001 financials in yearly and quarterly reports right on TradingView.
REGENERON PHARMACEUTICALS INC COM STK USD0.001 is going to release the next earnings report on Oct 30, 2025. Keep track of upcoming events with our Earnings Calendar.
0R2M earnings for the last quarter are 12.89 USD per share, whereas the estimation was 8.43 USD resulting in a 52.89% surprise. The estimated earnings for the next quarter are 9.56 USD per share. See more details about REGENERON PHARMACEUTICALS INC COM STK USD0.001 earnings.
REGENERON PHARMACEUTICALS INC COM STK USD0.001 revenue for the last quarter amounts to 3.68 B USD, despite the estimated figure of 3.29 B USD. In the next quarter, revenue is expected to reach 3.51 B USD.
0R2M net income for the last quarter is 1.39 B USD, while the quarter before that showed 808.70 M USD of net income which accounts for 72.08% change. Track more REGENERON PHARMACEUTICALS INC COM STK USD0.001 financial stats to get the full picture.
Yes, 0R2M dividends are paid quarterly. The last dividend per share was 0.88 USD. As of today, Dividend Yield (TTM)% is 0.31%. Tracking REGENERON PHARMACEUTICALS INC COM STK USD0.001 dividends might help you take more informed decisions.
REGENERON PHARMACEUTICALS INC COM STK USD0.001 dividend yield was 0.00% in 2024, and payout ratio reached 0.00%. The year before the numbers were 0.00% and 0.00% correspondingly. See high-dividend stocks and find more opportunities for your portfolio.
As of Aug 3, 2025, the company has 15.11 K employees. See our rating of the largest employees — is REGENERON PHARMACEUTICALS INC COM STK USD0.001 on this list?
EBITDA measures a company's operating performance, its growth signifies an improvement in the efficiency of a company. REGENERON PHARMACEUTICALS INC COM STK USD0.001 EBITDA is 4.47 B USD, and current EBITDA margin is 32.79%. See more stats in REGENERON PHARMACEUTICALS INC COM STK USD0.001 financial statements.
Like other stocks, 0R2M shares are traded on stock exchanges, e.g. Nasdaq, Nyse, Euronext, and the easiest way to buy them is through an online stock broker. To do this, you need to open an account and follow a broker's procedures, then start trading. You can trade REGENERON PHARMACEUTICALS INC COM STK USD0.001 stock right from TradingView charts — choose your broker and connect to your account.
Investing in stocks requires a comprehensive research: you should carefully study all the available data, e.g. company's financials, related news, and its technical analysis. So REGENERON PHARMACEUTICALS INC COM STK USD0.001 technincal analysis shows the buy rating today, and its 1 week rating is sell. Since market conditions are prone to changes, it's worth looking a bit further into the future — according to the 1 month rating REGENERON PHARMACEUTICALS INC COM STK USD0.001 stock shows the sell signal. See more of REGENERON PHARMACEUTICALS INC COM STK USD0.001 technicals for a more comprehensive analysis.
If you're still not sure, try looking for inspiration in our curated watchlists.
If you're still not sure, try looking for inspiration in our curated watchlists.