Bottom Feeding - Opportunity?Adobe is sitting on two areas of support - an 11 year old trendline and the 0.786 Fibonacci. It looks like it's coiling up in a giant triangle. This is a steadily growing business with a very sticky product suite. Whilst everyone is falling over themselves to buy Figma at $110, I think it's time to
Next report date
—
Report period
—
EPS estimate
—
Revenue estimate
—
15.5 USD
5.56 B USD
21.52 B USD
422.72 M
About Adobe Inc.
Sector
Industry
CEO
Shantanu Narayen
Website
Headquarters
San Jose
Founded
1982
FIGI
BBG00Q99C8L9
Adobe, Inc. is a global technology company, which engages in the provision of digital marketing and media solutions. It operates through the following segments: Digital Media, Digital Experience, and Publishing and Advertising. The Digital Media segment offers products and services that enable individuals, teams, businesses, and enterprises to create, publish, and promote content anywhere and accelerate productivity by transforming view, share, engage with and collaborate on documents and creative content. The Digital Experience segment focuses on integrated platform and set of products, services, and solutions that enable businesses to create, manage, execute, measure, monetize, and optimize customer experiences that span from analytics to commerce. The Publishing and Advertising segment includes legacy products and services that address diverse market opportunities, including eLearning solutions, technical document publishing, web conferencing, document and forms platform, web app development, high-end printing, and Adobe Advertising offerings. The company was founded by Charles M. Geschke and John E. Warnock in December 1982 and is headquartered in San Jose, CA.
Related stocks

ADBE watch $362-364: Key Support zone must hold to end DownTrendADBE was struggling before last earnings and dumping since.
Currently trying to lift out of a significant support at $362-364
Looking for a Break-n-Retest of zone top Genesis fib at $324.26
.

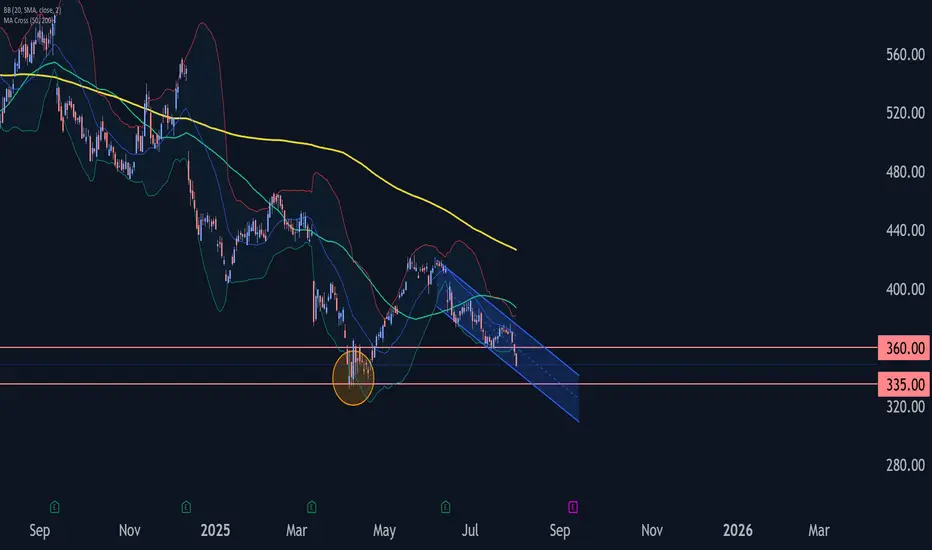
Adobe Wave Analysis – 1 August 2025- Adobe broke the key support level 360.00
- Likely to fall to support level 335.00
Adobe recently broke below the key support level 360.00 (which stopped the previous minor impulse wave i at the start of July).
The breakout of the support level 360.00 accelerated the active impulse wave C of the
Adobe - A gigantic triangle breakout! 🔋Adobe ( NASDAQ:ADBE ) will break the triangle:
🔎Analysis summary:
Yes, for the past five years Adobe has been overall consolidating. But this consolidation was governed by a strong symmetrical triangle pattern. Thus following the underlying uptrend, there is already a higher chance that we w

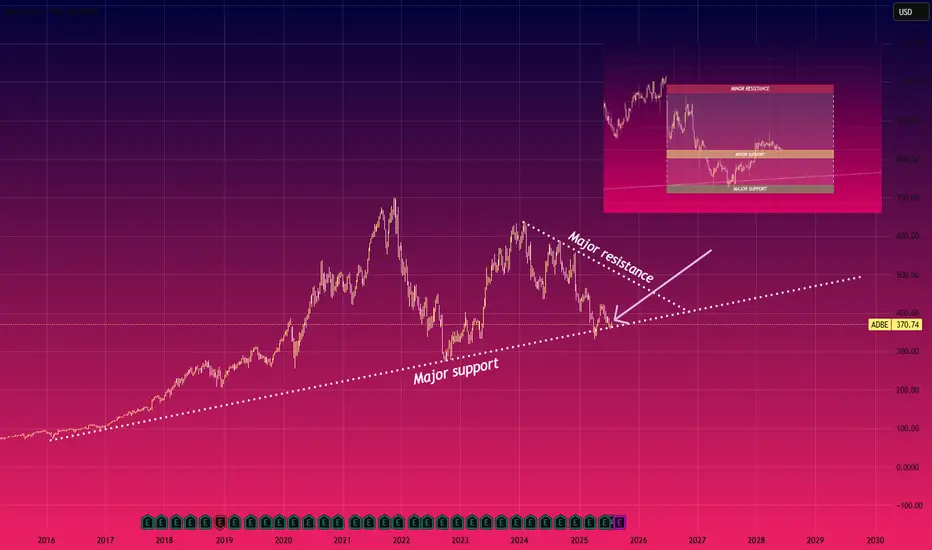
L: Quick Analysis on $NASDAQ:ADBE Support and ResistanceQuick Analysis on NASDAQ:ADBE Support and Resistance
The chart shows NASDAQ:ADBE nearing a major support level around $370, Which has held since 2016, the downward resistance line suggests continued pressure, but a breakout above $400 levels could signal a bullish reversal
Please note this
Adobe Eyes Long-Term Upside from $332.0FenzoFx—ADOBE Inc. (ADBE) formed a hammer candlestick pattern near the ascending trendline at $332.0, suggesting a potential long-term buying opportunity at a discounted price.

ADOBE MONEY SNATCH! High-Reward Long Setup (Police Trap Alert!)🚨 ADOBE HEIST ALERT: Bullish Bank Robbery Plan! (High-Risk, High-Reward Loot) 🚨
🌟 ATTENTION, MARKET PIRATES & MONEY SNATCHERS! 🌟
(Hola! Bonjour! Marhaba! Hallo!)
🔥 THIEF TRADING STRATEGY 🔥 – ADOBE INC. (ADBE) is primed for a bullish heist! Time to steal profits like a pro!
🔓 ENTRY POINT: "BREAK TH

ADBE PUMP soonGood day traders!
As I See ADBE is in leading diagonal wave 1.
Currency, we are in wave correction2
And the price will go in wave 3 which i expect impulse wave the target as shown in chart y←
Good luck for all

The only way is down (Otis Clay, inverted)!NASDAQ:ADBE has been in a steady decline since Sept 24. It jumped prior to earnings in Dec 24, only to get hammered back down immediately after release. Since, it has been a sad show. The trend is down. Price has declined over time, MACD is negative, RSI has crossed negative, price is below 100 and

Adobe Wave Analysis – 18 June 2025- Adobe broke support zone
- Likely to fall to support level 364.90
Adobe recently broke through the support zone located between the support level 392.85 (which stopped wave A at the end of May) and the 61.8% Fibonacci correction of the upward impulse (1) from April.
The breakout of this support

See all ideas
Summarizing what the indicators are suggesting.
Neutral
SellBuy
Strong sellStrong buy
Strong sellSellNeutralBuyStrong buy
Neutral
SellBuy
Strong sellStrong buy
Strong sellSellNeutralBuyStrong buy
Neutral
SellBuy
Strong sellStrong buy
Strong sellSellNeutralBuyStrong buy
An aggregate view of professional's ratings.
Neutral
SellBuy
Strong sellStrong buy
Strong sellSellNeutralBuyStrong buy
Neutral
SellBuy
Strong sellStrong buy
Strong sellSellNeutralBuyStrong buy
Neutral
SellBuy
Strong sellStrong buy
Strong sellSellNeutralBuyStrong buy
Displays a symbol's price movements over previous years to identify recurring trends.
ADBE5981558
Adobe Inc. 5.3% 17-JAN-2035Yield to maturity
4.58%
Maturity date
Jan 17, 2035
ADBE5784629
Adobe Inc. 4.95% 04-APR-2034Yield to maturity
4.58%
Maturity date
Apr 4, 2034
US724PAD1
ADOBE 20/30Yield to maturity
4.50%
Maturity date
Feb 1, 2030
US724PAC3
ADOBE 20/27Yield to maturity
4.23%
Maturity date
Feb 1, 2027
ADBE5981252
Adobe Inc. 4.95% 17-JAN-2030Yield to maturity
4.09%
Maturity date
Jan 17, 2030
ADBE5784440
Adobe Inc. 4.8% 04-APR-2029Yield to maturity
4.01%
Maturity date
Apr 4, 2029
ADBE5784439
Adobe Inc. 4.85% 04-APR-2027Yield to maturity
3.93%
Maturity date
Apr 4, 2027
ADBE5981557
Adobe Inc. 4.75% 17-JAN-2028Yield to maturity
3.91%
Maturity date
Jan 17, 2028
See all 0R2Y bonds
Curated watchlists where 0R2Y is featured.


Frequently Asked Questions
The current price of 0R2Y is 350.5 USD — it has decreased by −2.42% in the past 24 hours. Watch ADOBE INC COM STK USD0.0001 stock price performance more closely on the chart.
Depending on the exchange, the stock ticker may vary. For instance, on LSE exchange ADOBE INC COM STK USD0.0001 stocks are traded under the ticker 0R2Y.
0R2Y stock has fallen by −5.73% compared to the previous week, the month change is a −10.02% fall, over the last year ADOBE INC COM STK USD0.0001 has showed a −36.25% decrease.
We've gathered analysts' opinions on ADOBE INC COM STK USD0.0001 future price: according to them, 0R2Y price has a max estimate of 605.00 USD and a min estimate of 280.00 USD. Watch 0R2Y chart and read a more detailed ADOBE INC COM STK USD0.0001 stock forecast: see what analysts think of ADOBE INC COM STK USD0.0001 and suggest that you do with its stocks.
0R2Y reached its all-time high on Nov 19, 2021 with the price of 699.5 USD, and its all-time low was 181.0 USD and was reached on Jan 16, 2018. View more price dynamics on 0R2Y chart.
See other stocks reaching their highest and lowest prices.
See other stocks reaching their highest and lowest prices.
0R2Y stock is 3.03% volatile and has beta coefficient of 0.96. Track ADOBE INC COM STK USD0.0001 stock price on the chart and check out the list of the most volatile stocks — is ADOBE INC COM STK USD0.0001 there?
Today ADOBE INC COM STK USD0.0001 has the market capitalization of 147.54 B, it has decreased by −2.60% over the last week.
Yes, you can track ADOBE INC COM STK USD0.0001 financials in yearly and quarterly reports right on TradingView.
ADOBE INC COM STK USD0.0001 is going to release the next earnings report on Sep 10, 2025. Keep track of upcoming events with our Earnings Calendar.
0R2Y earnings for the last quarter are 5.06 USD per share, whereas the estimation was 4.97 USD resulting in a 1.75% surprise. The estimated earnings for the next quarter are 5.18 USD per share. See more details about ADOBE INC COM STK USD0.0001 earnings.
ADOBE INC COM STK USD0.0001 revenue for the last quarter amounts to 5.87 B USD, despite the estimated figure of 5.80 B USD. In the next quarter, revenue is expected to reach 5.91 B USD.
0R2Y net income for the last quarter is 1.69 B USD, while the quarter before that showed 1.81 B USD of net income which accounts for −6.63% change. Track more ADOBE INC COM STK USD0.0001 financial stats to get the full picture.
No, 0R2Y doesn't pay any dividends to its shareholders. But don't worry, we've prepared a list of high-dividend stocks for you.
As of Aug 4, 2025, the company has 30.71 K employees. See our rating of the largest employees — is ADOBE INC COM STK USD0.0001 on this list?
EBITDA measures a company's operating performance, its growth signifies an improvement in the efficiency of a company. ADOBE INC COM STK USD0.0001 EBITDA is 9.20 B USD, and current EBITDA margin is 40.74%. See more stats in ADOBE INC COM STK USD0.0001 financial statements.
Like other stocks, 0R2Y shares are traded on stock exchanges, e.g. Nasdaq, Nyse, Euronext, and the easiest way to buy them is through an online stock broker. To do this, you need to open an account and follow a broker's procedures, then start trading. You can trade ADOBE INC COM STK USD0.0001 stock right from TradingView charts — choose your broker and connect to your account.
Investing in stocks requires a comprehensive research: you should carefully study all the available data, e.g. company's financials, related news, and its technical analysis. So ADOBE INC COM STK USD0.0001 technincal analysis shows the strong sell today, and its 1 week rating is strong sell. Since market conditions are prone to changes, it's worth looking a bit further into the future — according to the 1 month rating ADOBE INC COM STK USD0.0001 stock shows the sell signal. See more of ADOBE INC COM STK USD0.0001 technicals for a more comprehensive analysis.
If you're still not sure, try looking for inspiration in our curated watchlists.
If you're still not sure, try looking for inspiration in our curated watchlists.