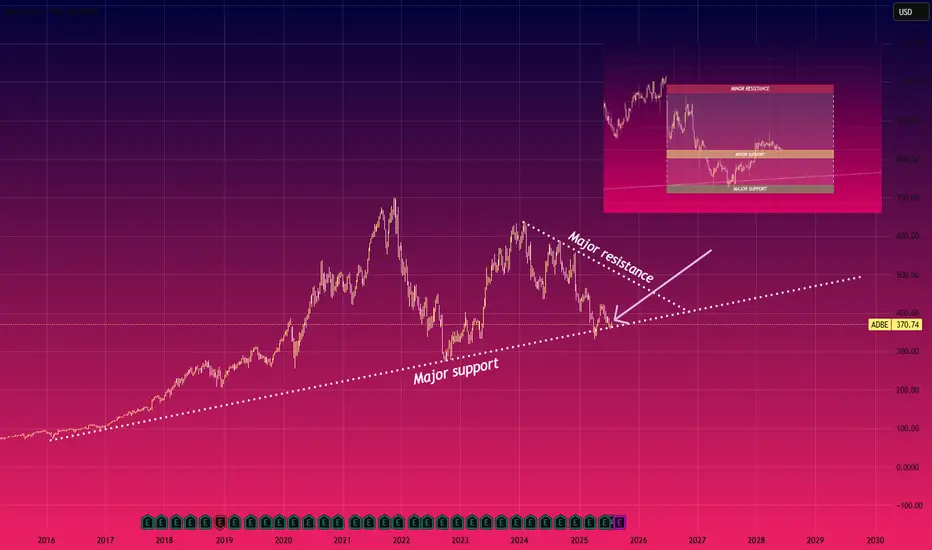
Bottom Feeding - Opportunity?Adobe is sitting on two areas of support - an 11 year old trendline and the 0.786 Fibonacci. It looks like it's coiling up in a giant triangle. This is a steadily growing business with a very sticky product suite. Whilst everyone is falling over themselves to buy Figma at $110, I think it's time to start paying attention to Adobe here.
I believe the AI fear is overdone, if you look at the continued growth in Adobe, their cash flow and continued growth, this is definitely the more compelling buy out of the two. If we lost the trendline support and Fibonacci support, things could indeed get worse.
Not financial advice.
0R2Y trade ideas

ADBE watch $362-364: Key Support zone must hold to end DownTrendADBE was struggling before last earnings and dumping since.
Currently trying to lift out of a significant support at $362-364
Looking for a Break-n-Retest of zone top Genesis fib at $324.26
.

L: Quick Analysis on $NASDAQ:ADBE Support and ResistanceQuick Analysis on NASDAQ:ADBE Support and Resistance
The chart shows NASDAQ:ADBE nearing a major support level around $370, Which has held since 2016, the downward resistance line suggests continued pressure, but a breakout above $400 levels could signal a bullish reversal
Please note this is not financial advice
Adobe - A gigantic triangle breakout! 🔋Adobe ( NASDAQ:ADBE ) will break the triangle:
🔎Analysis summary:
Yes, for the past five years Adobe has been overall consolidating. But this consolidation was governed by a strong symmetrical triangle pattern. Thus following the underlying uptrend, there is already a higher chance that we will see a bullish breakout, followed by a strong rally.
📝Levels to watch:
$400, $700
🙏🏻#LONGTERMVISION
Philip - Swing Trader

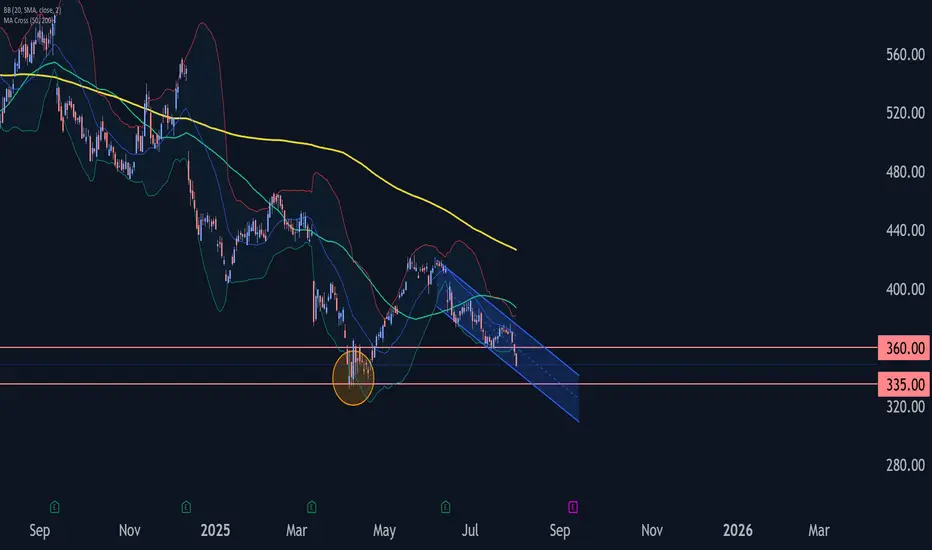
Adobe Wave Analysis – 1 August 2025- Adobe broke the key support level 360.00
- Likely to fall to support level 335.00
Adobe recently broke below the key support level 360.00 (which stopped the previous minor impulse wave i at the start of July).
The breakout of the support level 360.00 accelerated the active impulse wave C of the medium-term ABC correction (2) from the end of May.
Given the strong daily downtrend, Adobe can be expected to fall further to the next support level at 335.00 (the double bottom from April and the target for the completion of the active impulse wave C).
Adobe Eyes Long-Term Upside from $332.0FenzoFx—ADOBE Inc. (ADBE) formed a hammer candlestick pattern near the ascending trendline at $332.0, suggesting a potential long-term buying opportunity at a discounted price.

ADOBE MONEY SNATCH! High-Reward Long Setup (Police Trap Alert!)🚨 ADOBE HEIST ALERT: Bullish Bank Robbery Plan! (High-Risk, High-Reward Loot) 🚨
🌟 ATTENTION, MARKET PIRATES & MONEY SNATCHERS! 🌟
(Hola! Bonjour! Marhaba! Hallo!)
🔥 THIEF TRADING STRATEGY 🔥 – ADOBE INC. (ADBE) is primed for a bullish heist! Time to steal profits like a pro!
🔓 ENTRY POINT: "BREAK THE VAULT!"
"The loot is unguarded!" – Go LONG at any price, but for smarter robbers:
Set Buy Limit orders (15m/30m recent swing levels).
ALERT UP! Don’t miss the heist signal!
🛑 STOP-LOSS: "ESCAPE ROUTE!"
Thief SL: Nearest 2H nearest Swing Low (Adjust based on your risk tolerance & lot size).
Police (Bears) are lurking – Don’t get caught!
🎯 TARGET: 440.00 (OR BAIL BEFORE THE COPS ARRIVE!)
Scalpers: Stick to LONG side only!
Big Bankroll? Charge in! Small stack? Join the swing robbers!
Trailing SL = Your Getaway Car!
📢 WHY ADOBE Inc?
🐂 Bullish momentum + Overbought but greedy!
🚨 High-risk Red Zone – Trend reversal? Police trap? Bears are strong here!
💸 "Take profits & TREAT YOURSELF – You earned this loot!"
📡 STAY SHARP, THIEF!
Fundamentals, News, COT Reports, Geopolitics – CHECK THEM! (Linkkss ☝👉👆👉).
Market shifts FAST! Adapt or get caught holding bags!
⚠️ WARNING: NEWS = VOLATILITY TRAP!
Avoid new trades during news!
Trailing stops = Your bulletproof vest!
💥 BOOST THIS HEIST! 💥
"Like & Boost = Stronger Robbery Crew!"
💰 More boosts = More profit heists! 🚀
Stay tuned… Next heist coming soon! 🏴☠️🤑

ADBE PUMP soonGood day traders!
As I See ADBE is in leading diagonal wave 1.
Currency, we are in wave correction2
And the price will go in wave 3 which i expect impulse wave the target as shown in chart y←
Good luck for all

The only way is down (Otis Clay, inverted)!NASDAQ:ADBE has been in a steady decline since Sept 24. It jumped prior to earnings in Dec 24, only to get hammered back down immediately after release. Since, it has been a sad show. The trend is down. Price has declined over time, MACD is negative, RSI has crossed negative, price is below 100 and 50 EMA. Technical indicators summary is saying Strong Sell, MA is saying Strong Sell. Upside? Investing.com has a fair value of 492.05 which is an upside of 29%. This is only of academic interest. Some might say there is support around $336, but there is not. It is too fragmented. The only "real" support is around $320, but that is also fragmented and not in any way strong. Infact, ADBE does not have any strong support at all, over the last 7-8 years.

Adobe Wave Analysis – 18 June 2025- Adobe broke support zone
- Likely to fall to support level 364.90
Adobe recently broke through the support zone located between the support level 392.85 (which stopped wave A at the end of May) and the 61.8% Fibonacci correction of the upward impulse (1) from April.
The breakout of this support zone continues the active impulse wave C of the intermediate ABC correction (2) from last month.
Given the clear daily downtrend, Adobe can be expected to fall to the next support level at 364.90 (target for the completion of the active impulse wave C).

firefly app is trash; Try it yourself on IOS/Android- NASDAQ:ADBE is bloated company with poor execution and talent density. It is floating around because of legacy tools like pdf, image editing capability.
- With advancement in AI, Adobe has consistently disappointed investors.
- Firefly buzz is overhyped, Tried the app and quality of generated content is the worst. Go and try it yourself.

ADBE Swing Long Possible Long Trade Around Here
Entry around 385 or a bit higher
TP1 435
TP2 450
TP3 479
Stop loss at 352
ADBE: Fractal Pattern Repeating Again?ADBE has printed a surprisingly consistent technical pattern since 2023:
A rejection from supply, followed by a gap-down, then a gradual but deep decline.
We may now be witnessing the early stage of a fourth repeat.
📘 Historical Pattern
Zone 1: ~$575
• Gap: –5.71%
• Drop after gap: –12.11%
• Duration: 49 days
Zone 2: ~$551
• Gap: –8.85%
• Drop after gap: –18.55%
• Duration: 32 days
Zone 3: ~$458
• Gap: –6.71%
• Drop after gap: –18.21%
• Duration: 25 days
Zone 4: ~$425 (current)
• Gap: –2.53%
• Post-gap = in progress
🧠 All three prior moves began with a gap, followed by a small bounce, and then a larger sell-off.
Each of them dropped between –12% and –18% from the post-gap high.
🔍 Current Structure
• Price just rejected from ~$425 (1D supply)
• New gap-down of –2.53% has just occurred
• Currently sitting on critical DCS support zone: $382–$388
This is a high-stakes inflection area. A close below this support could trigger the next leg lower.
⚙️ Options Setup (Bearish Thesis)
💡 Trade Idea: Bear Put Spread (400 / 350, Jul 18 expiry)
• Defined risk with a 2.2:1 reward/risk ratio
• Breakeven ≈ $384
• Thesis becomes actionable if price breaks below the $382 DCS support
• Invalidation: strong reclaim of ~$425 supply
This setup targets a continuation of Adobe’s repeating structure.
It limits downside exposure while offering meaningful reward if breakdown confirms.
🙌 Found this helpful?
If this idea gave you value — a like 👍 or comment 💬 goes a long way!
Follow me for more structured trade setups based on price action + context.
Let’s grow with clarity, not noise. 📊💡

ADBE Earnings Play – Moderately Bullish into AMC (2025-06-11)📈 ADBE Earnings Play – Moderately Bullish into AMC (2025-06-11)
Ticker: NASDAQ:ADBE (Adobe Inc.)
Event: Earnings Report — 🗓 June 12, After Market Close
Bias: ✅ Moderately Bullish | Confidence: 72%
Strategy: Single-leg Call | Expiry: June 13, 2025
🔍 Market & Options Snapshot
• Price: ~$416.06
• Historical Move: ~6.5% avg. post-earnings (5 of 8 quarters up)
• IV Rank: 0.75 — Elevated, with expected 25–30% crush post-release
• Narrative Drivers: AI/Creative segment strength, positive analyst sentiment
• Max Pain: $400 (below current price, but overshadowed by bullish catalysts)
🧠 AI Model Consensus
✅ Bullish Bias (3/4 Models):
Grok/xAI & Llama/Meta: Favor the $420 Call (ask $12.65) for a balanced risk/reward
Gemini/Google: Also bullish, suggests call spread but agrees $420 Call is viable
⚠️ Contrarian (1/4 – DeepSeek):
Flags overbought RSI & IV crush risk
Proposes a deep-OTM $472.50 Call for asymmetric upside (lower conviction)
✅ Recommended Trade Setup
🎯 Direction: CALL
📍 Strike: $420
📅 Expiry: 2025-06-13 (weekly after earnings)
💵 Entry Price: $12.65
🎯 Profit Target: $15.00 (+19%)
🛑 Stop Loss: $10.00 (–21%)
📈 Confidence: 72%
⏰ Entry Timing: Pre-earnings close
📏 Size: 2 contracts (≈2% portfolio risk)
⚠️ Key Risks
IV Crush: If the move disappoints, premium may collapse
Overbought RSI: Short-term pullback risk pre-release
Negative Surprise: Weak guidance could send stock lower
Volatility Whipsaws: Earnings reactions can be choppy—use disciplined stops
💬 Are you playing Adobe this quarter? Calls or skips? Drop your strategy below!

Adobe’s Charts Show Mixed Signals Heading Into EarningsAdobe NASDAQ:ADBE is set to report the firm's fiscal Q2 results on Thursday. What do the software giant’s charts and fundamentals say heading into the report?
Let’s take a look:
Adobe’s Fundamental Analysis
ADBE was one of the original "Cloud Kings" back when the cloud was going to be Big Tech’s Next Great Thing. But as the shift in what's hot for tech firms moves from the cloud to generative AI, Adobe has been trying to evolve.
Wall Street is looking for ADBE to report $4.97 in adjusted earnings per share on $5.8 billion of revenue for fiscal Q2, which ran through May. Compared to the same period a year ago, results like that would amount to 10.9% of earnings growth on 9.2% of revenue gains.
Coming into the quarter, the firm had guided investors and analysts toward $4.95-$5.00 of adjusted EPS on $5.77 billion-$5.82 billion of revenue.
However, 19 of the 26 sell-side analysts that I can find that cover Adobe have cut their earnings estimates since the latest quarter began. (Seven revised their estimates higher.)
And beyond the headline earnings and revenues, some investors will also watch closely for Adobe’s so-called “remaining-performance obligation.” That refers to revenue that the company expects to recognize within the coming 12 months.
That number came in at $19.69 billion during Adobe’s fiscal Q1, of which the firm considered 67% as "current." Wall Street will be watching for whether that number rose or fell in fiscal Q2.
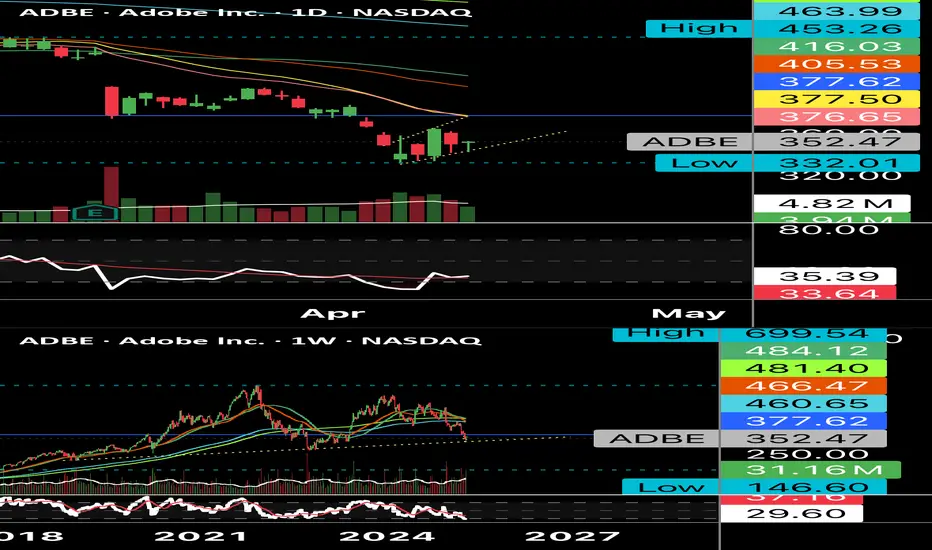
Adobe’s Technical Analysis
Now let’s look at Adobe’s charts, beginning with a 13-month one:
Readers will see that ADBE reacted sharply to a “double-top” pattern of bearish reversal that stretched from June through October 2024, as marked with two red boxes at the above chart’s left.
This pattern peaked in early September, and the stock bottomed out early in this past April.
Adobe has rallied back since then, but appears to have run into some resistance close to the 38.2% Fibonacci retracement level of the early September through early April downtrend. That’s the gray horizontal line third from the bottom in the gray box at the chart’s right.
Now, let's declutter this chart a little and zoom in for a focused look at what's going more recently with the stock:
Looking at this time scale, readers will see that almost all of Adobe’s price action going back to the double-top pattern’s September apex fits very neatly within what we call an “Andrews' Pitchfork” model. (Denoted by the three purple diagonal lines at right.)
ADBE rebounded off of the pitchfork’s lower trendline in early April, then got a boost from what’s called a “mini golden cross” or “swing traders' golden cross” in May. That's when a stock’s 21-day Exponential Moving Average (or “EMA,” marked with a green line above) crosses above its 50-day Simple Moving Average (or “SMA, denoted with a blue line).
However, the stock recently hit a rough patch as it tried to break out from the pitchfork’s upper trendline. That makes the upper line Adobe’s upside pivot for now -- currently at about $408, which ADBE was trading above as of Tuesday afternoon.
If Adobe can definitively find support at that level, the chart doesn’t indicate any significant resistance until the stock reaches its 200-day SMA (the red line above) at about $458.
Looking at our other indicators, Adobe’s Relative Strength Index (the gray line at the chart’s top) looks healthy, but not technically overbought. That's generally a positive.
That said, the stock’s daily Moving Average Convergence Divergence indicator (or “MACD,” marked with black and gold lines and blue bars at the chart’s bottom) isn’t quite as cheery. The histogram of Adobe’s 9-day EMA (marked with blue bars) has gone negative, which can be seen as a short-term bearish signal.
Additionally, the 12-day EMA (the black line above) is wrestling with the 26-day EMA (the gold line) for MACD supremacy. If the black line wins, that's probably good for Adobe’s share price. But if the black line loses, that’s probably bad for the stock.
(Moomoo Technologies Inc. Markets Commentator Stephen “Sarge” Guilfoyle had no position in ADBE at the time of writing this column.)
This article discusses technical analysis, other approaches, including fundamental analysis, may offer very different views. The examples provided are for illustrative purposes only and are not intended to be reflective of the results you can expect to achieve. Specific security charts used are for illustrative purposes only and are not a recommendation, offer to sell, or a solicitation of an offer to buy any security. Past investment performance does not indicate or guarantee future success. Returns will vary, and all investments carry risks, including loss of principal. This content is also not a research report and is not intended to serve as the basis for any investment decision. The information contained in this article does not purport to be a complete description of the securities, markets, or developments referred to in this material.
Moomoo and its affiliates make no representation or warranty as to the article's adequacy, completeness, accuracy or timeliness for any particular purpose of the above content. Furthermore, there is no guarantee that any statements, estimates, price targets, opinions or forecasts provided herein will prove to be correct.
Moomoo is a financial information and trading app offered by Moomoo Technologies Inc. In the U.S., investment products and services on Moomoo are offered by Moomoo Financial Inc., Member FINRA/SIPC.
TradingView is an independent third party not affiliated with Moomoo Financial Inc., Moomoo Technologies Inc., or its affiliates. Moomoo Financial Inc. and its affiliates do not endorse, represent or warrant the completeness and accuracy of the data and information available on the TradingView platform and are not responsible for any services provided by the third-party platform.

ADBE watch $387.21/97: Key Resistance to the Recovery WaveADBE has been struggling to paint a bottom.
Despite what AI could do, revenues not rising.
About to hit major resistance at $387.21-387.97
It is PROBABLE that we get a dip from it.
It is PLAUSIBLE that it will paint a local top.
It is POSSIBLE to Break-n-Retest to continue.
===========================================
.

ADBE – Tactical CALL + Strategic PUT Setup (Pre/Post Earnings PlI'm currently watching Adobe (ADBE) closely ahead of its earnings report scheduled for June 13th. The setup presents a compelling two-phase strategy that aligns with both technical signals and the macro narrative surrounding tech stocks and overinflated expectations around AI.
🔵 Phase 1: Tactical CALL – Pre-Earnings Momentum
We're seeing a familiar pattern emerge — just like NVDA and AVGO, ADBE is being driven upward by heavy AI hype and anticipation. With strong bullish sentiment in social media, institutional interest still present, and a historically reliable "pre-earnings run-up", a short-term CALL trade seems favorable.
CALL Entry: 2–3 days before earnings
Expiration: June 13
Exit: Before earnings release
Target: +20% to +40% gain from bullish anticipation
Risk: Limited due to short duration; no hold through event
🔴 Phase 2: Strategic PUT – Post-Earnings Reversal
Once earnings hit, I expect a sharp reversal, even if the numbers are decent. Here's why:
RSI on daily and 3D charts is near historical extremes
Technical exhaustion signals: divergence, volume fade, upper Bollinger touches
Institutional distribution signs present
The market has priced in perfection – guidance slip or any miss = correction
Macro: high rates, cautious corporate spending, sticky inflation = risk-off sentiment
📊 PUT Setup:
Entry: After earnings release
Strike: Based on $480 breakdown confirmation
Expiration: June 20–28
Target zone: $445–$460
Stop: Above $515 breakout level
🧠 Final Thoughts
This is not just about earnings numbers — it's about unsustainable expectations and institutions likely rotating out after the run. ADBE has rallied on speculation, not fundamentals. My system detects 23 out of 26 bearish criteria being met. If the market reacts negatively, this could be a high-conviction short-term swing opportunity.
📌 Following the script:
✅ CALL before earnings (close before event)
✅ PUT after earnings if confirmation of breakdown
Let’s see how this plays out. Thoughts?
#ADBE #OptionsTrading #EarningsPlay #PutCallStrategy #SwingTrade #AIStocks #Adobe #TradingPlan

ADBE Is Ready to Crab-Walk Down from the Golden Level.The crab of Adobe's stock is poised to tumble from its golden level, ready to dive towards two targets with all the grace of a crab on a slippery slope.
🦀🎯let's see if this crab can swim!

ABOBE it´s still a good buy opportunity.Given the accelerating resurgence in cryptocurrency markets, now is an ideal time to initiate a position in Adobe (ADBE). As blockchain‐based assets and NFTs gain renewed momentum, demand for professional content‐creation and digital‐asset management tools is set to surge. Adobe’s Creative Cloud suite—industry‐standard for graphic design, video editing and web development—is perfectly positioned to capitalize on the influx of creators minting, marketing and trading digital collectibles. Moreover, Adobe’s recent investment in AI‐powered features and its expanding Digital Experience segment enable seamless integration of crypto‐native assets into enterprise workflows. In short, a rising tide in crypto will drive unprecedented content‐creation needs, and Adobe’s robust platform and subscription model make it the optimal way to gain exposure to that secular growth trend.

Adobe Wave Analysis – 19 May 2025
- Adobe broke resistance area
- Likely to rise to resistance level 440.00
Adobe recently broke the resistance area between the resistance level 403.60 (which stopped the previous minor corrective wave iv) and the 50% Fibonacci correction of the downward impulse from February.
The breakout of this resistance zone continues the active minor impulse wave (iii) of the C-wave from the middle of April.
Adobe can be expected to rise to the next resistance level 440.00, which is the target price for the completion of the active impulse wave (iii).

$ADBE $380 Hammer CandleLittle hammer candle on some nicely oversold conditions with my moving average just below the RSI on the Daily. I like this for a $380 test. With a break through you could see $405-$408. Eyeing $380 calls a week or two out.
WSL
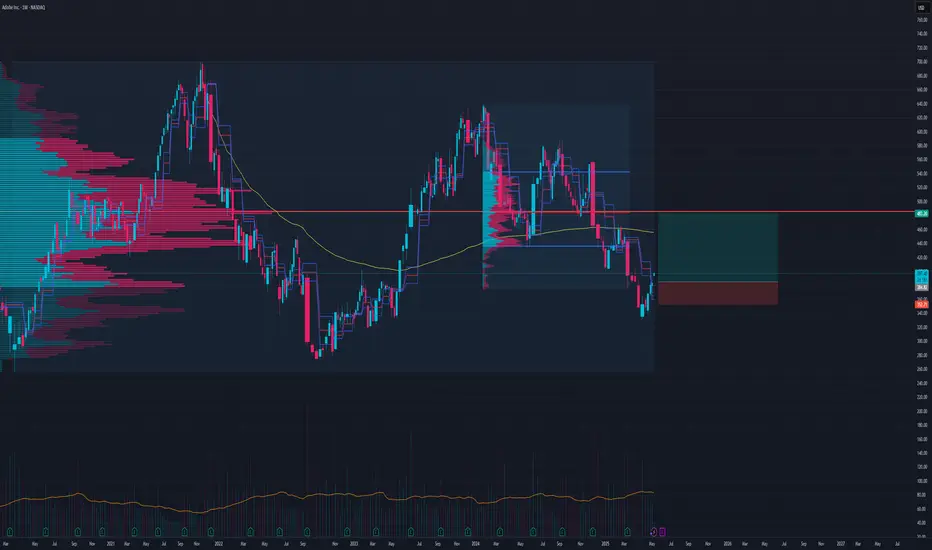
ADBE Chart Breakdown Adobe (ADBE) Chart Breakdown:
Buy around $275-$375 Dollar Levels
Sell|TP: Above $400

Adobe: Keep It Up!Adobe has steadily advanced upward within our beige Target Zone between $331.93 and $449.61, moving away from the low of the beige wave x, which thus gained further confirmation. The stock should soon fight its way out of this zone and head for the resistance at $640. The ongoing wave y should eventually extend significantly above this mark to complete the corrective upward movement of the blue wave (b) there.
