0R2Y trade ideas

$ADBE - patience pays offI do not know if I can hold off too much longer on ADBE
I do think it will take off a bit, but it hasn't made a move for as long as I have thought this.
It held over $500 but on quad witching day, so it doesn't count.
I will be picking up options within the next two weeks
I love the volume from 12/18.


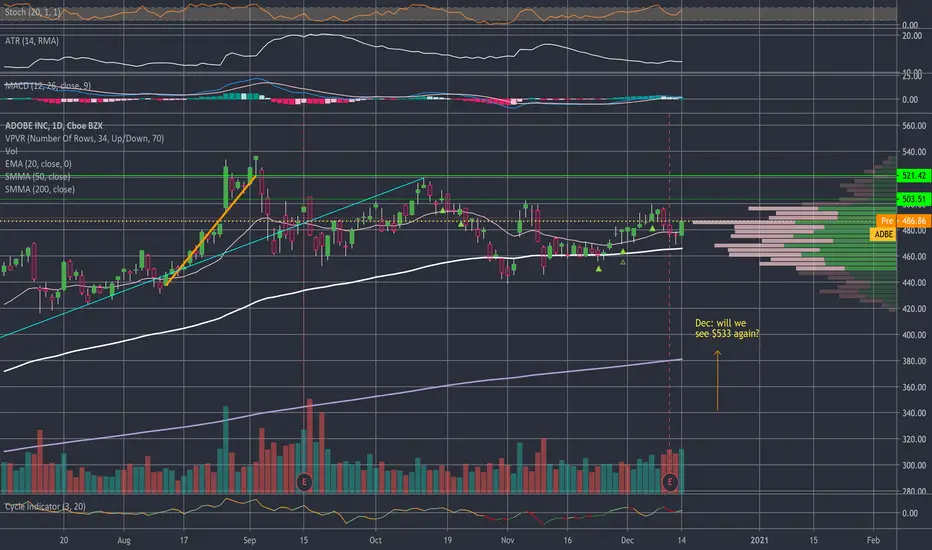
$ADBE Adobe making a Breakout $514 target
Having to post thsi fast so but hopefully the chart tells you all you need to know.
Having been watching the stock yesterday we missed the back test rally today.
Fingers crossed more to come, has been in a considerable consolidation.


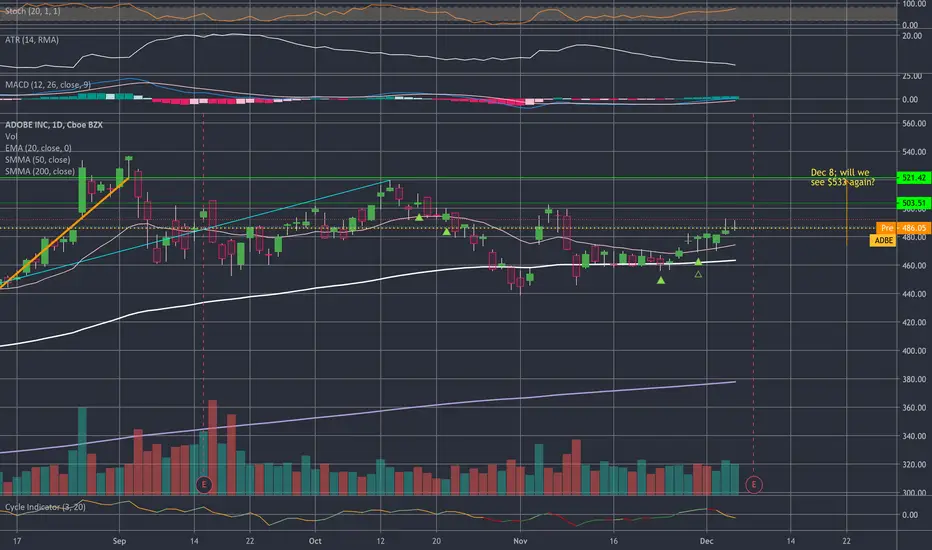
$ADBE - is it your time? $ADBE setting up to potentially make a move if it can break the bag-holder shelf.
Watching for it to get comfortably over $488-$490 for an entry.

$ADBE with a bullish outlook following itse earning release$ADBE is projected with a bullish outlook following a positive over reaction after its earning release as per PEAD placing the stock in Drift B
If you would like to see the Drift for another stock please message us. Also click on the Like Button if this was useful and follow us or join us.

ADBE eyes on 500THis is a great growth name in the tech industry. certainly, one to keep an eye on once we get closer to 500 and some more consolidation.

ADOBE AnalysisBuy order set to execute at $471.65. I expect it to retrace back to uptrend and reverse up.

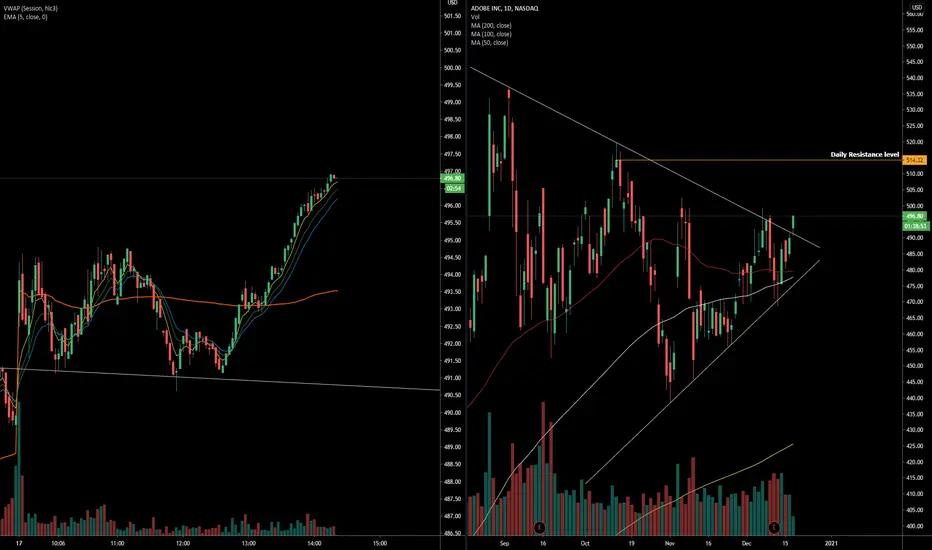
ADBE breaking out of triangle/falling channelADBE breaking out of the triangle and falling channel that it's in. Hopefully it'll retrace and I can get in at $494.50. My risk is the trendline that it's breaking out of.
Looking at the MACD, it looks like it'll continue rising.
I just gotta be careful about EPS tomorrow, but I've also been noticing that people seem to ignore EPS these days.


Holding into earnings Even though we were burned on Salesforce we will roll the dice again with holding our ADBE position

ADBE channel formationLets see when it breaks. 60-70 points target from a convincing breakout from here.

Bearish divergence around earnings?To 470 dip at earnings. If it loses the support channel, it's going Tom Petty.
**Freeeeee Fallinngggggggg**


Adobe right before a flag pattern brakeout?Adobe brakes out of a 3,5 months flag pattern supported by upward trend line and high momentum with RSI > 60.
Storng primary upward trend indicated by upturned SMA200 well distanced to EMA20/50.
EMA20/50 crossover indicates upward turning secondary trend.
Quarterly Report aheat on 09 Dec '20
CRV = 4,97 / Stop Loss at 0.236 FIB / Take Profit at 1.23 FIB

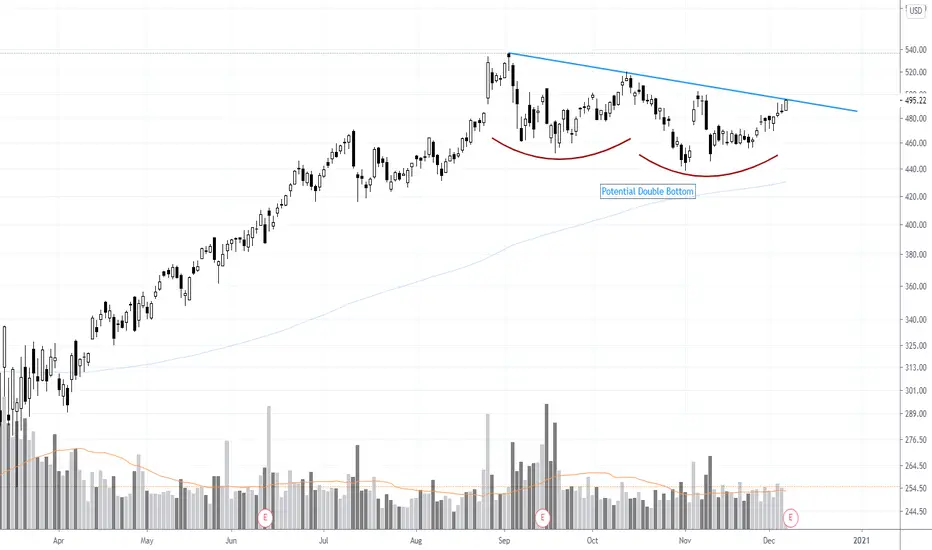
$ADBE potential double bottomAdobe is potentially working on carving a 3 month double bottom chart pattern. The downsloping trend line break could offer an early entry to this setup. Company is reporting earning Wed after the close. Most likely wont take any positions until that's out of the way.
$ADBE - one day playWatch the open, decide if you want to buy the open, sell the close for small 1 day gains.
I do not play through earnings but the technicals look really nice. Trading view says earnings are tomorrow but TOS says its the 9th after the bell so holding more than 1 day seems safe.