CSIQ Reversal PatternI think you will learn something from this video... please watch entire video, all my videos are short ok - you will learn of TON of trading info for free if you want the all overtime
cheers, Rick
0XGH trade ideas

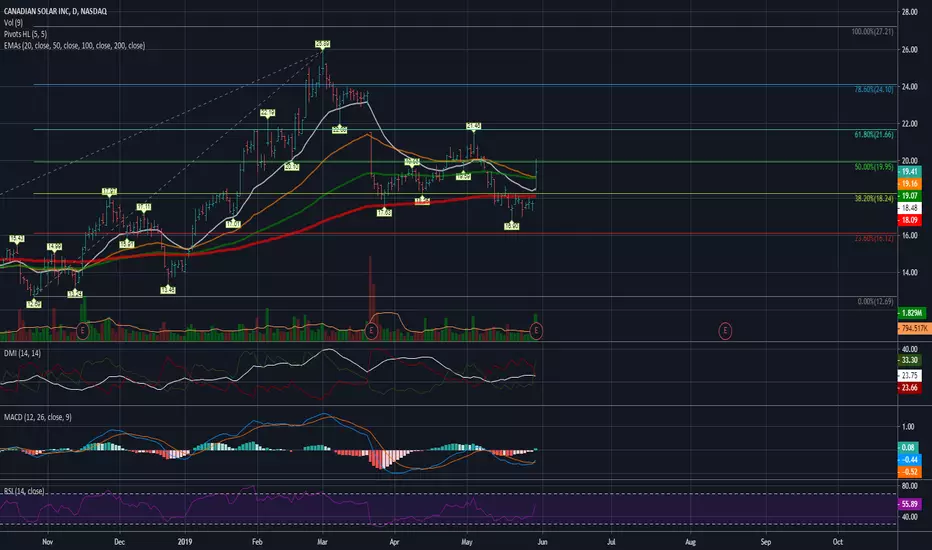
CSIQ, 50-day MA moved above its 200-day MA on July 13, 2020Tickeron AI shows that the price moved above its 50-day Moving Average, which indicates a change from a Downtrend to an Uptrend. In 35 of 48 similar backtested cases where CSIQ's price crossed above its 50-day Moving Average, its price rose further within the subsequent month. The odds of a continued Uptrend are 73%.
CSIQ enters an Uptrend because Momentum Indicator exceeded the 0 level on June 24, 2020
This indicator signals that CSIQ's price has momentum to move higher, since its current price moved above its price 14 days ago. Traders may consider buying the ticker or exploring call options. Tickeron AI shows that in 77 of 92 cases where CSIQ's Momentum Indicator exceeded 0, its price rose further within the subsequent month. The odds of a continued Uptrend are 84%
Current price $23.69 is above $23.60 the highest resistance line found by Tickeron A.I. Throughout the month of 06/10/20 - 07/13/20, the price experienced a +40% Uptrend. During the week of 07/06/20 - 07/13/20, the stock enjoyed a +6% Uptrend growth.

CSIQ LT Buy - Btc, gold and silver updateCanadian Solar is a 3.2 billion dollar company selling at less valuation,,, should be a buy and hold for 5-10 years
In MY OPINION ONLY,,, right
quick update on BTC, GOLD and SLV

$CSIQ looks ok, will look even better soonCSIQ looks to have nice gains ahead of it. My personal target would be about $30 ( check the monthly going back to June of 2008) However, I would not buy here, but instead wait for a pull back to the green support line near $21 ~ $22. Another low floater (45M 5% short)


CSIQ - Swing Trading Stocks with Two Indicators for 1 YearQuick Video swingtrading stocks journal for the CSIQ Stockover a 1 Year period.
During the last 1 year period we have used the tradethefift Roller Coaster and ElliottWave Indicator suites for TradingView to swing Trade the CSIQ Stock.
There were 7 trades in Total and only one loser! In this example we use $1000 risk per trade and the Result is a $7450 profit.
Please watch the short video to learn a little bit more about these strategies.....

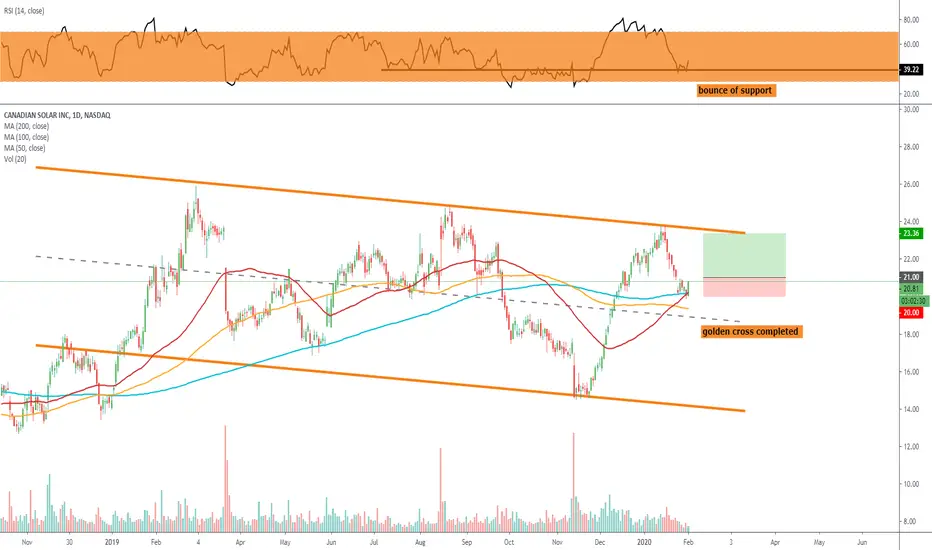
Golden Cross in Canadian SolarPossible entry $21.00 = Target price $23.33 = Stop loss $20.00
Average analysts price target $24.60 | Overweight
Short interest 7%
P/E ratio 6
Canadian Solar, Inc. engages in the manufacture of solar photovoltaic modules and a provider of solar energy solutions. It operates through the Module and System Solutions (MSS), and Energy segments. The MSS segment involves in the design, development, manufacture, and sales of solar power products and solar system kits, and operation and maintenance services. The Energy segment comprises primarily of the development and sale of solar projects, operating solar power projects and the sale of electricity. The company was founded by Shawn Qu in October 2001 and is headquartered in Guelph, Canada.
$CSIQ: Good fundamentals and daily trend signal...$CSIQ has a strong chart here, and good valuation in a very interesting growth industry. The daily chart has a signal here indicating a steep rally is starting, this might end up evolving into a larger timeframe trend, as the quarterly flashes a breakout over time.
I'm looking forward to holding if that is the case, after this daily signal reaches the target.
Cheers,
Ivan Labrie.

Canadian Solar Announces a $150 Million Share Repurchase ProgramCSIQ: Canadian Solar Inc.
2019-12-09 07:00:00
Canadian Solar Announces a $150 Million Share Repurchase Program
CANADIAN SOLAR LONG TERM HOLD I like the TA and the FA even more can buy at 14~ or wait until potential 12~ NASDAQ:CSIQ

Buy and sell opportunityBuy and sell opportunity: wait for a bullish and bearish reversal in buy and sell zones respectively.
Trend analysis:
Monthly - up
Weekly - down
Daily - down (correction)
Hourly - down
Long-term opportunity: buy then sell
Short-term opportunity: -


Short, but long :)Looks like CSIQ still needs some extra correction.
But all the solar stocks are on fire.
Ultimately extremely bullish with the sector.

Bullish IFI'm totally long this stock, but the 21.60 level seems quite relevant and it might define the short term future.
It seems tired, but the solar-stock companies are all on fire.
We'll see.

Good behavior so far.CSIQ has recovered after a great quarterly report.
We´ll see what happens next week.
I´m LONG

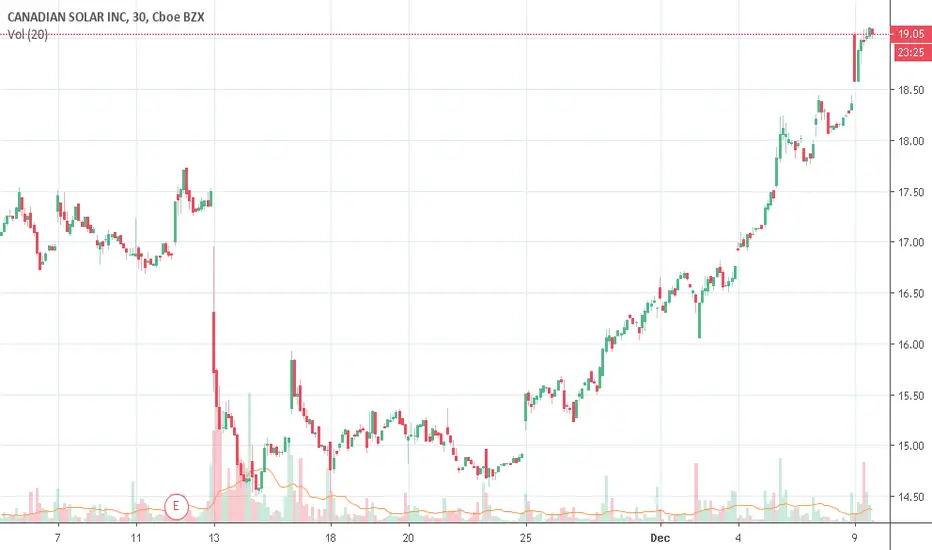
CSIQ Long StockCSIQ had a surprise earnings results and as a result gapped up very strong with the open being the low.
Relative volume was also 2 times the average monthly volume.
Open: 19
Target: 30% shares @ 22 and 70% shares @ 30
Stop Loss: 80% shares @ 17 and 20% shares @ 16
If it consolidates at 21-22 without RSI divergence, I plan to buy more @ 21.
I will not average down.
Time to buyAnother one that is overdone.
200 day moving average should hold
Rebound coming?
I think so.


CSIQPull Back Trading
Price above the cloud ( bullish )
Above 200MA ( bullish )
Buy $19.50
Take Profit $21.00 or/and 21.50
Stop Loss $18.99
Thank You
All comments are welcome

CSIQ: Long opportunityAn intraday high potential, Back Tested Long Analysis.
We ll try to enter into the correction of the uptrend movement.
DETAILS ON THE CHART
NOTE: Entry range area above the entry point, is calculated upon 80% of the recorded pullback back tested past performances
DISCLAIMER: This is a technical analysis study, not an advice or recommendation to invest money on.

CSIQ: Sort opportunityAn intraday high potential, Back Tested Sort Analysis.
We ll try to enter into the correction of the uptrend movement.
DETAILS ON THE CHART
NOTE: Entry range area above the entry point, is calculated upon 80% of the recorded pullback back tested past performances
DISCLAIMER: This is a technical analysis study, not an advice or recommendation to invest money on.

Ok, this Fibonacci guy knew somethingUnbelievably precise.
Trend based fibonacci worked like a charm.
I'm in this for the long run.
Will be 40 bucks in less than 2 years.

Solar Sector Heating Up - Major Break Out in Canadian Solar!The Solar sector has been unloved and in a downtrend for some time. The consensus view on the street is that the industry is commoditized and unprofitable, and therefore on the fast track to ruin. However the charts are telling us the sector is potentially setting up for a positive inflection. Canadian Solar (CSIQ US) had a major breakout last week, and is leading the positive dynamic. It is a great chart on a standalone basis (100% upside potential to previous highs), but other companies are now also looking to follow suit and commonality is growing. Jinkosolar (JKS US) snapped its downtrend and Enphase Energy (ENPH US) is testing major resistance. If these moves follow through, it will increase conviction that there could be a positive inflection taking place at the sector level as well. Invesco Solar ETF (TAN US) is the play for thematic exposure.
