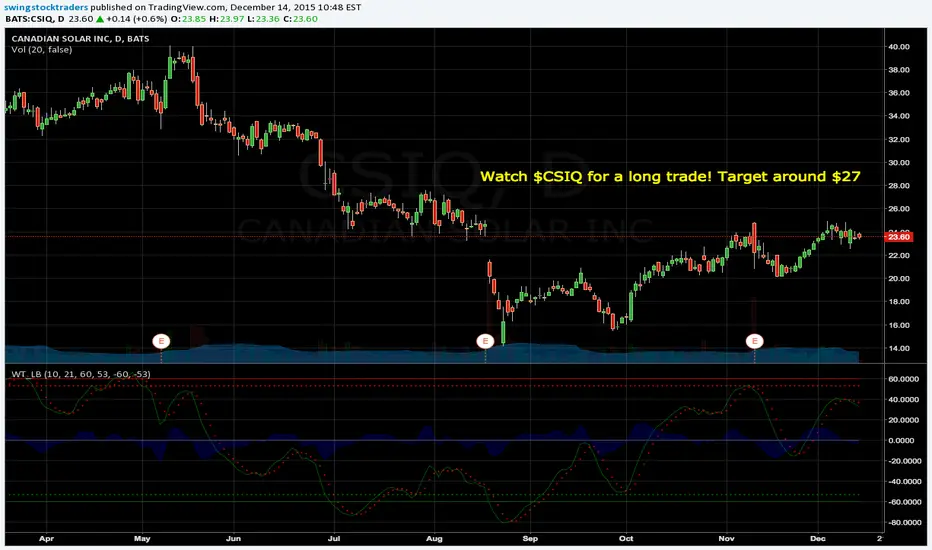
$CSIQ movingWatch this beaten down, undervalued solar stock. Reported great earnings...might now be ready to price that in. Rising steadily. Good play on rising oil.
0XGH trade ideas
UI | Cashflow: 8% on CSIQRETIREMENT ACCOUNT HOLDERS
If you have this stock NASDAQ:CSIQ
Stock screener protocol is good except the earnings date falls on 18th August. Watch over it...
Chart is looking good. Buying low as in next few days, possible cross over of green on red and white MAs.
Aug 16 14.50 call is 1.20 which is 8.0% (unassigned return) and 4.6% (assigned return)
Market Cap ($M): 827
PE Ratio: 6.24
Earnings Date: 8/15/2016

$CSIQ One of the most fundamentally sound solar companies out there. With a 5.76 Forward PE .51 PEG .3 P/S 2.39 P/C looking to initiate 1/2 position now. If flush to 12 range I'll add.

CSIQ Neutral for next 14-30 daysA lot going on here. In synopsis:
Andrew Pitchforks (Large and mini) are showing sideways or downward trends.
Mini H/S showing signs of downward trends.
Fibonacci Support at 16.88, with resistance much higher around 20
Fib Arcs are conforming lower and upper resistance in next few days.
Action Reaction Method agreeing with potential Upward trend in the near future.
Predictions:
4/11: Upward gains up to 17.7 (+2.75%)
4/12-4/22: Swing up or Swing down (IMO: Down, with a potential rally from B to 4)
(MACD, RSI, and Stoch all confirm)


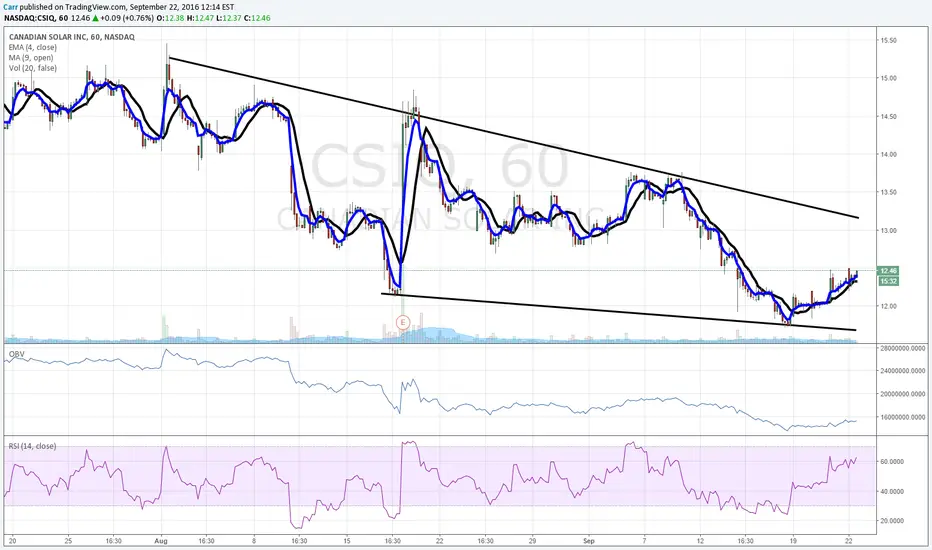
Critical sessions ahead for the CSIQDespite better than expected EPS announced yesterday, price action was bearish as price is being rejected once again at the upper trend line resistance and the bullish flag breakout pattern does not get a confirmation. The only positive signal is the fact that the weekly candle touched cloud support and bounced. Unless bulls see a push above 36$ over the next few sessions, stock price will be vulnerable to a deep pull back.
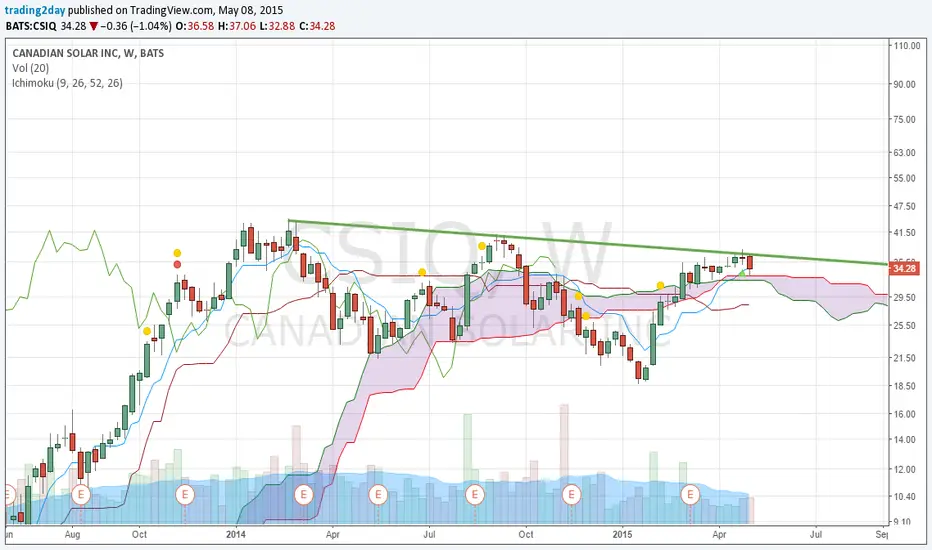
Bullish flag breakoutThe weekly chart in CSIQ is a bullish flag. Current price action shows that price is near breaking out above the flag. Conservative target is 50-55$ while an equal leg upward to the previous upward move can bring the share price towards 60$. The sideways consolidation in CSIQ is most probably over. Short-term support at 35$ and at 33$. A break below these levels could signal a fake breakout and a reversal could bring price towards 26$-28$.


CSIQ- Gosh Is That A Double Top Brewing?4-17 Gosh looking a bit like a Double Top
that's ready to break its uptrend (green)
if you ask me. But for now? Its intact.
I'm sure we'll find out next week.
Feel free to follow on TWTR at
@AmazingPatterns
For informational and educational
purposes only, these are not
recommendations, trade at your own risk.

CSIQ Day Trade Gap N Go (Brad Reed Mar5,2014)CSIQ expected to open at 31.48 for a Gap N Go. To learn to trade this strategy for free go to www.RealLifeTrading.com

CSIQDidn't quite hit target, but nice enough. Nearing the .50 retrace. See how it handles or if it it blows right through to the .618.


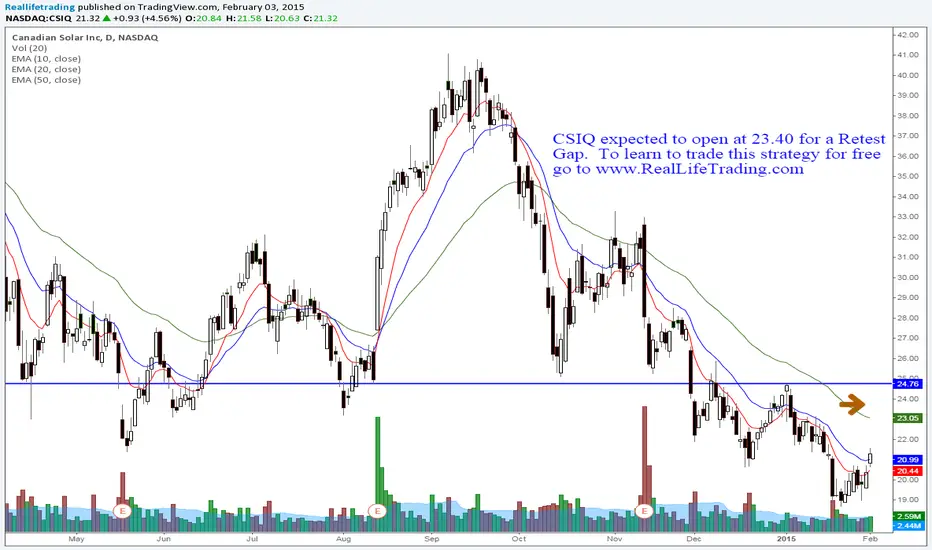
CSIQ Day Trade Retest Gap (Brad Reed Feb3,2015)CSIQ expected to open at 23.40 for a Retest Gap. To learn to trade this strategy for free go to www.RealLifeTrading.com
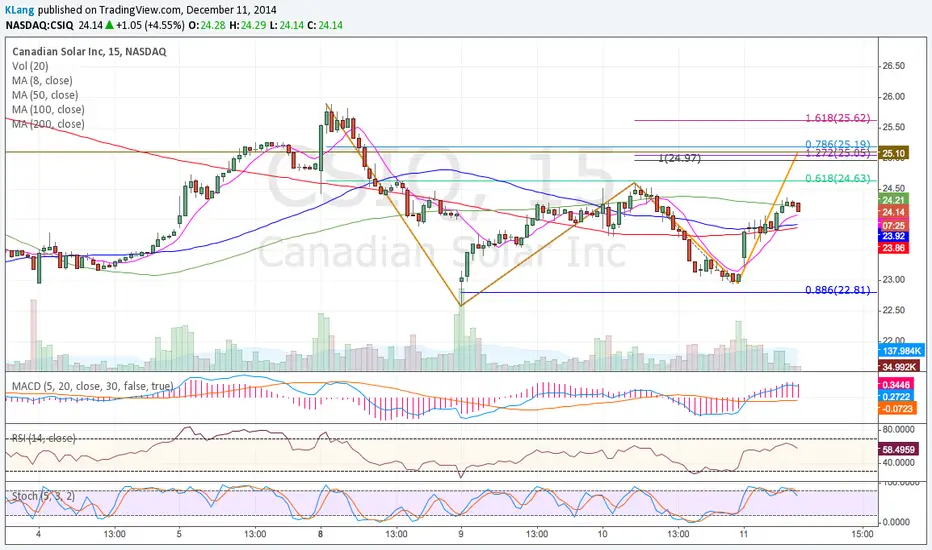
CSIQCOULD be a Gartley here. But has to get over the .618 to believe it. I do still think lower based on the weekly chart posted previously


Scary Head and Shoulder's TopEnd of last year and and early of this year price peaked and printed what looked like double top bearish pattern with measured target of 42% drop hard to believe at the time, but in a few months that measured target price was hit, and now price is forming what looks like another bearish pattern but not that strong unless we see a decisive breakdown from the neckline this bearish pattern is predicting a possible drop of at least 40-50% from $27 level. But Friday's price resurgence is a little bit of concern.Though market may finally be giving hints of a bullish resurgence, it is worth mentioning the piercing bullish pattern. If you want to take a short position watch $30 for clue or trigger if it goes below 26.00 with target price 20.24/15.38 with stop loss at 30.50. Do your homework before you take any position and see if it fits your investment style. if you need real time alert try us www.2waytrading.com

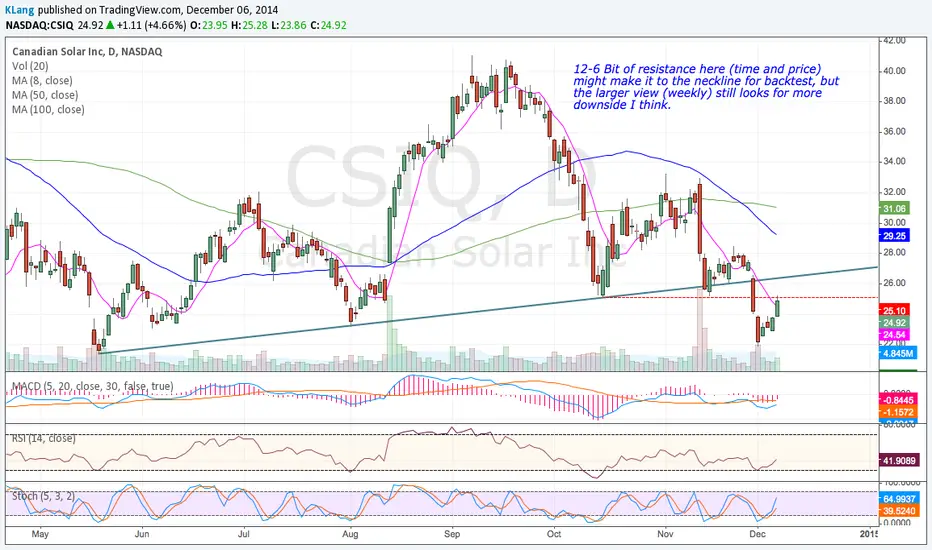
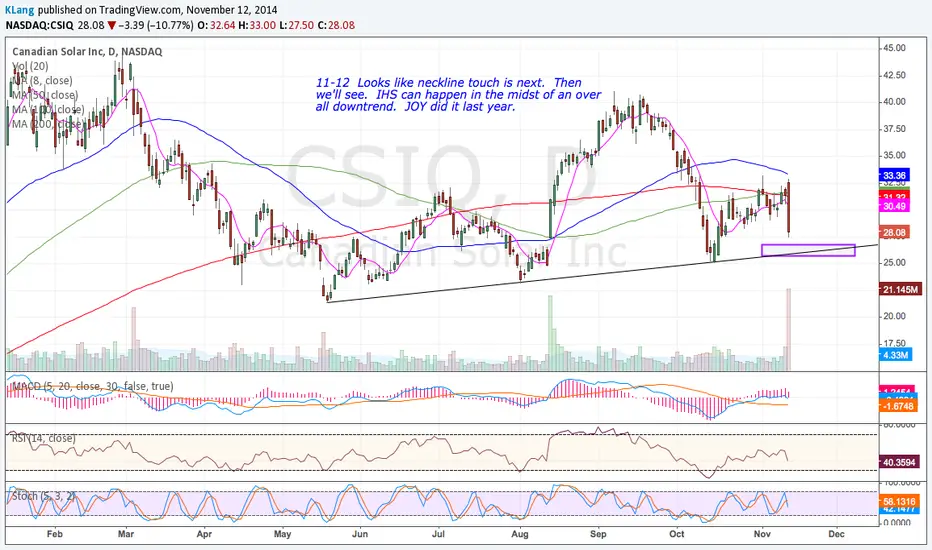
CSIQLooks like a HS shoulders is developing and neckline looks to be the next target. Can a HS work in a longer term d/t? One did in JOY last year.
CSIQ - My pick of the week. Pullback
Status: Watching
Technicals:
Horizontal S&R: yes
Channel S&R: yes
MA S&R: yes
Pearson's R >= 85: yes
Price within Fib Ret..62: yes
Stochastic turn/crossover above 80%: yes
AO pullback >0<1.38: yes
Fundamentals:
IBD EPS Rating: 78
IBD SMR Rating: B
