GREATLAND GOLD STILL UNDER PRESSURE...Here I show the larger 'Broadening Bottom' Plot. As we have moved deeper along the Lower-Line of the smaller 'Broadening' Pattern I showed prior.
Hope for us bulls here is a cessation of declines at the 62/Fib level. Especially as we also have adequate touches of the Upper & Lower Bands of the Pattern. We also have the jump from the Down/Trend Channel (With Measured Move Targets from that Channel shown in Green).
Following its recovery we see for the first time a Back/Test of that 2-Day 150/MA & Channel Break/Out level, with a Bull 'Wedge' formed in the process. Yet we need to see a reversal pronto, as losing that 150/MA would be a gut-punch.
Targets for the 'Broadening' Plot are in yellow...
GGP trade ideas

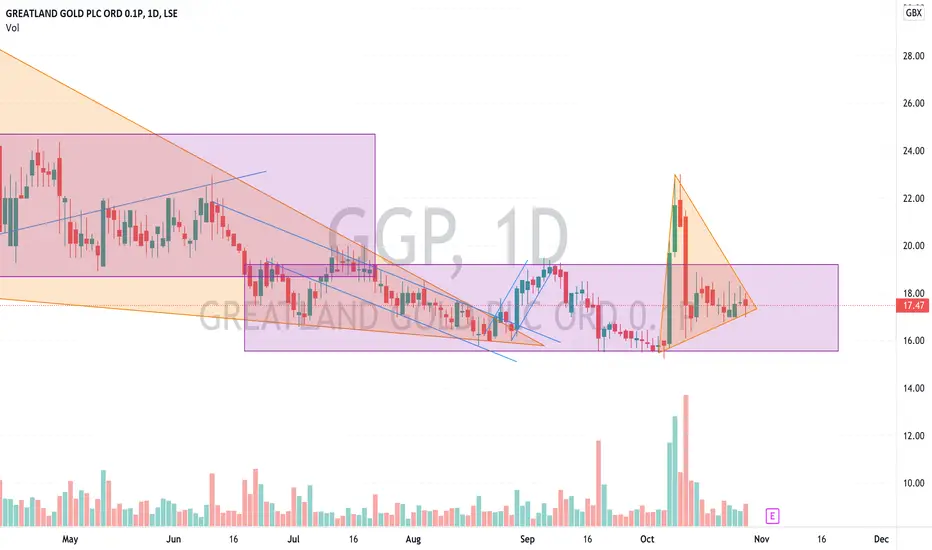
GREATLAND GOLD STILL UNDER PRESSURE...Recall I was looking for a cessation of the a-b-c correction at the 38/50 Fibs. However, despite a bullish Havieron MRE (Mineral Resource Estimate) it has dropped lwr. I have adjusted the 'Broadening' Plots lwr-line and added the count for the c-wave.
Having overthrown that 'Broadenings' Lwr-Line which I mentioned would be a possibility it has now brought price within the 50/62 Fibs. Resulting in it positioned upon several key/Ma's on varying timeframes along with a potential completed wave-count give or take a few points.
If indeed we do have an Overthrow of the 'Broadening' Plot we should see an imminent reversal, which I would expect to pulse vigorously upwards as it being the start of Wave- (3)??

$GGP GREATLAND GOLD LOOKING GREAT IIIRecall I was hoping for a 'Running Flat' Correction after the 5-Wave advance, yet now that Wave-a has been breached I am looking for an 'Expanded Flat' Correction here. It may overshoot the Lwr-Line of the 'Broadening' Plot to fill out the 38-50/Fib Level and quickly recover. Failure to do so will target the 62/Fib.

GREATLAND GOLD LOOKING GREAT Part IIAfter a nice run am looking for a Wave- (ii) Correction and would love to see it as a 'Running Flat' a-b-c...

GREATLAND GOLD LOOKING GREAT...Pushing up through the Ctr-Band with gusto. Also Poppin a 'Broadening' Bottoming Plot. If it holds this B/Out it will aim for my arrowed Targets.

GGP Deep DiveHere's a macro macro (1 week chart) deep dive on GGP:
- No fundamentals here, just looking at the chart zoomed way out.
- Price bounced from the 0.786 fibonacci retracement (1 week chart). A good place for an entry, but only in hindsight now.
- Looking for this level to hold ~ 9.44, and on the lower time frames it looks as though price action is trying to form a swing higher low ~10.00.
- One might want to take an entry here in the hope that this higher low plays out and we get a reversal. But we need to go to lower time frames though as to whether or not here would be good for an entry.
- There is an overhead diagonal resistance also, blue line, which is something to keep an eye on.
- Also there is clear resistance, dead centre on the RSI, which makes sense as that price action has been bearish and therefore RSI oscillating below ~50. It would be interesting to see that resistance broken down and for price action to break above the 50 line.
1 hour and 4 hour:
- The price action and ichimoku cloud indicator shows that price action is bearish. On the 1 hour there is even a bear flag forming.
If i was in a position here:
- I would feel that I might have weathered most of the down move, and a relief rally to the upside was on the cards.
If i was taking a position here, 2 options:
(1) take an entry here, and hope the higher low plays out. A stop-loss would sit below, 9.44 (and as such, your price target should reflect this in its risk/reward ratio.
(2) wait for confirmation of an entry on the lower time frames. This might look like a bullish divergence on the 4 hour, or price action unfolding long enough sideways, that you get price action and the lagging span (ichimoku) both above the cloud on the 1 hour (and for a better quality trade) the 4 hour.
Price targets
- On a quick glance, the most immediate price target for me would be 12.82, then 15.32 after that.

GGP what next?GGP out of triangle but needs to break consolidation
Opportunity of increased price supported by solid chart position
Hit resistance and couldn't break through
No advice given but im certain this is a secure price to buy in at
No advice\!!

ggp latest ideavery consistent with previous triangles drawn
will it pop up?
im long
no advice given

GGP is the it ? all comments welcomeis GGP converging in the mother of all triangles?
not advice but maybe at 13 is breaks out significantly???

GGP more good results tonightGGP chart looks ready at some point to go
no advice given
sometimes the natural look of the chart gives confidence
GGP support and resistance at every 0.5p in this rangejust an idea no advice given
lets see whether buyers are dominant in near term

GGP long term chartNot an idea just playing around
No advice given
triangle after triangle
perfect head and shoulders in 2018

GGP broken the triangleGGP not really a fully fledged idea but has broken the downtrend triangle
in a narrow uptrend channel and interesting to see if it drifts with previous consolidation zone
time will tell
no advice given

GGP downward trend but triangle breakout??GGP chart
no advice given
downward trend but long term triangle breakout may be on the cards

GGP is it the mother of all triangles? GGP is it a mage breakout on the cards?
I have only an idea
no advice given


GGP in ascending channelConsoldation zone still strong
but narrow ascending channel at bottom and parallel to broader long term ascending channel
still needs to break consolidation zone to really be on the move
strong support

GGP consolidation still strong but ascending channel still validNO ADVICE GIVEN
recovered back into ascending channel and consolidation zone bottom confirmed - no changes to previous chart


#GGP end of recent descending channel within consolidation zoneStill consolidating and forming strong support, end of recent mini descending channel (within consolidation range)
NO ADVICE GIVEN but personally I'm long

