MNDI trade ideas


Mondi failed to break lowerJSE:MNP has been trading in an upward trend since mid-March. It failed to make a lower low after the latest retracement and formed a hammer doji candle which is a bullish reversal signal. We are potentially looking at a continuation of the upward move.

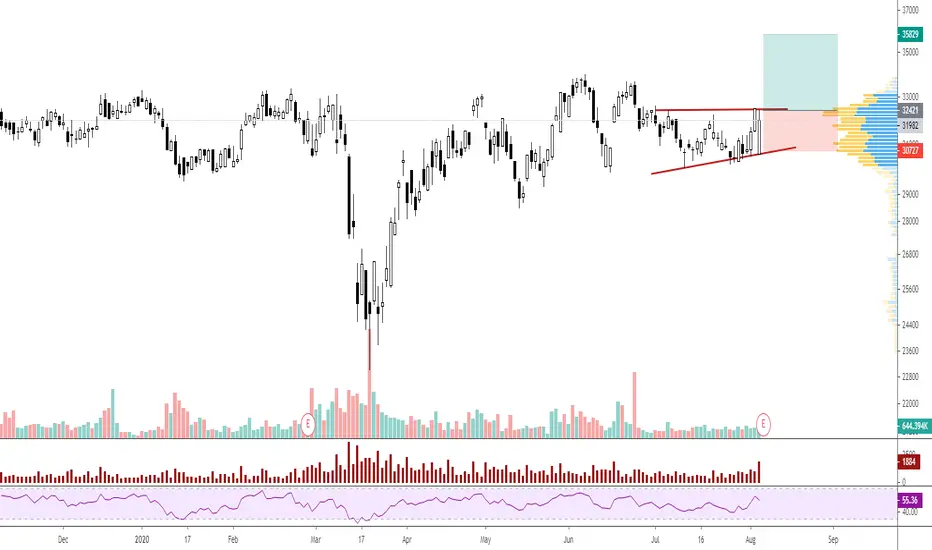
Possible ascending triangle breakout imminent on MNPJSE:MNP looks like it could be breaking out of a symmetrical triangle chart pattern very soon.
My sentiment is that it will most likely break downwards, as the resistance level at the top of the triangle is very strong and has been intact since mid April. Once it breaks and closes below the level of the triangle I will consider a short.


Inverted H&S forming on Mondi PLCJSE:MNP is in the process of forming an inverted head and shoulders pattern on the day chart.
We could see a longer term upward move if the price breaks through the neckline at around the 33100 level. This might take a few days before it breaks this level, so I am just keeping an eye on it for now.

MONDI - Breakout of longterm range- Price has broken down from a longterm trading range and share seems to be following the rest of the market now
- Likely target of R175 zone
-- MANAGE YOUR RISK - -
Disclaimer: All ideas are my opinion and should not be taken as financial advice.

MNPAs per our long term technical analysis note on 04-February 2020 it appears that the long term bear trend has begun. It should be noted that the MNP’s Relative Strength Index has now shifted into a weakening trend, and is trending lower with a 40 print, the lowest level since 2009. I don’t believe this means it is oversold, rather that it is a long term weakening trend.
In the short term, the rounding top pattern we highlighted last week has broken down as in a mirror image of the period seen from May to August 2019.
For traders looking at a short term rebound opportunity, the 250-245 level potentially offers a short term support zone.

$JSEMNPJSE:MNP
Developed falling wedge from December 2018 to Novembr 2019. At the begining for November 2019 broke above with projected target in the zone between 38000/38500
In mean time it went down and back tested falling wedge in January 2020.
There is smaller cup and handle pattern that developed over last two months. Target for that pattern is around 37000.
If $JSEMPN breaks above 33250/33300 and close above cup and handle will confirm and first target around 37000 will be in play.
Second target should be falling wedge projections around 38000/38500 area.

MNPI am buying here based on the previous demand, where buyers came in, which also is a shoulder for upside down head and shoulders pattern. Also based on Fibonacci retracement levels, we have just hit the 61.8% Fib Retracement zone. Target is 61.80 zone


MONDI at ResistanceJSE:MNP has reached quite a significant resistance zone and we could possibly see a turnaround for a short position. The stochastic looks like it might be turning too which is a further signal.
If it doesnt break thorugh this level and confirms, I will consider a short position.

$JSE-MNPJSE:MNP
Breaking above falling wedge today, wait for conformation to go long or even better pull back.

Not looking good for MondiLast weeks weekly showed clear rejection and we seemed to have tested the kijun. If this is true we should see a continuation of this downside movement this coming week. Short term target being 27498 and longer term, the monthly flat kijun level of 24912.
Entry: sell on daily close below 28982
SL: 31256
TP1: 27498
TP2 : 24912
Did i mention that risk management is king in trading?!. . . .risk half of what your mentor said you should risk:)


$JSEMNP WEEKLYMondi WEEKLY has rebounded of strong WEEKLY SUPPORT and has broken through the downtrend RESISTANCE. First target is around R322


$JSEMNP DAILYMondi has got back into its short term DAILY range and may now test the top of it around R297.50
