SBIA trade ideas


Bullish in SBI AT 465I am Bullish in SBI at 465 , stop loss 462 , Target 472.
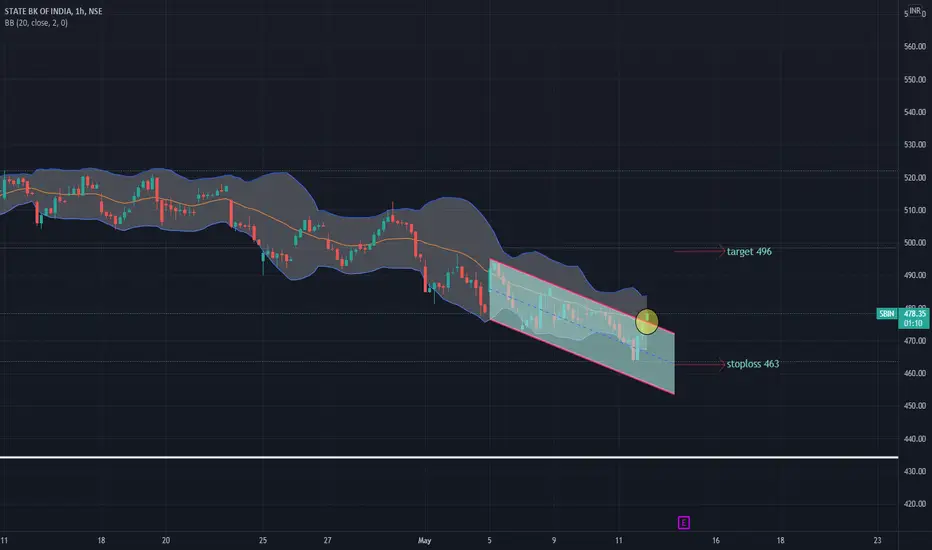
Seeing some trends i think there will be a bull move.
Note- Not a trading or investment advise. Always consult your broker or financial expert before trading or investment decisions.

SBI looks ready to give a breakdown.Weekly and daily triple top formation along with a small double top pullback with weak banknifty sentiments just makes this trade perfect. LMK if my analysis is right ;). Short term if the trend line is broken then an imp fib level is also broken but once 440- 434 levels are broken im expecting some good downfall
Regards
HASB

SBI India Sun Storm Investment Trading Desk & NexGen Wealth Management Service Present's: SSITD & NexGen Portfolio of the Week Series
Focus: Worldwide
By Sun Storm Investment Research & NexGen Wealth Management Service
A Profit & Solutions Strategy & Research
Trading | Investment | Stocks | ETF | Mutual Funds | Crypto | Bonds | Options | Dividend | Futures |
USA | Canada | UK | Germany | France | Italy | Rest of Europe | Mexico | India
Disclaimer: Sun Storm Investment and NexGen are not registered financial advisors, so please do your own research before trading & investing anything. This is information is for only research purposes not for actual trading & investing decision.
#debadipb #profitsolutions

BULLISHIn the loving memory of my child Muffin I present you this chart analysis... ...please take trade after strong candle pattern confirmation or rejection from support/resistance ...if my chart analysis helps you and makes you smile then please do " LIKE" ... it will help me a lot and encourage me to do more hard work in chart fundamental and technical analysis ...
you can ask me any thing in comment section I will reply 100 %


SBINSBIN broke out of triangle pattern n is comfortable trading above it on an hourly charts.
Could be bought with mentioned stoploss & targets.

head and shoulders in sbihead and shoulders in sbi, we can expect downfall from here a minimum of 100 rs as first downfall target as per pattern

STATE BK OF INDIA Daily VERTICAL DOTTED LINE is Ultra high volume down bar
Higher volume-Professionals are buying into the public sellin
CONFLUENCE OF 2 Bulllish Patterns Strong zone BAT & Crab
Earlier this Pattern given good reaction on BAT Type1 entry & both target hit now price again came into PRZ Zone of Pattern it becomes a TYPE2 Entry which is REVERSAL and formation of another BULLISH CRAB making it as STRONG POTENTIAL REVERSAL ZONE
price need to follow Green Trend line & hit target
If price Breaks Red Trend line is where EXIT before SL hits
POTENTIAL BUY

SBI do or dieTrading near important support.
Breaking below 444 will trigger some selling that can drag sbi till 400.
400 level is good support to go long.
On the flip side if managed to close above 450 will take it up to 500.

SBINSBIN broke out of parrallel channel on an hourly chart with very good volumes.
Could be bought with mentioned stop-loss & targets
SBI weekly chart double bottom what next Can any one say what next sbi showing double bottom in weekly chart

SBIN FORCAST : SELL- on the weekly chart :a clear selling signal in last week's candle
- on the daily chart : big red candle shows the presence of an important selling pressure
- personal opinion : the price will fluctuat a little but settle on a down trend
- best move : SELL

SBI Clear Head & Shoulder PatternRight now SBI is having a clear resistant line where it is making the head and shoulder pattern which is going in the right direction. So do your analysis and enter the trade.

SBINSbin made bullish butterfly pattern on an hourly chart with decent volumes & mammoth OI in 500 CE & trading above 500 hints at massive short covering.
Could be bought with mentioned stoploss & targets.
SBI 500 CE cmp 20 stoploss 17.20 target 25.

SBIN | Good Short Opportunity.When it comes to the technical analysis of SBIN, you might get an impulse to the downside. Based on my technical analysis, you might see a fall to the downside. If you are going in, better find a pullback. I have marked a good entry area on the chart; you may use it as an entry area. And also don't forget to place the stop just above the entry area.
What do you think is more likely to happen? Please share your thoughts in comment section. And also give a thumbs up if you find this idea helpful. Any feedback & suggestions would help in further improving the analysis.
If you find this technical analysis useful, please like & share our ideas with the community.
Good Luck!
Disclaimer!
This post does not provide financial advice. It is for educational purposes only! You can use the information from the post to make your own trading plan for the market. But you must do your own research and use it as the priority. Trading is risky, and it is not suitable for everyone. Only you can be responsible for your trading.

Simple Trade Setup | SBIN | 18-04-2022 [INTRADAY]NSE:SBIN
Trade Setup for 18-04-2022
1) Don't Jump in to trade at the beginning of the market. Let it get settle for 15-20min first and judge the price action.
2) Everything is mentioned on the chart. I hope it is easy to understand.
3) All the levels will work as support, resistance, entry and exit w.r.t price action near that level.
4) Avoid gap up or gap down chase. Wait and trade between levels.
Please refer below chart for levels.
Hope I made it easy to understand it.
Do comment your doubt or suggestion.
Note: Trade with Strict SL. It may or may not hit all the levels. So one can book profit / loss at respective level considering how price action works near that level.

State Bank of India - Long opportunityA retrace on the daily chart appears possible on the cards, but eventually price may attempt to reach the marked levels on the chart. My view is based on Fibonacci levels. Let's see.

SBIN buy or intraday tradingSBIN buy or intraday trading if stock and BANKNIFTY also strong then we will buy the stock.........

sbinSBI is trading @ multi month suppport area of 430, SBI broke out of this level of 435 in september 2021 & made new highs thereafter.
Could be bought with mentioned stoploss & targets.


