SBIA trade ideas

SBIN (NSE) - Elliott wave analysisWelcome guys,
CycleWave is the top author sharing trade ideas based on EW analysis since last five months on the global stocks, currency pairs, cryptos, future indices and commodities. You can follow us to get more trade ideas/analysis.
SBIN (NSE) - It dropeed in double zigzag down and going up in ABC zigzag, which is having two probability as either C will gets extension or choppy down price action. So wait for more price action to get more direction. At least common down price action expected up to 186.50 from 191.
Give thumbs up if you really like the trade idea.


SBIN head and shoulders on hourly chart - SHORTThis idea is for educational purposes only. Head and shoulders pattern forming on SBIN. The last hourly candle had a relatively long body and volume was above average trading volume at that point. Looks a short candidate.

OUT COME OF PRICE WHEN APPROACHES THE RESISTANCE (BREAKOUT)OUT COME OF PRICE WHEN APPROACHES THE RESISTANCE (BREAKOUT)

SBIN 45MNBullish BAT + RSI DIVERGENCE
Ultra high volume down bars - trap of Smart Money , Higher volume-Professionals are buying into the public selling
ULTRA HIGH VOLUME for going LONG we need LOW VOLUMES in the area of ULTRA HIGH VOLUME BAR
Horizontal BLACK DOTTED lines r High & Low of ULTRA HIGH Volume CANDLEVertical dotted line is ULTRA HIGH VOLUME i.e SMART MONEY Price on breaking of ULTRA HIGH VOLUME Candle HIGH with NO SUPPLY i.e place for BUY
Potential Buy

SBIN 1HRBullish BAT + RSI DIVERGENCE
Ultra high volume down bars - trap of Smart Money , Higher volume-Professionals are buying into the public selling
ULTRA HIGH VOLUME for going LONG we need LOW VOLUMES in the area of ULTRA HIGH VOLUME BAR
Vertical dotted line is ULTRA HIGH VOLUME i.e SMART MONEY .Price on breaking of ULTRA HIGH VOLUME Candle HIGH with NO SUPPLY i.e place for BUY
Potential Buy

SBI SHORT- forming a descending triangle on 1hr timeframe
- if selling pressure continues in bank nifty than sbi can breakdown from 195 further to 192 and even 189, which is acting as next support

Short for next 5 days onlyIf we see chart sbin going for down more 05 to 10pts because its forms H&S Pattern.
Target 195 and SL 203 for next expiry...


18 ) LOOKING BULLISH @BUY AT - 204 , S L - 192Long term survival is a more important thing to consider in trading than short term profitability

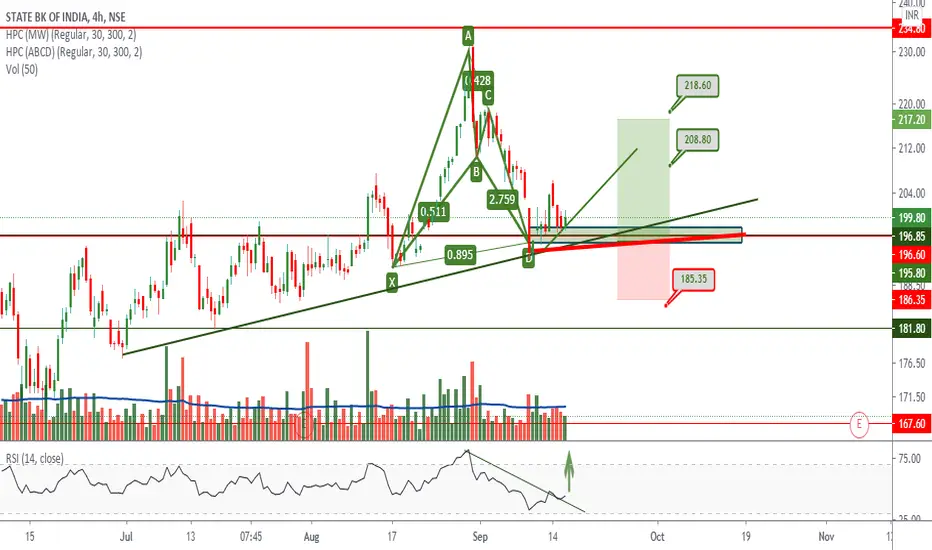
SBIN 4HRBULLISH BAT FORMED AT MAJOR Daily & 4HR SUPPORT & at TREND LINE SUPPORT So strong potential reversal zone
price need to follow Green Trend line & hit target
If price Breaks Red Trend line is where EXIT before SL hits
POTENTIAL BUY
BUY @ 195 above Target 211,228,243 for short Term SL 191As per Chart Analysis, Its seems uptrend as well as it will complete Mpatterm as i have drawn in pic...
If we see Technically,Last Result good and recently 10Kcr. Fund raised via bond selling.
Lot of Brokers giving Target 280 above.
Follow Strict SL 191. to exit when you see...

SBIN Looking good on charts for this Monday - 14-09-2020We see that SBIN crossed strong resistance at 201, As per the charts, this may reach 213 easily in a few trading sessions.

SBI levels for monday 14-09-2020State bank of India levels for 14-09-2020.
Don't short sbi if it's above 197. It's bullish above 197 so it can go 210, 220 easily.


