Nokia long term is given upNokia, long-term, market expectation is to go up if they start delivering on future financial quarterly reports. The TA is saying that the market expectation is that Nokia will start delivering good financials. The 20m (month) just crossed the 50m MA, this is the 1st time since November of 2016, Nokia is trading on the 100m and has been building price support, last month, it tested the bottom of the channel going to 4.50 and then bounced up quickly to make a dominant, also nok has been trading higher than 20m as well as the 50m MA. Nokia now just has to deliver on the upcoming Q1 report.
0HAF trade ideas


One NOK to rule them allReset is about
multipolarity
eco agenda
Industry 4
NOK will have a market cap greater than apple again
How hard it crashes will tell us how brutal the bear is going to be
Only two possible levels
...Evil eye...
NOT TRADUNG ADVICE


Nokia: Further Trouble AheadNokia Corporation - Short Term - We look to Sell at 5.31 (stop at 5.54)
We look to sell rallies. Previous support at 5.30 now becomes resistance. 50 1day EMA is at 5.44. There is scope for mild buying at the open but gains should be limited. Further downside is expected although we prefer to set shorts at our bespoke resistance levels at 5.30, resulting in improved risk/reward.
Our profit targets will be 4.56 and 4.29
Resistance: 5.30 / 5.50 / 6.00
Support: 5.00 / 4.50 / 4.30
Disclaimer – Saxo Bank Group. Please be reminded – you alone are responsible for your trading – both gains and losses. There is a very high degree of risk involved in trading. The technical analysis, like any and all indicators, strategies, columns, articles and other features accessible on/though this site (including those from Signal Centre) are for informational purposes only and should not be construed as investment advice by you. Such technical analysis are believed to be obtained from sources believed to be reliable, but not warrant their respective completeness or accuracy, or warrant any results from the use of the information. Your use of the technical analysis, as would also your use of any and all mentioned indicators, strategies, columns, articles and all other features, is entirely at your own risk and it is your sole responsibility to evaluate the accuracy, completeness and usefulness (including suitability) of the information. You should assess the risk of any trade with your financial adviser and make your own independent decision(s) regarding any tradable products which may be the subject matter of the technical analysis or any of the said indicators, strategies, columns, articles and all other features.
Please also be reminded that if despite the above, any of the said technical analysis (or any of the said indicators, strategies, columns, articles and other features accessible on/through this site) is found to be advisory or a recommendation; and not merely informational in nature, the same is in any event provided with the intention of being for general circulation and availability only. As such it is not intended to and does not form part of any offer or recommendation directed at you specifically, or have any regard to the investment objectives, financial situation or needs of yourself or any other specific person. Before committing to a trade or investment therefore, please seek advice from a financial or other professional adviser regarding the suitability of the product for you and (where available) read the relevant product offer/description documents, including the risk disclosures. If you do not wish to seek such financial advice, please still exercise your mind and consider carefully whether the product is suitable for you because you alone remain responsible for your trading – both gains and losses.

NOKIANokia why should it pop off before a little dip to the .386 fib level??? well why not? why does it not need a little capture of liquidity before its run up.....

Nokia to Drop FurtherNokia Corporation - Short Term - We look to Sell a break of 5.24 (stop at 5.45)
A move through bespoke support at 5.40 and we look for extended losses. Our overall sentiment remains bearish looking for lower levels. A lack of clear direction has formed a channel on the intraday chart that has a mild bias to break lower. We look for gains to be extended today.
Our profit targets will be 4.38 and 4.10
Resistance: 6.00 / 6.40 / 7.00
Support: 5.40 / 5.00 / 4.00
Disclaimer – Saxo Bank Group. Please be reminded – you alone are responsible for your trading – both gains and losses. There is a very high degree of risk involved in trading. The technical analysis, like any and all indicators, strategies, columns, articles and other features accessible on/though this site (including those from Signal Centre) are for informational purposes only and should not be construed as investment advice by you. Such technical analysis are believed to be obtained from sources believed to be reliable, but not warrant their respective completeness or accuracy, or warrant any results from the use of the information. Your use of the technical analysis, as would also your use of any and all mentioned indicators, strategies, columns, articles and all other features, is entirely at your own risk and it is your sole responsibility to evaluate the accuracy, completeness and usefulness (including suitability) of the information. You should assess the risk of any trade with your financial adviser and make your own independent decision(s) regarding any tradable products which may be the subject matter of the technical analysis or any of the said indicators, strategies, columns, articles and all other features.
Please also be reminded that if despite the above, any of the said technical analysis (or any of the said indicators, strategies, columns, articles and other features accessible on/through this site) is found to be advisory or a recommendation; and not merely informational in nature, the same is in any event provided with the intention of being for general circulation and availability only. As such it is not intended to and does not form part of any offer or recommendation directed at you specifically, or have any regard to the investment objectives, financial situation or needs of yourself or any other specific person. Before committing to a trade or investment therefore, please seek advice from a financial or other professional adviser regarding the suitability of the product for you and (where available) read the relevant product offer/description documents, including the risk disclosures. If you do not wish to seek such financial advice, please still exercise your mind and consider carefully whether the product is suitable for you because you alone remain responsible for your trading – both gains and losses.

Nokia at Key Support Level Nokia Corporation - Short Term - We look to Buy at 5.33 (stop at 5.16)
We look to buy dips. Trading within a Bullish Channel formation. A higher correction is expected. Previous support located at 5.40. We expect this move higher to continue and look to set longs in early trade using previous lows as a stop.
Our profit targets will be 5.76 and 5.95
Resistance: 5.75 / 6.00 / 6.40
Support: 5.40 / 5.25 / 5.00
Disclaimer – Saxo Bank Group. Please be reminded – you alone are responsible for your trading – both gains and losses. There is a very high degree of risk involved in trading. The technical analysis, like any and all indicators, strategies, columns, articles and other features accessible on/though this site (including those from Signal Centre) are for informational purposes only and should not be construed as investment advice by you. Such technical analysis are believed to be obtained from sources believed to be reliable, but not warrant their respective completeness or accuracy, or warrant any results from the use of the information. Your use of the technical analysis, as would also your use of any and all mentioned indicators, strategies, columns, articles and all other features, is entirely at your own risk and it is your sole responsibility to evaluate the accuracy, completeness and usefulness (including suitability) of the information. You should assess the risk of any trade with your financial adviser and make your own independent decision(s) regarding any tradable products which may be the subject matter of the technical analysis or any of the said indicators, strategies, columns, articles and all other features.
Please also be reminded that if despite the above, any of the said technical analysis (or any of the said indicators, strategies, columns, articles and other features accessible on/through this site) is found to be advisory or a recommendation; and not merely informational in nature, the same is in any event provided with the intention of being for general circulation and availability only. As such it is not intended to and does not form part of any offer or recommendation directed at you specifically, or have any regard to the investment objectives, financial situation or needs of yourself or any other specific person. Before committing to a trade or investment therefore, please seek advice from a financial or other professional adviser regarding the suitability of the product for you and (where available) read the relevant product offer/description documents, including the risk disclosures. If you do not wish to seek such financial advice, please still exercise your mind and consider carefully whether the product is suitable for you because you alone remain responsible for your trading – both gains and losses.


Go, Nok, GoThis and next week will be 9 months since the 'BANG' 'meme stocks' had a huge surge of 'retail' buying.
Nokia will be releasing their next Earnings Report in 9 days on 10/28/21.
The chart for Nokia is currently showing an interesting confluence coinciding with these events.
I'd keep a very close eye on the stock options for this company. The implied volatility has been beaten into the ground for the past few decades. When Nokia finally breaks back above and finds buying support on the neckline in this idea, all bets are off for 'Theta Gang'. It is fairly widely known that this company's stock has been a reliably substantial revenue stream for options writers who manipulate the price to their benefit. For YEARS. That is about to end, and end it will like 'a flash in a pan'. I'm sure the options writers who are about to get cooked have already made so much profit by screwing over the little guys that it won't really matter to them anyway. In fact, they'll very likely win yet again.
Man.
This is the one.

Nokia knocking down a peg. NOKBearish on Nokia once again. Downward zigzag with technical suggestion of further downward movement.
We are not in the business of getting every prediction right, no one ever does and that is not the aim of the game. The Fibonacci targets are highlighted in purple with invalidation in red. Fibonacci goals, it is prudent to suggest, are nothing more than mere fractally evident and therefore statistically likely levels that the market will go to. Having said that, the market will always do what it wants and always has a mind of its own. Therefore, none of this is financial advice, so do your own research and rely only on your own analysis. Trading is a true one man sport. Good luck out there and stay safe!


NOKIA new 52 week highTesting past 5 years resistance level @ 5.5, also made a new 52 week high.
Purchase @ 5.420
Stop loss @ 5.200 ~4% risk
Price target - non - Surfing the 30 MA . Selling after the first candle closes under 30MA.


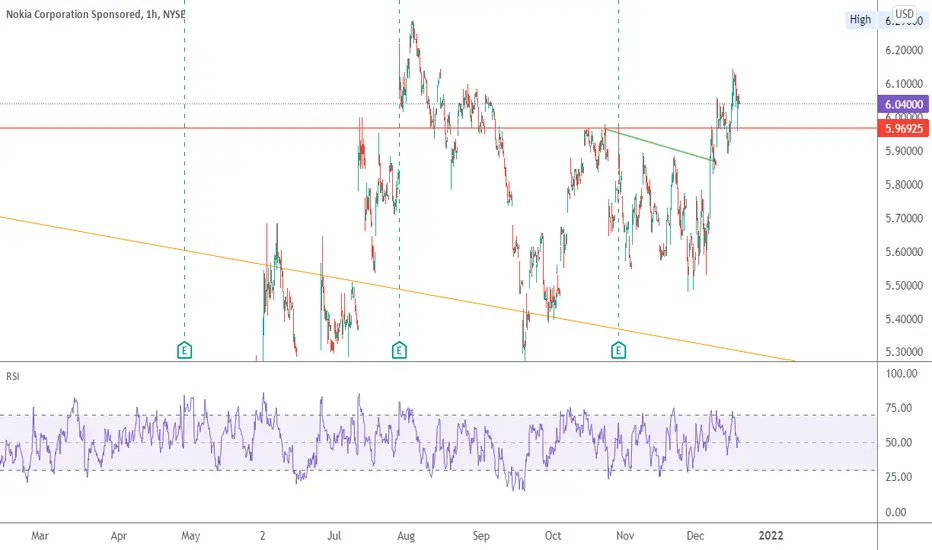
NOKIA AnalysisNotes
weekly chart:
- broke out of the downtrend from 2015-2021
- currently in an uptrend since it broke out in May 21
- strong resistance level ~@6.44-6.68
- touched the resistance level 5 times already
- weekly candle bearish
if it breaks the small support level at ~@6.03, there is a high potential that it will go down to @5.28
-> retracement back to the trend line (green line)
this is just an analysis from me. feel free for open discussion

Near term PT $6 then to the moon! :)NOK is a sleeping giant! It's a different company now compared to what it used to be. It will be a major players in 5G!

NOKIndustry 4/5
Great fundamentals
Under most people's radar
A lot of consolidation
I think it will test bottom of range again
BTFD
NOT TRADING ADVICE

Nokia Sneaks Toward New HighsNokia has gone nowhere for more than a decade, but now the Finnish networking stock may be finding new life.
The first pattern on today’s chart is the symmetrical triangle that formed in August and September. NOK broke out of this range earlier this month. It proceeded to bounce above the triangle last week, turning old resistance into new support.
Second, the stock is now above its 50-day simple moving average (SMA), 100-day SMA and 21-day exponential moving average (EMA). That wasn’t true just three weeks ago, which suggests the intermediate-term trend has recently grown bullish.
Third, NOK was targeted in January’s meme-stock frenzy. That briefly pushed its shares above $9.50. But if you exclude the unusual moment, NOK’s close yesterday was its highest in almost three years. It’s pushing some longer-term peaks from several years ago. There was also price gap on February 1, 2016. Filling it could bring NOK back to $7.
Overall, NOK may resemble Ford Motor a few months ago – another once-mighty name that had fallen from the limelight. However the fundamentals were improving with F as prices squeezed toward multiyear highs. Like F, NOK has showed signs of a turnaround as 5G orders flow in. Like F, it also struggled with chip shortages. Will it also climb a wall of worry as things return to normal?
TradeStation is a pioneer in the trading industry, providing access to stocks, options, futures and cryptocurrencies. See our Overview for more.
Important Information
TradingView is not affiliated with TradeStation Securities Inc. or its affiliates. TradeStation Securities, Inc., TradeStation Crypto, Inc., and TradeStation Technologies, Inc. are each wholly owned subsidiaries of TradeStation Group, Inc., all operating, and providing products and services, under the TradeStation brand and trademark. When applying for, or purchasing, accounts, subscriptions, products and services, it is important that you know which company you will be dealing with. Please click here for further important information explaining what this means.
This content is for informational and educational purposes only. This is not a recommendation regarding any investment or investment strategy. Any opinions expressed herein are those of the author and do not represent the views or opinions of TradeStation or any of its affiliates.
Investing involves risks. Past performance, whether actual or indicated by historical tests of strategies, is no guarantee of future performance or success. There is a possibility that you may sustain a loss equal to or greater than your entire investment regardless of which asset class you trade (equities, options, futures, or digital assets); therefore, you should not invest or risk money that you cannot afford to lose. Before trading any asset class, first read the relevant risk disclosure statements on the Important Documents page, found here: www.tradestation.com .

NOK NOKMy fav stonk
Deep f'ing value back to the future tech titan now focused on industry 4/5
This LOOKS bullish
But combined with the general market, decreasing volume and our Schiff pitchfork this may turn out to be a false break
Let's see
NOT INVESTMENT ADVICE
G.R.I. Dec '21

NOKIA massive cup and handleStarted last January with the massive Wallstreetbets spike. We made a cup from Jan - Aug. And then since August to December we made the handle. It is a cup and handle pattern one year in the making. Based on the fibs if we continue going up maybe 6.80 is the next resistance for the price. But overall still undervalued and is a good entry point currently.

Strong Bullish signal on Nokia (NOK) stockOpportunity to go LONG on Nokia (NOK) stock.
Like and Comment will be hugely appreciated, thank you so much for your support.
See other ideas below too!
RISK DISCLAIMER:
Trading Futures ,Forex, CFDs and Stocks involves a risk of loss.
Please consider carefully if such trading is appropriate for you.
Past performance is not indicative of future results.
Always limit your leverage and use tight stop loss.