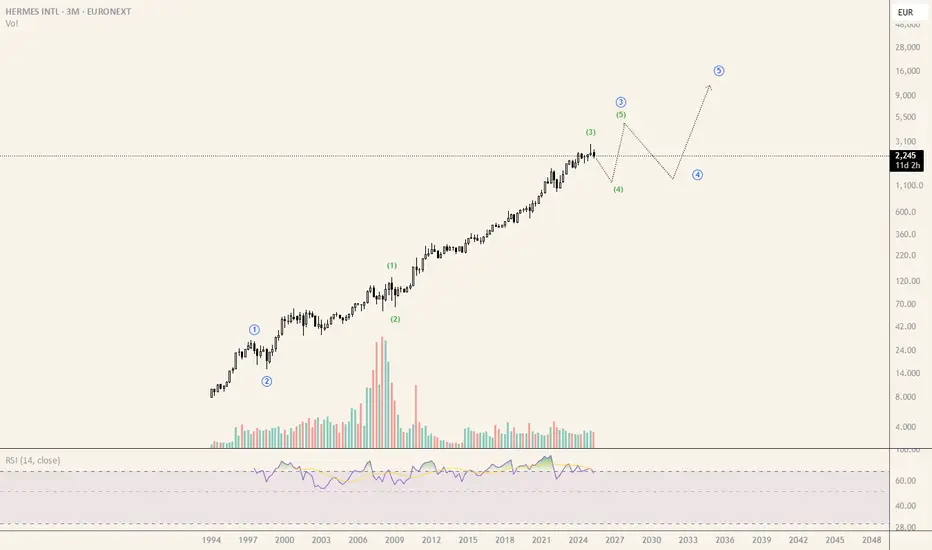
RMS - 3M - Projection over the next yearsHermes , 3 months timeframe
Keep pushing and pushing but i am expecting to the 4 of the 3 back to 1200 over the next years.
Then 5 of the 3 to at least 4600.
Many things can happen until there.
Just for fun :)
0HV2 trade ideas
Why Hermès’ margins shame the competitionThis analysis is provided by Eden Bradfeld at BlackBull Research—sign up for their Substack to receive the latest market insights straight to your inbox.
You know my favourite stocks are luxury stocks, and they’ve had a hard last year. Richemont and Moncler were the clear standouts from the most recent season (both grew sales), while Brunello did well too. Obviously, Kering did not do well. Here’s Hermes, which pretty much smashed everyone out of the park:
Revenue amounted to €15.2 billion
(+15% at constant exchange rates and +13% at current exchange rates)
Recurring operating income reached €6.2 billion, representing 40.5% of sales
Adjusted free cash flow amounted to €3.8 billion, up by 18%
Can we take a step back and please admire what smashing results those are — that’s a luxury business which does not cut corners operating on a 40.5% margin, with a free cash flow stream that is unheard of for the luxury industry. Let’s also consider that this is during what is nominally a recession.
Worth thinking about what makes Hermes special:
A hatred of meetings, corporate hogwash, and the associated.
They compete only with themselves — not others .
Human values. Hermes objects are made by people and bought by people . Corporate hogwash tends to see people as numbers, and then corporate hogwash forgets about the importance of psychology.
A fanatical obsession with product — product is the message.
No marketing team.
If your product is good enough, and the story you communicate is good enough, the people will come. The same can be said of Brunello, which I have always said is like a “mini-Hermes” — people buy Brunello for quality and the ethos it communicates. Worth re-reading Brunello’s daily routine, which does not look like the nonsense ice bath CEOs who you see on Instagram:

e-Learning with the TradingMasteryHub - Growth is "simple"🚀 Welcome to the TradingMasteryHub Education Series! 📚
Looking to unlock consistent growth in your trading? Today, we’re diving into a powerful yet straightforward formula that many overlook. Growth isn’t magic; it’s a process that involves discipline, patience, and following a few key principles. Let’s explore seven strategies that can lead you to consistent success.
1. Get Rid of the Idea that You Can Calculate Profit
It’s time to rethink profit calculation. Many traders rely on risk/reward (R/R) ratios to estimate their potential profits, but the truth is, you can’t predict how far the market will go or how volatile it’ll be on the way. Setting a profit target can actually work against you. Your brain becomes fixated on that goal, which can cause you to make irrational decisions, like holding on too long when the market is telling you to exit. It’s more likely that you’ll lose out by not taking profits before reaching your target than by missing an extended move.
Instead of trying to calculate profit, focus on managing your trades as they unfold. No one knows where the market will go, but you can follow the price action and let it lead you to bigger gains than you initially expected.
2. Always Use a Stop Loss
The stop-loss order is your best friend in trading because it’s the only thing you can control. A stop loss does more than protect your capital—it measures your discipline and ability to stick to a plan. It helps you stay aligned with your risk tolerance (what I like to call your “bud meter”).
Set your stop loss at significant areas in the market. The best place to put it? Where you’d place the opposite trade. For example, if you’re buying, put the stop loss where a sell order would make sense in the current market context. This prevents you from being stopped out prematurely and ensures you stay on the right side of the momentum.
3. Add to Your Winners, Cut the Losers
Adding to winners is a game-changer. Most traders fade out of winning trades too quickly because they fear giving back profits. But by adding to positions that are moving in your favor, you’re compounding your success. Don’t worry about getting in at a higher price—if the market is showing strength, it’s a sign to follow.
Let’s look at how most traders handle a winning trade:
- They take small profits at 1:1 R/R ratio, move their stop loss, and try to let the rest run.
- But in doing so, they lock in limited gains and miss out on the bigger move.
Now, here’s what the top 10% of traders do:
- Instead of scaling out, they add to their winners at each significant level.
- By adding small positions as the market runs, they compound their gains, allowing the trade to grow much larger than initially estimated.
This approach not only maximizes your gains but also lowers your risk on each successive entry.
4. Only Trade in Trend Direction
Trading with the trend is like surfing—catching the wave takes you much farther than paddling against it. In bull markets, overhead resistance zones are often broken, just like support levels in bear markets. These trends are driven by large institutional players, like hedge funds and banks. Retail traders only make up a small fraction of the market, so swimming against these currents is a losing game.
About 20% of trading days in major indices are strong trending days where the market moves in one direction all day long. To take full advantage of these days, you need to add to your winning trades as the trend progresses.
5. Seek the "Brain Pain"—It’s a Sign of Growth
Your brain is wired to avoid pain at all costs, and this can be detrimental to your trading. Most traders scale out of winning positions too soon because their subconscious is trying to protect them from the fear of losing profits. On the flip side, they’ll add to losing positions, convincing themselves that they’re getting a “discount,” even when the market shows otherwise.
To become a winning trader, you need to train yourself to embrace discomfort. This means adding to your winning trades, using stop losses that you can stomach, and cutting losses as soon as your brain starts to rationalize bad decisions. Losing should never bother you—it’s part of the game. What matters is your overall growth and consistency, not avoiding pain in individual trades.
6. Don’t Do What 90% of Traders Do—Be the 10%
Want to be in the top 10%? It’s simple: avoid the mistakes of the 90%. Here’s how:
- Always set a stop loss.
- Add to your winners, don’t fade out.
- Cut losses before they snowball.
- Trade the market, not your account—don’t take revenge trades to “get even.” Focus on what the market is showing you, not what your account balance says.
The market doesn’t care about your profit target. It only cares about price movement, so align yourself with it.
7. Analyze Your Trades, Not Just Your Results
The best way to grow as a trader is through post-trade analysis. Screenshot your charts, mark your entries, stop losses, and exits, and review them daily. This helps you identify both technical and psychological weaknesses in your trading.
Think of it this way: if you had a business partner who consistently made poor decisions, you’d fire them eventually. Be your own business partner, and change your behavior if it’s not delivering results.
🔚 Conclusion and Recommendation
Growth in trading is a simple formula: get rid of fixed profit targets, control your risk with stop losses, add to winners, and cut your losers. Follow the trend, embrace discomfort, and don’t fall into the traps that 90% of traders do. Analyze your trades with an honest eye, and over time, you’ll see steady growth.
Success in trading isn’t about perfection—it’s about discipline, consistency, and continual learning.
---
🔥 Can’t Get Enough? Don’t Miss Out!
Subscribe, share, and engage with us in the comments. This is the start of a supportive trading community—built by traders, for traders! 🚀 Join us on the journey to market mastery, where we grow, learn, and succeed together. 💪
💡 What You'll Learn:
- Essential growth strategies in trading
- The psychological edge to outperform others
- Practical tools for trading success
- And much more!...
Best wishes,
TradingMasteryHub

Luxury Stocks 6-month downtrend continuesWorries about slowdown in Chinese demand hitting luxury stocks. Bearishness increases on the street. Kering (Gucci owner) is at 7-year lows. Most probably will be cut but current indicated dividend yield reached 6%. #luxurystocks #lvmh #hermes #kering

Hermes Intl. Lets Try The Screwdriver NowHermès International S.A. is a French luxury design house established on 15 June 1837. It specializes in leather goods, lifestyle accessories, home furnishings, perfumery, jewelry, watches and ready-to-wear.
Since the 1950s, its logo has been a depiction of a ducal horse-drawn carriage.
Technical graph for Hermes stocks (US Dollars - denominated) indicates they turned to extra hot levels earlier this year, somewhere in mid-February 2024.
Due to common uncertainty the bubble is going to be finally screwed.

Hermes On DiscountI'd suggest you consider buying Hermes stock instead of a bag if you're looking for a surprise. Currently, the stock is trading at a lower price, which you're referring to as a "wholesale value." You can take advantage of this opportunity by purchasing the stock now and potentially selling it at a higher price in the future and getting the bag... I think the bags hold value as long as she keeps it clean btw my lady taught me that, following the principle of "Buy Wholesale, Sell Retail."

Hermès (RMS) Faces Resistance: Breakout or Pullback?Luxury goods giant Hermès International (RMS) is testing its mettle against a key resistance level on the three-month price chart. Currently trading at $2,387, the stock has reached a critical juncture, prompting to question whether a breakout or a pullback is more likely.
The resistance level in question represents a three-month trend line, acting as a barrier for further upward price movement. Historically, similar situations have resulted in two distinct outcomes:
Breakout:
If RMS can decisively break above the resistance line, it could signal a surge in investor confidence and propel the stock to new highs. This scenario would be particularly bullish for those anticipating continued growth in the luxury goods market.
Pullback:
Alternatively, the stock could experience a pullback, retreating from the resistance level. This wouldn't necessarily be negative but could indicate a period of consolidation before another attempt to break through.

HERMES: Bearish -BUTTERFLY detected +R.O.C DivergenceHERMES: Bearish -BUTTERFLY detected +R.O.C Divergence
concerning Hermes the Wolf of Zurich detected a harmonic figure Butterfly in "Daily"
the market can go back down to its gap around 2073.
then around 1980 € and finally around 1850 according to my Wolfe wave
*
the "ROC" is in positive territory in "daily" but in "1 hour" the rock makes a divergence with the action with the market
here stay careful it was the wolf of Zurich

RMSHermès International S.A. is a French luxury design house established on June 15th 1837. It specializes in leather goods, lifestyle accessories, home furnishings, perfumery, jewelry, watches and ready-to-wear. Since the 1950s, its logo has been a depiction of a ducal horse-drawn carriage.
'Event risk' looms, but strength has re-emerged.

RMS - HERMES - LongThere is a good price for buying already but the desirable one is 1668 to end up the correction patterm (it is probable to happen). Neverdeless start open long position is a good idea (in my opinion)

Momentum Stock: Hermes InternationalHermes International SA is a French luxury goods manufacturer that has been a distinguished name in the luxury industry since its inception in 1837. The company operates across a diverse range of high-end goods including leather accessories, ready-to-wear clothing, jewelry, silk and textile products, art of living and tableware, perfumes, and watches. It also handles the weaving, engraving, printing, dyeing, and finishing of textiles, as well as the purchasing, tanning, dyeing, and finishing of precious leathers. Its products are available through a global network of stores and also through specialized stores for watches, perfumes, and tableware. The company's rich history and global presence make it a noteworthy player in the luxury goods sector.
Hermes International's potential interest to investors could be attributed to its consistent financial performance and growth. In the past five years, it has shown a strong price performance with over 208% gain, and in the last year alone, the price of the stock has increased by more than 86%. This kind of sustained growth signifies the company's ability to adapt and prosper even in the face of market fluctuations and potential challenges.
The company's recent numbers also tell a story of healthy financials. It boasts a Market Capitalization of approximately $225.8 billion, a testament to its size and stability. It has a profit margin of 29.02%, and an operating margin of 41.54% on a trailing twelve-month basis, showing strong profitability. Additionally, the company has reported year-over-year quarterly revenue growth of 29.1% and earnings growth of 35.8%, demonstrating its ability to grow its operations and profits.
The company also has a robust dividend policy, currently offering a yield of 0.66%. Regular dividend payouts can be attractive to income-focused investors who are looking for a return on their investment beyond stock price appreciation.
In terms of valuation ratios, Hermes' Trailing Price to Earnings (PE) ratio is 61.78 and its Forward PE is 46.95, indicating expectations for future earnings growth. The Price to Sales (P/S) ratio on a trailing twelve-month basis is 16.29, signifying a premium valuation, which might be justified given the company's strong brand and steady performance.
In terms of risk, Hermes exhibits a Beta of 0.7474, which means it's less volatile than the overall market. This might appeal to conservative investors looking for less volatile investment options in a well-established, profitable company.
Despite its high valuations, the stable financials, sustained growth, and a lower risk profile make Hermes International SA a potentially attractive choice for investors looking for long-term investments in the luxury goods sector. Of course, it's always important for potential investors to conduct their own due diligence and consider their risk tolerance and investment strategy before investing.
In terms of any kind of short term entry, the stock has been consolidating for a while and you would need to keep an eye on which way it breaks especially as it has been going up for a while. I would pay particular attention to any upwards movement on both the RSI and MACD for any kind of confirmation. For downside risk management, a trailing stop loss of around 11% would have kept you in most of this trade. If it broke below that it could have been a good sign to exit and look for a new entry when the trend resumed.
As always how you interpret and decide to act on any results is up to you. This is just data not financial or trading advice and past performance is in NO WAY any guarantee of future performance. Think of it as a way to spot stocks you might be interested in and can add to your watch list and perform further research on and or discuss with your broker.
Again. Not trading advice . Industries and companies change. Trends can end. Do your own research / discuss it with your advisor, but might be one to watch.

Hermes International running well.Hermes is a French fashion house offering a wide range of goods.
They have had a great run over the last 12 months or so in a softer economy so could be interesting to keep an eye on. Up 100% over the year, but the RSI and MACD indicate better value might be ahead if looking for an entry.
One to watch.

long position on RMSMy strtegy is based on price action with the reading of certain indicators that I like whilerespecting all the values that define the stock maket

HESAY - Double BottomHESAY on this Logarithmic chart has gone parabolic
A slanted double bottom can be observed
This will push price up towards a double top (red horizontal)
The double top might occur but the parabolic trend will likely not break
Hence the continuation bars pattern in green

Hermes Bullish The Chart currently shows Bullish signal as per these indicators:
1. Bullish Falling Wedge Chart Pattern
2. Bullish Divergence (RSI)
If the upper trendline is broken can expect further upside potential.

Herms International France SSI Live Trading Series
Sun Storm Investment Trading Desk & NexGen Wealth Management Service Present's
Focus: Worldwide
By Sun Storm Investment Research & NexGen Wealth Management Service
A Profit & Solutions Strategy & Research
Trading | Investment | Stocks | ETF | Mutual Funds | Crypto | Bonds | Options | Dividend | Futures |
USA | Canada | UK | Germany | France | Italy | Rest of Europe | Mexico | India
Disclaimer: Sun Storm Investment and NexGen are not registered financial advisors, so please do your own research before trading & investing anything. This is information is for only research purposes not for actual trading & investing decision.
#debadipb #profitsolutions

Hermès International S.A hedgingFor educational purposes
Hermès International S.A., or simply Hermès, is a French luxury design house established in 1837. It specializes in leather goods, lifestyle accessories, home furnishings, perfumery, jewelry, watches and ready-to-wear. Its logo, since the 1950s, is of a Duke carriage with horse
expected pay out of about 300 euro profit a week

Hermes International LongHermes, showing bullish divergence on RSI. Has put in a double bottom and bounced off a trendline that's been in place since 2018. Tight stop at 1032 making for nice risk to reward with first TP at 1295 and second at 1550.

HERMES-STRATEGIC MEDIUM/LONG TERM BUY !Following the sharp decline (-30.85 %), since the ATH @ EUR 1678.00 reached on December 1st, 2021, the price action triggered an HAMMER (reversal pattern) coupled
with a RSI BULLISH DIVERGENCE, which is a first positive signal calling for a trend reversal towards higher levels.
Important to also note that a potential DOUBLE BOTTOM is in progress (first bottom having been reached on October 1st, 2021 @ 1'166.50 !
Today's ongoing price action (long white candle) is, for the time being confirming this reversal and a closing level, on a DAILY BASIS, ideally above the Tenkan-Sen or Conversion line (@ 1'257.80) would
add further support to this expected bullish scenario.
IMPLICATIONS :
UPSIDE :
Once this first resistance level will be broken, focus will be on the second resistance area (cluster of both Kijun-Sen or Base line (1288) and the MId Bollinger Band-(1298) -"my own Barometer !", for further development
(on this daily time frame, BULLISH above and BEARISH below the Mid Bollinger Band (MBB).
The ongoing downtrend resistance line (in red), currently around 1'380 would be the next resistance level to look at ahead of the Daily clouds area (currently very thin) and close to the 61.8% Fibonacci retracement @ 1480.50.
A clear upside breakout of the top of the clouds would reopen the door for a new attempt of ATH.
DOWNSIDE :
Former low @ 1'160.50 is the first support to look at and any dips towards this level should be seen as consolidative move in a new uptrend.
Main focus will remain on the WEEKLY CLOUDS SUPPORT AREA (1'200-1'025) with intermediate support @ 1'097,00 this level being the 50% Fibonacci retracement of the big rally which started @ EUR 516.00 in March 16, 2020
CONCLUSION :
HERMES is a diamond, very well managed and fundamentally exceptional !
Therefore, STRATEGIC LONG EXPOSURE SHOULD BE BUILT FROM CURRENT LEVEL AND ON DIPS AS A REAL VALUE ADDED ON ANY PORTFOLIO.

Hermes Reversing. RMSClassical play here. End of the 5 wave ride, now zigzagging. This is accompanied by a divergence, dropping momentum and sloped downward moves. Goodluck out there!
We are not in the business of getting every prediction right, no one ever does and that is not the aim of the game. The Fibonacci targets are highlighted in purple with invalidation in red. Fibonacci goals, it is prudent to suggest, are nothing more than mere fractally evident and therefore statistically likely levels that the market will go to. Having said that, the market will always do what it wants and always has a mind of its own. Therefore, none of this is financial advice, so do your own research and rely only on your own analysis. Trading is a true one man sport. Good luck out there and stay safe!

#HERMES : f you ! i m so bearish on this stock , it moves to fast and done 1 - 5 wave now the abc can be juicy


