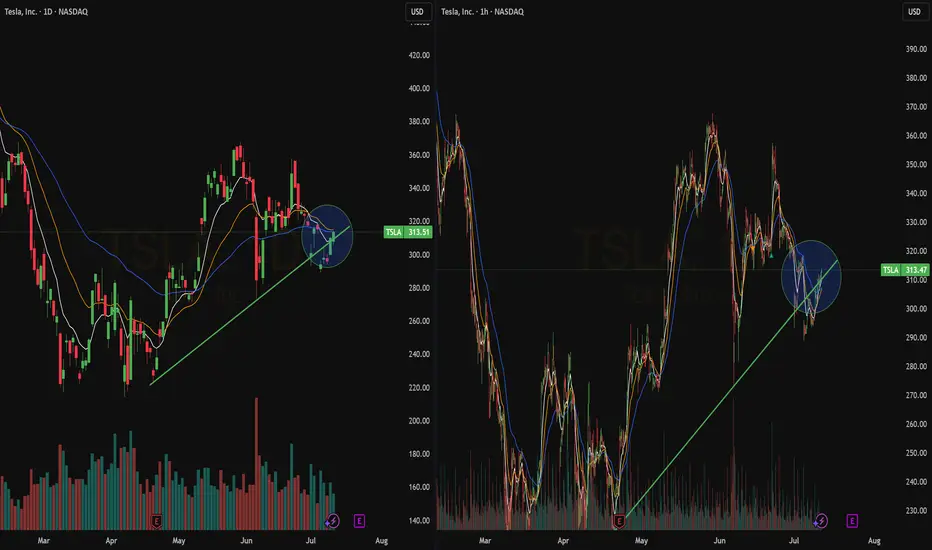
Tesla’s Next Move: Bullish Play Amid AI and Volatility Current Price: $313.51
Direction: LONG
Targets:
- T1 = $319.00
- T2 = $329.15
Stop Levels:
- S1 = $307.75
- S2 = $303.60
**Wisdom of Professional Traders:**
This analysis synthesizes insights from thousands of professional traders and market experts, leveraging collective intelligence to identify high-probability trade setups. The wisdom of crowds principle suggests that aggregated market perspectives from experienced professionals often outperform individual forecasts, reducing cognitive biases and highlighting consensus opportunities in Tesla.
**Key Insights:**
Tesla’s recent AI innovation and its expanding robo-taxi footprint signal long-term growth potential while short-term volatility requires strategic entry points. Market sentiment has significantly improved with positive news about the integration of Gro 4 AI, enhancing Tesla’s autonomous vehicle advancements. Trading at critical levels, Tesla offers a potential buying opportunity near key support zones.
The rallying investor focus on Tesla’s technological edge places it among the leaders in automation-driven growth. Despite macroeconomic pressures, Tesla’s proactive efforts in leveraging cost efficiencies and scaling autonomous solutions are helping to sustain bullish momentum.
**Recent Performance:**
Tesla demonstrated notable resilience during a turbulent earnings season, holding strong amidst mixed market signals. Recent delivery figures reflected a 13% year-over-year decline, which stirred concerns. Yet, the stock was buoyed by positive AI-related news and the market-wide optimism surrounding automation technologies, enabling Tesla to maintain its pivotal price range.
**Expert Analysis:**
Analysts acknowledge Tesla’s robust innovation pipeline centered around driver assistance and robo-taxi functionality powered by the Gro 4 AI platform. Concerns related to Elon Musk’s focus and governance have tempered enthusiasm for some traders, but these have largely been offset by Tesla’s strategic actions to sustain revenue and growth. Tesla’s prominent role in setting the market narrative for autonomous vehicles and broader EV adoption ensures ongoing support from long-term investors.
Tesla’s recent moves are growing investor confidence as it seeks to hedge against broader economic uncertainties and mitigate risks around regulatory changes. Its expansion strategy continues to highlight its leadership within the EV space, while early adopters of its AI-driven solutions may set the pace for sustainable revenue expansion.
**News Impact:**
The integration of Gro 4 AI is expected to significantly enhance Tesla’s robo-taxi and autonomous vehicle functionality, enabling it to capture market share in urban mobility services. Tesla’s announcement of an expanded robo-taxi fleet targeting key metropolitan areas could help offset delivery declines and drive future recurring revenues. While concerns about Elon Musk’s governance persist, ongoing innovation continues to support Tesla’s bullish outlook in global EV markets.
**Trading Recommendation:**
Tesla’s current price action signals an advantageous entry point for a long position, reinforced by recent bullish news and industry-leading innovations. Short-term traders can target $319.00 and $329.15 while maintaining disciplined stop-loss levels at $307.75 and $303.60. With strong support from institutional sentiment and expanding AI applications in its product line, Tesla offers substantial upside for bullish investors.
0R0X trade ideas
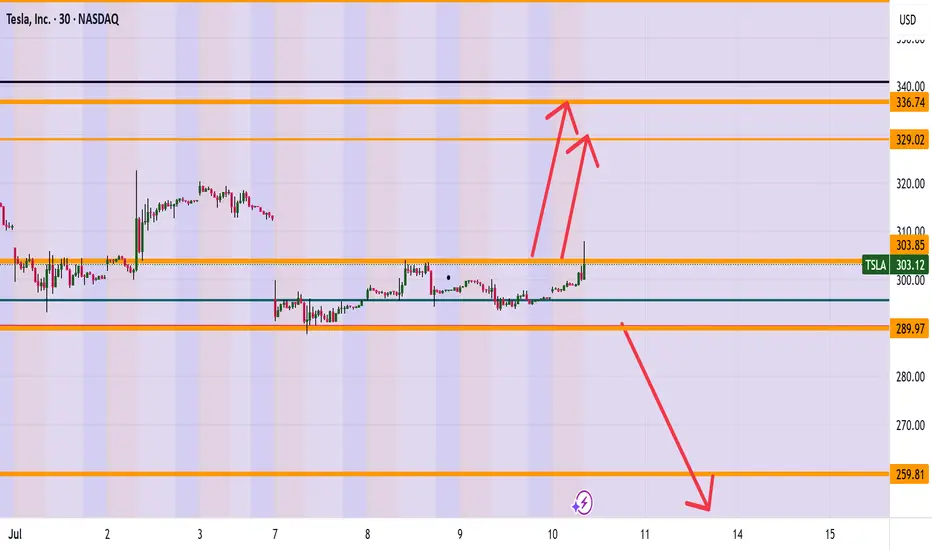
TESLA (TSLA) ARE WE HEADING TO 336? Morning Folks
It appears we are trying to break the highs of 304 and if we are successful a nice range up to 327-336 makes sense. However be careful if sink back down under 289 which then can see levels of 259 getting hit.
What are your thoughts on Tesla? Put in the comments section below
Kris Mindbloome Exchange
Trade Smarter Live Better
TSLA BUY 253.8Recently, TSLA has maintained a volatile operation. Currently, we can pay attention to the area around 253.8 below, which is a potential buying position for a bullish Gartley pattern. At the same time, this position is within the previous demand area.

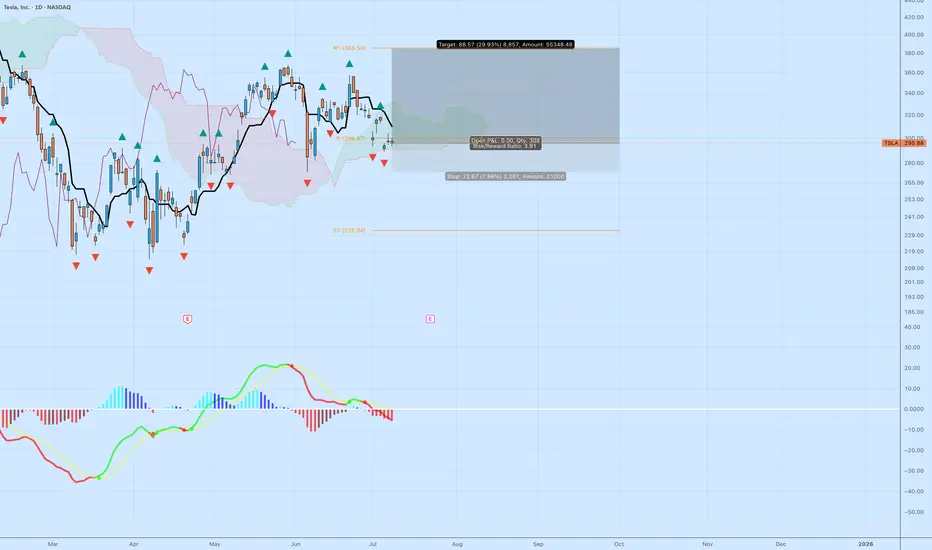
TSLA: High R/R Bounce Play Off the Cloud EdgeTesla NASDAQ:TSLA is sitting at a decision point — testing the edge of the Ichimoku cloud while momentum resets. The setup isn’t confirmed, but the risk/reward is compelling for those watching structure.
🔍 Technical Breakdown
Cloud Support: Price is holding right at the top of the cloud. A breakdown would signal trend weakness, but for now, it's a potential bounce zone.
MACD: Momentum has cooled off, but no bullish crossover yet. Early signs of a flattening histogram could suggest a pivot.
Structure: Horizontal support near $292–295 has held multiple times. If this zone holds again, the upside target opens up quickly.
🎯 Trade Specs
Entry: $296.88
Target: $385.50 (+29.93%)
Stop: $274.21 (–7.66%)
Risk/Reward: 3.91 — solid asymmetry
💡 Trading Insight:
This isn’t about calling bottoms — it’s about defining risk. When price compresses at known support, and you’ve got a 3.9 R/R profile, you don’t need to be right often to be profitable.
TSLA Long Idea — Buying the Support After News-Driven DipNASDAQ:TSLA price has stabilized near the key $290–291 support zone, a level that has previously triggered rebounds. This presents a solid entry opportunity with limited downside risk.
Context: The recent drop was triggered by headlines involving the U.S. President and Elon Musk. If this was mainly speculative noise, now could be the best time to buy, as the market absorbs the news and finds technical support.
Technical Setup:
• Strong support at $290–291 holding firm.
• Stochastic is in the oversold zone and starting to turn upward.
• Bollinger Bands tightening — breakout likely.
• Target: $307.45 (+4.57%)
• Stop-loss: $289.09 (−1.68%)
• Risk/Reward Ratio: 2.72
Expected move by July 9, 2025. With strong technical signals and fading news impact, this setup offers a favorable risk/reward for bulls looking to ride a rebound.

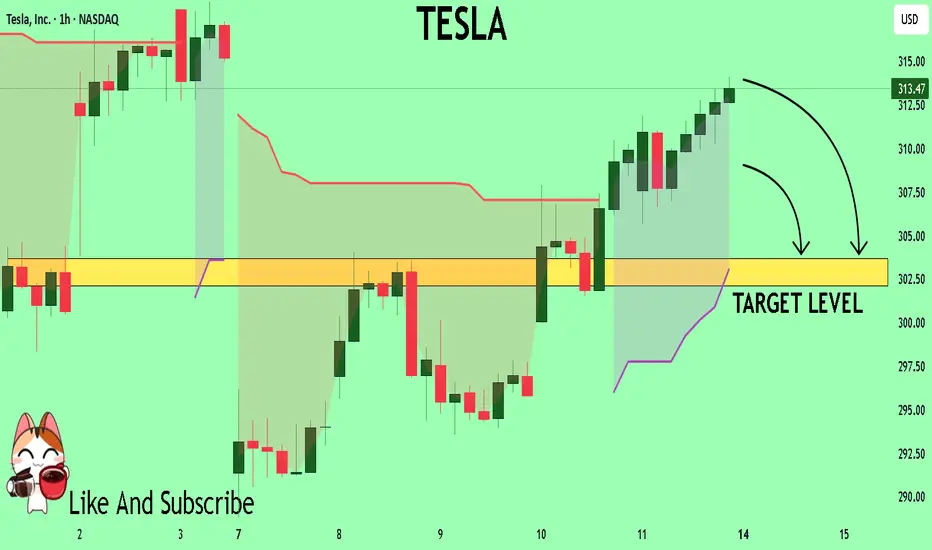
TESLA My Opinion! SELL!
My dear friends,
Please, find my technical outlook for TESLA below:
The price is coiling around a solid key level - 313.47
Bias - Bearish
Technical Indicators: Pivot Points Low anticipates a potential price reversal.
Super trend shows a clear sell, giving a perfect indicators' convergence.
Goal - 303.67
About Used Indicators:
The pivot point itself is simply the average of the high, low and closing prices from the previous trading day.
Disclosure: I am part of Trade Nation's Influencer program and receive a monthly fee for using their TradingView charts in my analysis.
———————————
WISH YOU ALL LUCK
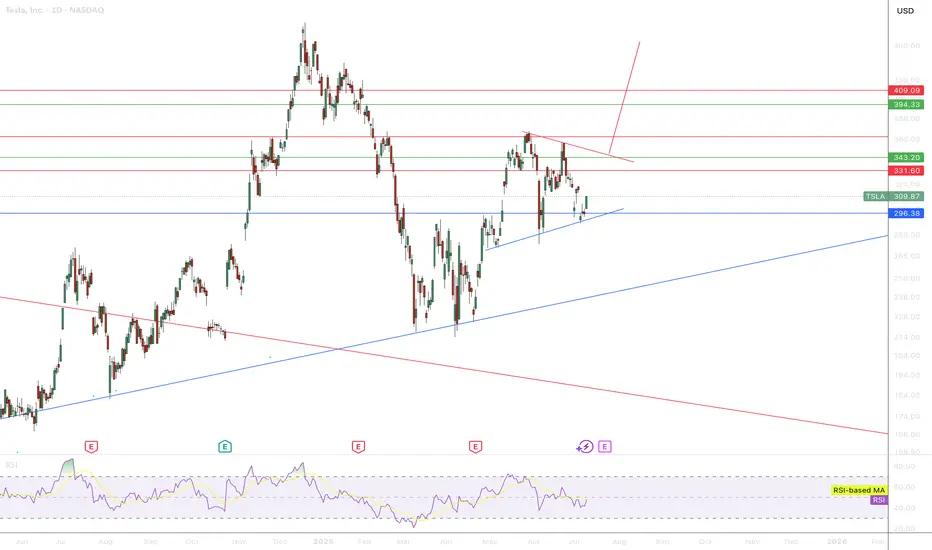
Triangle Pattern in TSLALooking at 4H-1D Chart, there is a triangle pattern emerging which may target 400 area. Good luck.
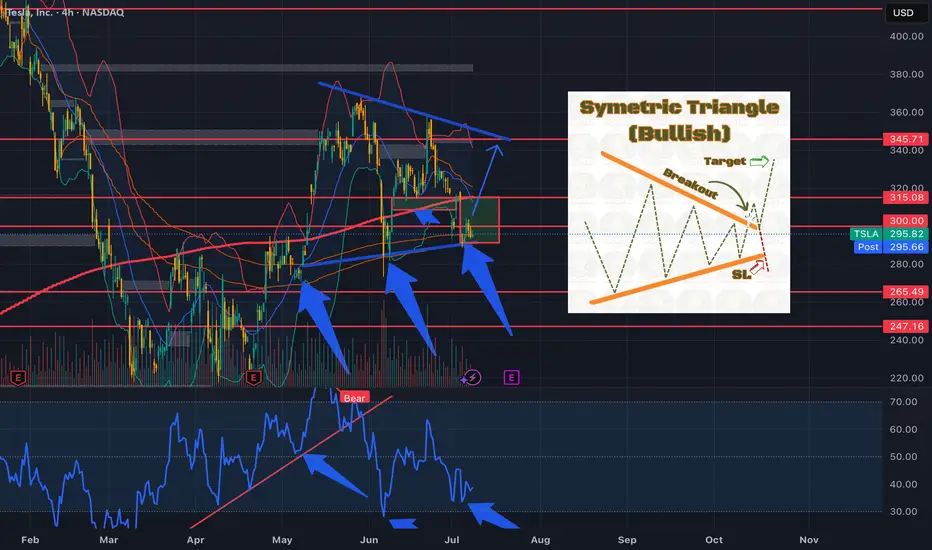
TSLA....Symetric Triangle....Earnings Rally?Could we see the bulls step in and leads us into earnings?
TSLA - Explosive Bounce TSLA Before the Drop? | EW Analysis My primary view is that we’re in the final stages of an ending diagonal, which could lift the price to new all-time highs, potentially between $460 and $650. Wave 4 of this structure appears to have completed after precisely tagging key Fibonacci support, and since then, we've already seen a strong bounce from that low. I’m now watching for the development of the final wave in this pattern, which could deliver gains of over 100% from current levels.
However, I’m not fully convinced by the internal shape of the diagonal so far. That’s why I’m also have an alternative scenario: in this case, the recent low may have marked the end of Wave 2 within a much larger diagonal. If true, this opens the door to a much more extended rally potentially reaching $1,000 before we see a major correction.
That said, this second scenario is not my preferred one, and a decisive break below the recent lows would invalidate both counts.

Break of rising trendline TSLA – 4H 🧠
Bias: Bearish
Entry: Below 300.00
🎯 Targets: 273.67 – 253.87
❌ Invalidation: Above 315.01
Break of rising trendline signals bearish momentum. Downside continuation anticipated.
#TSLA #Stocks #NASDAQ #PriceAction #TradingView #piporia

TSLA BUY+++ WEDGE FORMING $339 first targetTSLA, like AAPL, is forming a bullish wedge which likely will break to the upside. First target is $339 at wedge resistance then will reevaluate
Quick Update : TSLABullish Crossover on the hourly chart at the bottom of the channel.
The action of the last hours is weak as can be seen by the lack f volume.
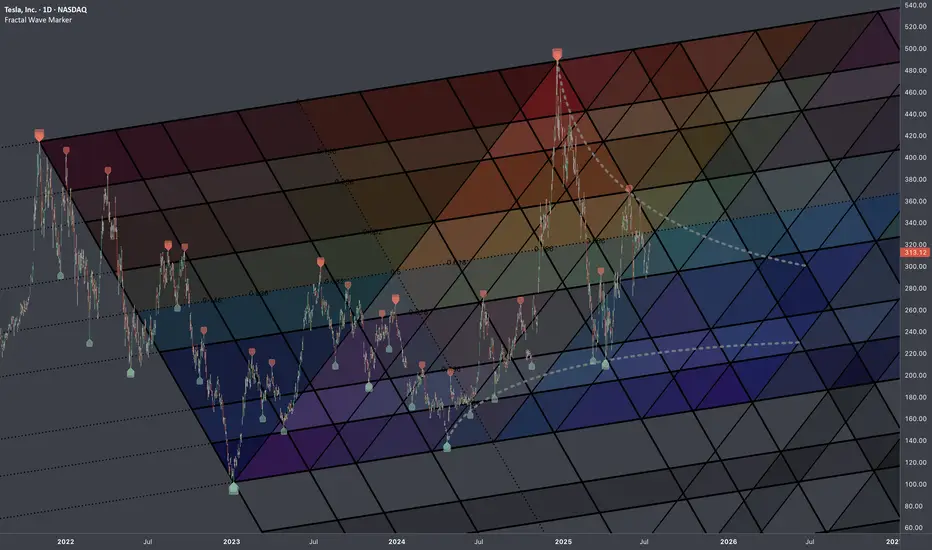
$TSLA: Fib InterconnectionsResearch Notes
Examining interconnection type with regressive angle:
Critical points:
Mapping with 3 fibonacci channels:
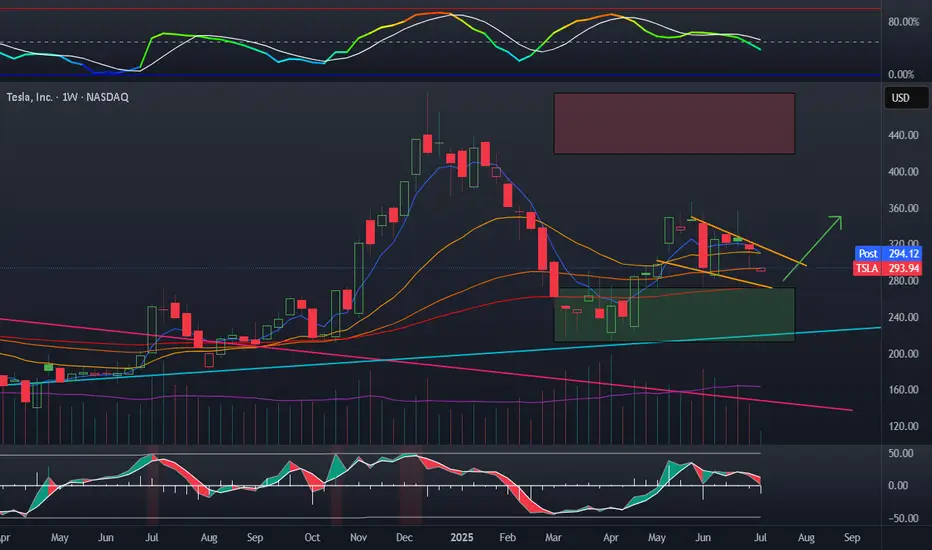
TSLA consolidation before expansionTesla despite being effected once again by fud is ready to pop. Average volume is up, a bear flag has played out, and oscillators reset. This 55 EMA on the weekly is a nice DCA zone. A bounce here or around 270 is likely. I think we see another try at 350 in coming weeks.
My plan:
Averaging down on TSLL, in CSP, already captured a few rounds of covered calls
Tesla, Below 200 Next - The Crash Can Reach 140, 150 & 160Tesla has been bearish since December 2024 and producing lower highs since. A strong lower high happened late May with a shooting start candlestick pattern. A month later another lower high and bullish rejection with an inverted hammer.
This looks like an ABC correction with the low in March/April being the A wave. The lower high in May the B wave and the next low the final C wave. This would complete the corrective pattern.
Conditions for bullish
An invalidation of the bearish bias and potential would happen with a rise and close, weekly, above 355. Any trading below this number and the bearish bias remains intact.
Indicators: RSI & MACD
» RSI:
The RSI looks pretty bad as it already curved down; trending down and moving lower since December 2024.
» MACD:
The weekly MACD is weak, starting to curve but still on the bullish zone. The daily MACD already turned bearish and moving lower.
Summary
Overall, market conditions are weak for this stock and everything points lower. The chart structure points to a lower low based on a broader bearish trend.
Thank you for reading.
Namaste.

TSLA eyes on $294: Key Support for bulls to hold or face $253TSLA oscillating all over the place thanks to Musk moves.
Currently testing a key support zone $293.96-294.32.
Loss of this floor opens the Golden Genesis at $253.57
See "Related Publications" for previous charts ------------>>>>>>

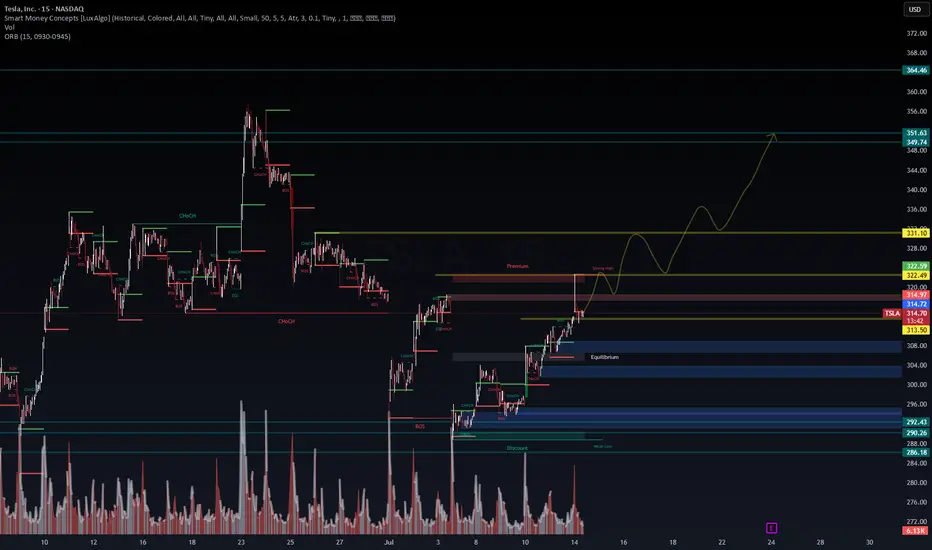
TSLA | Breakout Fuel Loaded – Will the Trend Accelerate Toward 🚗 TSLA | Breakout Fuel Loaded – Will the Trend Accelerate Toward $350?
🔍 Chart Type: 15m
🧠 System: Smart Money Concepts (LuxAlgo) + WaverVanir DSS
📊 Volume: 2.08M
🧭 Narrative: Liquidity Engine + Bullish Flow Momentum
📈 Current Price: $314.78
Clean breakout above BoS and ChgofCHoCH
Currently testing Strong High within a defined Premium Zone
EMA Stack (20/50/100/200) is bullishly aligned
📌 Key Levels to Watch:
📍 Premium Resistance: ~$315–$318
⚖️ Equilibrium Support: ~$309
💧 Discount Liquidity Zones: $292.43, $290.26
🚀 Upside Targets:
Minor: $322.49
Mid: $331.10
Major: $349.74 → $351.63 (projected wave peak)
📈 Bullish Case (Preferred by DSS Flow Model):
Retest of strong high → rally toward $322 then $331
Momentum and volume support trend acceleration
Break of $331 opens path toward $349.74–$351.63 (final wave)
📉 Bearish Invalidator:
Break below equilibrium ($309) → Discount zone retest
Watch $292–$286 for final liquidity sweep if rejection occurs
📅 Catalyst:
Earnings (📦 E icon marked) + macro tech sentiment could ignite explosive continuation
Market structure favors liquidity vacuum toward premium targets
🧠 VolanX DSS Sentiment: STRONG BULLISH
✅ Structure: Uptrend
✅ Volume: Expanding
✅ Momentum: Aligned
🟡 Risk: Premium rejection short-term possible
🔁 Executed via VolanX AI Scanner + WaverVanir DSS Engine
📊 “The Edge Is a System. The System Is Intelligence.”™
#WaverVanir #TSLA #SmartMoneyConcepts #PriceAction #LiquidityZones #Tesla #TechnicalAnalysis #VolanX #InstitutionalEdge #AITrading #QuantFinance
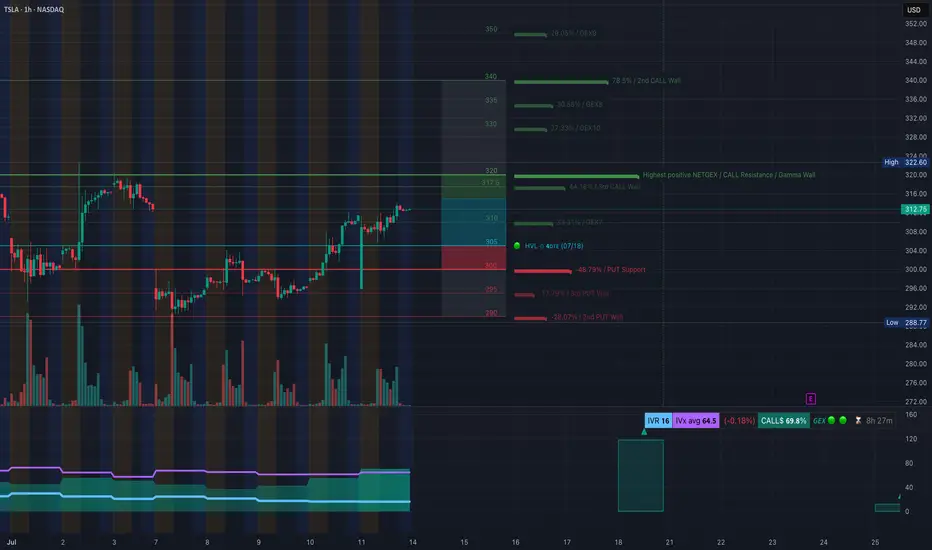
TSLA TA – Call Side Dominance Nearing Resistance-July 14TSLA GEX Analysis – “Call Side Dominance Nearing Critical Resistance 💥”
GEX Snapshot:
* Highest Positive GEX / Resistance: $320 – This is where call positioning is heaviest and likely where dealer hedging could resist further upside.
* Call Walls:
* $317.5 (44.18%)
* $320 (High NetGEX)
* $335–$340 (Intermediate resistance, weaker positioning beyond)
* Put Walls:
* $300 (48.79% support)
* $295 / $290 (3rd/2nd tier walls)
Options Oscillator:
* IV Rank (IVR): 16 (Low)
* IVx avg: 64.5
* Call Positioning: 69.8% (very bullish skew)
* GEX: 🔰 Bullish
🎯 Options Trade Setup:
Direction: Cautiously Bullish – but close to key resistance!
⚡ Aggressive Bullish Setup:
* Entry: Near $312.75 (current price)
* Strike: Buy $317.5C or $320C expiring this week
* Target: $320+
* Stop: Close below $308
* Note: Watch dealer hedging around $320. If TSLA breaks $320 with strength, gamma squeeze toward $335 is possible.
🛡️ Bearish Reversal Setup (if rejected at $320):
* Strike: Buy $310P or $305P (next week expiry)
* Trigger: Rejection at $320 + breakdown below $311
* Target: $304–$300
* Stop: Above $321
📉 TSLA 1-Hour Chart Analysis – “Breakout Zone or Fakeout Trap? Watch These Levels 🎯”
Structure:
* TSLA broke above the CHoCH and BOS zones between $308–$310. Price is consolidating under the $317.5–$320 resistance (also seen on GEX).
* There’s a clean ascending wedge/channel forming – upper boundary is near $320, and the lower trendline is near $304.
Key Zones:
* Supply Zone (Purple): $317.5–$320 (watch for rejection or breakout)
* Support: $309.8 (BOS zone), then $304 (trendline + demand overlap)
* Demand Zone: $293.5–$296 (origin of last rally)
🛠️ Trade Scenarios:
🔼 Bullish Continuation:
* Entry: Break and hold above $320
* TP1: $325
* TP2: $335
* SL: Below $311
🔽 Bearish Pullback:
* Entry: Rejection at $317.5–$320 zone and break below $309
* TP1: $304
* TP2: $296
* SL: Above $320
✅ Summary:
* GEX favors calls but $320 is a critical gamma wall – if broken, it opens room toward $335+.
* On the chart, watch the rising channel and upper resistance at $320.
* Bullish momentum is still intact unless $309 fails.
* Stay nimble: scalp calls on breakout, or prepare for a reversal put if there's rejection and structure break.
Disclaimer: This analysis is for educational purposes only and not financial advice. Trade at your own risk with proper risk management.
Important Volatility Period: Around August 21
Hello, traders.
If you "Follow", you can always get the latest information quickly.
Have a nice day today.
-------------------------------------
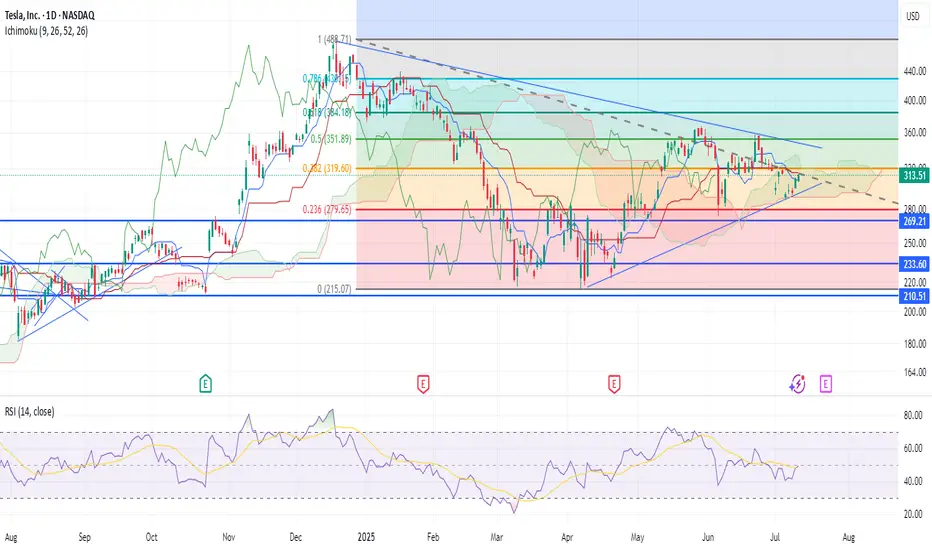
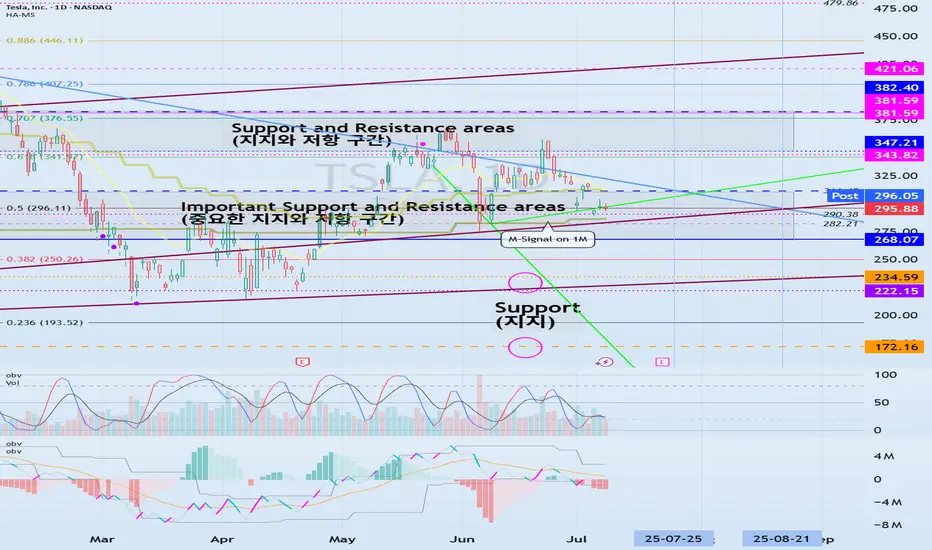
(TSLA 1D chart)
The medium-term trend is maintaining an uptrend.
However, if the price falls below the M-Signal indicator on the 1M chart and maintains, there is a possibility of a downtrend, so caution is required.
The support zone is
1st: 222.15-235.59
2nd: 172.16
Around the 1st and 2nd above.
The 268.07-311.48 zone is an important support and resistance zone.
If the price is maintained above this zone, there is a high possibility that a full-scale upward trend will continue.
However, since a resistance zone is formed in the 347.21-382.40 zone, we need to look at how this zone is broken upward.
-
When it falls to the 172.16-234.59 zone, we need to find a time to buy.
If not, we need to buy when it shows support in the 268.07-311.48 zone.
It would be better to buy at a lower price, but since the investment period will inevitably be longer, I think it is better to buy when an upward trend is detected.
-
The important volatility period is around August 21st, but before that, we need to check the movement around July 25th.
If it falls below 268.07 after August 21st, it could lead to further decline.
If it rises above 311.48 and maintains the price during the movement around July 25th, it could lead to further increase and it seems likely to create a trend after the volatility period around August 21st.
-
Thank you for reading to the end.
I hope you have a successful trade.
--------------------------------------------------
Tesla (TSLA) Leads Declines in the Equity MarketTesla (TSLA) Leads Declines in the Equity Market
Yesterday, President Trump announced that letters had been sent to the United States’ trading partners regarding the imposition of new tariffs — for instance, a 25% tariff on goods from Japan and South Korea. This marks a return to “trade diplomacy” under the America First strategy. The tariffs are scheduled to take effect on 1 August, though the date remains subject to revision.
As we highlighted yesterday, bearish signals had begun to emerge in the US equity market. In response to the fresh wave of tariff-related headlines, the major indices moved lower. Leading the decline — and posting the worst performance among S&P 500 constituents — were shares of Tesla (TSLA). The sell-off followed news of a new initiative by Elon Musk, who now appears serious about launching a political “America Party” to challenge both the Republicans and Democrats.
Trump criticised his former ally’s move on his Truth Social platform, and investors are increasingly concerned about the potential impact on Tesla’s business. Tesla shares (TSLA) fell by more than 6.5% yesterday, accompanied by a broad bearish gap.
Technical Analysis of Tesla (TSLA) Stock Chart
On 2 July, our technical outlook for TSLA anticipated the formation of a broad contracting triangle in the near term. Yesterday’s price action appears to confirm this scenario:
→ The sharp move highlighted the lower boundary of the triangle (marked in red);
→ The $317 level — where the previously rising channel (marked in blue) was broken — acted as resistance.
It is worth noting that during yesterday’s session, TSLA did not fall further following the gap down. In other words, the bears were unable to extend the sell-off, suggesting that the stock may attempt a recovery towards the $317 level. This area could potentially act as a central axis within the developing triangle pattern.
This article represents the opinion of the Companies operating under the FXOpen brand only. It is not to be construed as an offer, solicitation, or recommendation with respect to products and services provided by the Companies operating under the FXOpen brand, nor is it to be considered financial advice.

TSLA · Potential Double-Top Breakdown Idea Toward $255 → $225Rounded / double-top: Two rounded peaks formed at ≈ $335-340 with a clean neckline at $295-297 (yellow arcs on my chart).
Break confirmed: Friday’s candle closed below the neckline on above-average volume, triggering the pattern.
Measured-move math: Height of the top (≈ $40) projected beneath the neckline points to $255 for a full 100 % target.
Volume-profile “void”: VPVR shows a sharp volume vacuum between $260 and $230; once below $260, price often “slides” quickly to the next demand shelf around $225-230 — my purple “1st-target” box.

TSLA Options GEX Outlook: Bearish Pressure with Limited Support The GEX (Gamma Exposure) chart signals heavy PUT-dominant sentiment:
* Highest Negative NetGEX / PUT Support is stacked tightly around 295, with major Put Walls between 290 and 275.
* GEX clusters:
* -98.4% at $285
* -74.9% at $280
* -46% at $270
* On the upside, CALL resistance begins around 310–320, with GEX cooling off at 330.
🔍 Interpretation:
* Market makers are likely to hedge against upward price moves, increasing resistance near 310–320.
* Downside movement toward 285–280 could accelerate gamma momentum, causing a potential drop toward 270.
📉 Options Setup Suggestion:
* If price rejects at $297–300, buying PUTS (1–2 DTE) with target at 285 could benefit from GEX tailwinds.
* Avoid CALLs unless price breaks above 310 with volume.
TSLA 1-Hour Chart Technicals: Compression & Reaction Zone at Key Structure
The 1H chart shows:
* A recent Change of Character (ChoCH) and Break of Structure (BOS) near 290–295, indicating an attempt to reverse short-term bearish trend.
* Price is consolidating within a small demand zone (green box) and trying to retest the 295–297 region.
* However, TSLA remains under a macro downtrend with the descending channel intact.
🎯 Key Zones:
* Resistance: $297 → $305 → $310
* Support: $288.77 (LTF BOS) → $285 → $280
* Volume shows weak bullish momentum so far, not strong enough to push through resistance decisively.
⚠️ Trade Setup Ideas:
* PUT Scenario: If price fails to reclaim 297, consider entering near 296–297 with stop above 300. Target: 288 → 285.
* CALL Scenario (Risky): Only consider Calls above close + hold over 300, aiming for 310 with tight stop below 297.
🧠 Final Thoughts:
* Bias: Bearish to Neutral until price shows strong reclaim above 300.
* GEX setup favors PUT plays, especially on weakness below 295.
* If shorting, watch for reaction at 285 — this is the last solid gamma level before an air pocket to 270.
* Stay nimble, use stops, and respect trendline pressure overhead.
Disclaimer: This analysis is for educational purposes only and does not constitute financial advice. Always do your own research and manage your risk before trading.

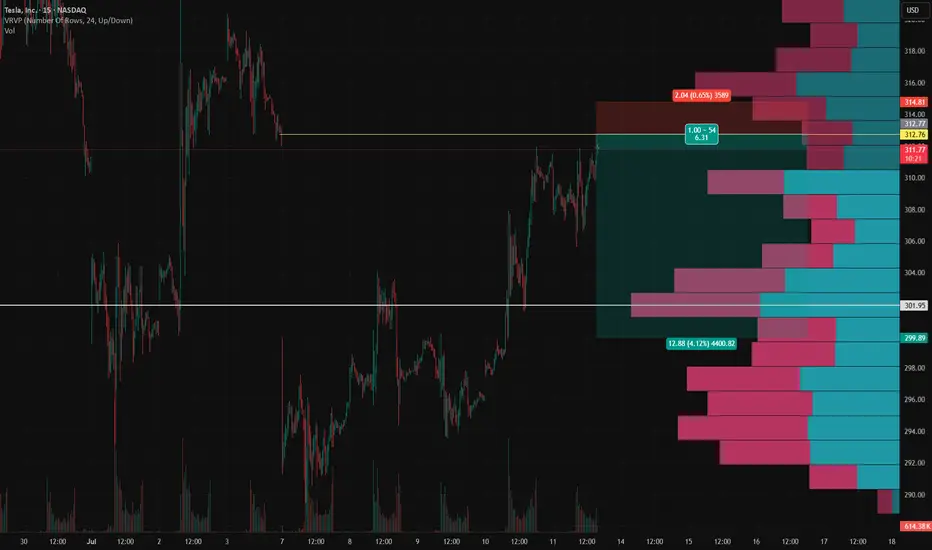
TSLA Short Setup – Fading the July 7 Gap FillTSLA Short Setup – Fading the July 7 Gap Fill 📉
This short idea on TSLA builds off a key gap fill from Monday, July 7 , combined with a strong local volume profile and risk-reward alignment on the 15-minute chart.
Entry: $312.76
Stop Loss: $314.81 (above gap resistance and local high)
Target: $299.89 (gap base and volume shelf)
RR: ~6.3R
Why I'm shorting here:
TSLA has just filled the July 7 gap , which often acts as a technical resistance zone on retest.
Price stalled right as it completed the fill — with visible hesitation and selling pressure stepping in.
VRVP shows low liquidity above, suggesting diminished reward for upside continuation.
Below, there's a clean volume shelf around $294–$300 that could attract price if weakness confirms.
Trade Logic:
This is a classic fade-the-gap-fill setup, targeting the lower edge of the volume cluster for a potential bounce or reversal zone.
As always: size accordingly, stick to the stop, and don’t chase if the entry’s already gone.
Thoughts? Anyone else watching this gap level?