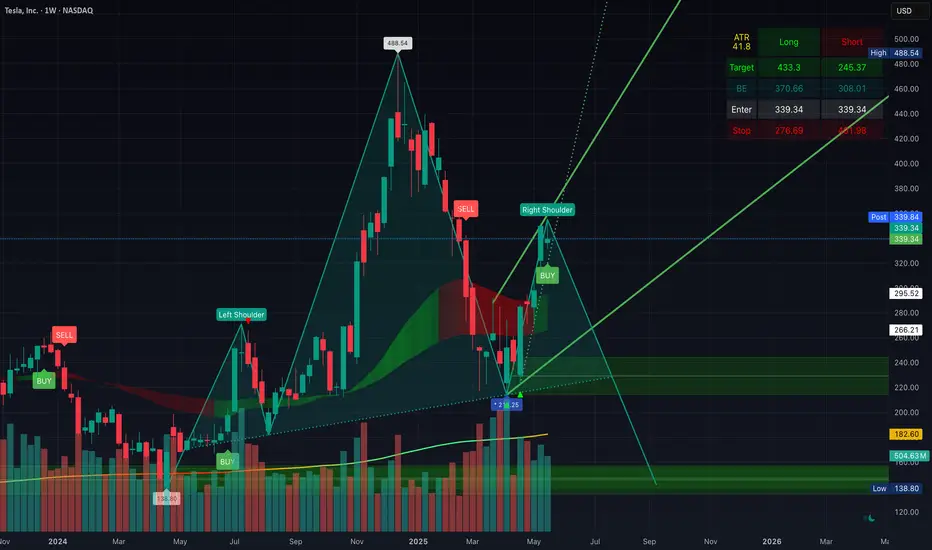
Potential Head & Shoulder Forming On The WeeklyPotential Head & Shoulder Forming On The Weekly... Facing still resistance at the $350 area, and should retest support at $280 within the coming days/weeks. If 280 breaks, should retest $240 (the h&s neckline) and could crash to $100 if that doesn't hold.
Time to take profit/hedge imo
0R0X trade ideas
TESLA RECOVERY AHEAD|LONG|
✅TESLA lost more than 25%
On the Elon VS Trump fallout
In less than a week which is
Seen by many as an excellent
Opportunity to add TESLA stocks
To their portfolios with a great
Discount which is why we are
Already seeing a nice rebound
From the wide strong horizontal
Support just above 270$ level
And as we are locally bullish
Biased we will be expecting
Further growth on Monday
LONG🚀
✅Like and subscribe to never miss a new idea!✅
Disclosure: I am part of Trade Nation's Influencer program and receive a monthly fee for using their TradingView charts in my analysis.

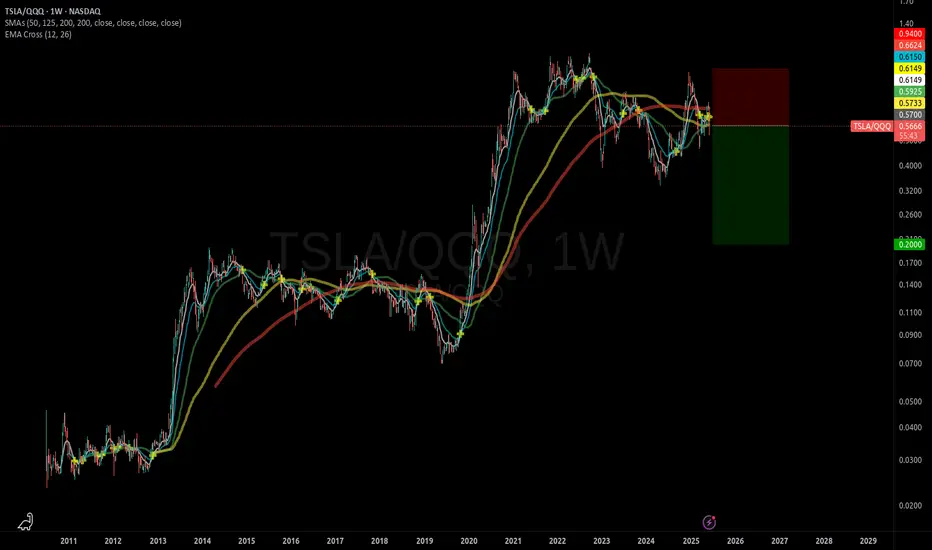
Short TSLA, Long QQQTSLA is expected to under-perform the QQQ ETF.
Whether it goes up or down in price, this trade will make money as long as the Nasdaq-100 index is stronger than TSLA.
VERY WIDE stop-loss is required.

$TSLA - Time to BUY (F to sellers)When weak hands sell in fear, we proudly buy.
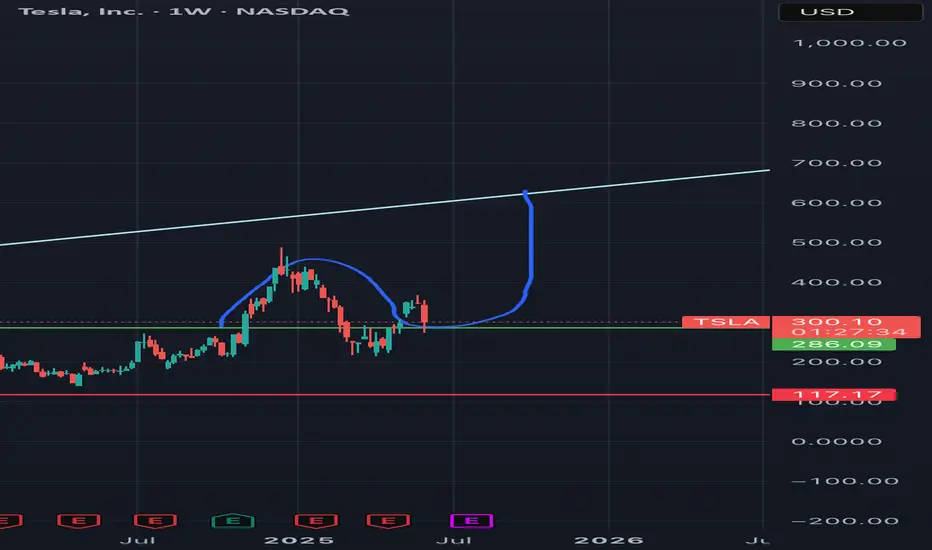
Tesla is at the perfect spot for buying right now, both from fundamental and technical sides. The recent fight between Elon & Trump granted so much needed correction to the chart. The price is resting on the $260 - $280 support now - ideal spot for buying before the massive blast off will happen.
A few technical factors: there is a HUGE ascending triangle with horizontal resistance ($415), the 3rd approach of this resistance should be final before the breakout happens! Moreover, the price is steadily forming a bullish pennant that will help in breaking the resistance up.
The overall trend is strictly bullish according to Fibo. The target of this upward movement is located in the $900 - $1000 zone which is x4 from current points. Not very often in our century you get such an opportunity.
You may have different opinions about Elon Musk, but you can't deny the fact he is brilliant businessman and entrepreneur. You can already see that "Tesla owners are scrambling to remove their anti Elon stickers from their car now that he is feuding with Trump" . Elon is a good-guy for liberals again, while republicans didn't change their positive attire regarding his company as well.
I tend to believe that all those news we witnessed yesterday (mean Elon&Trump fight) was just a part of a bigger plan , the outcome of which we will see later this year or even next year.

$BULLISH STRATEGY - SIMPLE BUT OFTEN USEFUL !This simple Strategy says when a trend has been shaped already the Second time which price hits the channel would be the most powerful wave can break even a static level !

TESLA Is it a good buy after the Trump - Musk clash?Tesla (TSLA) lost $150 billion yesterday, closing the session down by -14%, following President Trump's public feud with its CEO Elon Musk. Trump responded to Musk' criticism over the new tax bill, claiming that Musk was upset because the bill takes away tax benefits for electric vehicle purchases.
The obvious question that arises for investors is this: Is Tesla still a buy?
Quick answer? Yes. And once the dust from the fundamentals/ news settles, the technical patterns will prevail.
The long-term pattern since the January 03 2023 bottom has been a Channel Up. The recent April 07 2025 Low has been a Higher Low on this pattern as, even though it didn't touch the Channel's bottom, it did triple bottom on the 0.236 Fibonacci Channel retracement level.
This kick-started the new Bullish Leg of the pattern and yesterday's correction may be nothing more than the start of a Bull Flag formation, similar to those that took place half-way through both previous Bullish Legs.
You can even see how similar the 1W RSI patterns are among the 3 fractals, which have been Accumulation Phases before the start of the 2nd part of the Bullish Leg.
Even though the 1.618 Fibonacci extension is a technical possibility, we can settle for a $600 Target, which would fulfil the conditions of keeping the price action within the Channel Up by the end of the year.
-------------------------------------------------------------------------------
** Please LIKE 👍, FOLLOW ✅, SHARE 🙌 and COMMENT ✍ if you enjoy this idea! Also share your ideas and charts in the comments section below! This is best way to keep it relevant, support us, keep the content here free and allow the idea to reach as many people as possible. **
-------------------------------------------------------------------------------
💸💸💸💸💸💸
👇 👇 👇 👇 👇 👇

Will Tesla keep dropping?Tesla's stock experienced a significant decline of 14% yesterday, primarily due to a public feud between CEO Elon Musk and President Donald Trump. This dispute has raised concerns about potential government actions that could adversely affect Tesla's operations.
The conflict began when Musk criticized a proposed tax and spending bill, labeling it a "disgusting abomination." In response, President Trump threatened to terminate federal contracts with Musk's companies, including Tesla and SpaceX. This escalation led to a sharp drop in Tesla's stock price, erasing over $150 billion in market value and removing the company from the $1 trillion market capitalization club.
Technical analysis indicates that Tesla's stock broke below key support levels, including its 50- and 200-day moving averages, suggesting a potential continuation of the downtrend. Analysts have identified support levels at $265, $215, and $170, with resistance around $365.
Despite the recent turmoil, some analysts remain optimistic about Tesla's long-term prospects. Dan Ives of Wedbush Securities maintains a bullish outlook, citing upcoming innovations like Tesla's robotaxi service as potential growth drivers.
However, challenges persist. Tesla faces declining sales in Europe, increased competition from companies like BYD, and potential regulatory hurdles stemming from Musk's political engagements.
-Disclaimer: This analysis is for informational and educational purposes only and does not constitute financial advice, investment recommendation, or an offer to buy or sell any securities. Stock prices, valuations, and performance metrics are subject to change and may be outdated. Always conduct your own due diligence and consult with a licensed financial advisor before making investment decisions. The information presented may contain inaccuracies and should not be solely relied upon for financial decisions. I am not personally liable for your own losses, this is not financial advise.

Tesla Update Longs and shorts At the start of the video I recap my previous video and then bring us up to date with the present price action .
In this video I cover Tesla from the higher time frame and breakdown both a long term bullish scenario as well as a local bearish scenario .
Both of these scenarios present longs and short entries for day trade opportunities and swing positions .
Tools used Fibs , TR pocket , Volume profile , Pivots , and vwap .
Any questions ask in the comments
Safe trading and Good luck

TESLA JUN 2025Tesla ( NASDAQ:TSLA ) rejected from the $305–$350 resistance zone after a strong rally.
Price is now testing the lower end of the previous breakout range, with potential for deeper retracement.
Below $305, the next key support lies in the $250–$220 accumulation zone, where $23B was previously bought.
If this level breaks, watch for possible institutional defense at $200 and $180 weekly, where large orders are sitting.
On the upside, a confirmed breakout above $350 could open the path toward the target zone at $500, although strong resistance is expected between $500–$550, where $55B was previously sold.
#TSLA #Tesla #StockMarket #Trading #VolumeProfile #TechnicalAnalysis #WallStreet
#globaltrade #investment #investing #stockmarket #wealth #realestate #markets #economy #finance #money #forex #trading #price #business #currency #blockchain #crypto #cryptocurrency #airdrop #btc #ethereum #ico #altcoin #cryptonews #Bitcoin #ipo

Tesla Drop to the downside update In this video I recap what happened in the latest drop on Tesla and how we anticipated this move some 4 days ago .
I cover whats possibly next for tesla looking forward .
This video also covers a HTF perspective on the direction of Tesla .
Any questions ask in comments
Thanks for your support

TSLA at an inflection pointNASDAQ:TSLA weekly chart shown wirh Mcginley indicator (a trend following indicator) and cycle oscillator. Whilst price currently shows a negative bias, I believe price has reached an inflection point as the market seeks direction. Those waiting to buy the dip should wait patiently for entry opportunities upon confirmation of momentum and volume.

TSLA Oversold Bounce Setup – Targeting $300 Max Pain Zone🚗 TSLA Oversold Bounce Setup – Targeting $300 Max Pain Zone 🔥
📅 Signal Date: June 5, 2025 | ⏳ Duration: 5–10 Day Swing
🎯 Objective: Play oversold bounce into heavy open interest at $300
📊 Multi-Model Insight Summary
Model Bias Strategy Strike Entry Target Stop Confidence
Grok Mod. Bullish Buy Call 290 34.00 40.80 17.00 75%
Claude Mod. Bullish Buy Call 290 34.00 50.00–65.00 20.00 75%
DeepSeek Mod. Bullish Buy Call 300 26.65 32.00 20.00 75%
Gemini Neutral/Stand Aside No Trade — — — — 45%
Llama Mod. Bearish Buy Put 280 3.30 1.65 3.30 75%
🔎 Technical & Sentiment Snapshot
15-Min RSI: Extremely oversold → Mean-reversion potential
Daily/Weekly: Neutral, but nearing key support zones
Price Action: 5-day sharp drop into $280–$285 area
Max Pain: $300 → potential gravitational magnet for bounce
Sentiment: News uncertainty (Musk/Trump noise) but positioning supports upside
IV Rank: Elevated — options rich but supported by move potential
🎯 Trade Setup – Long TSLA Call
Instrument: TSLA
Direction: CALL (LONG)
Strike: $290.00
Expiry: 2025-06-20
Entry Price: $34.00
Profit Target: $40.80 (20% premium gain)
Stop Loss: $17.00 (50% premium loss)
Size: 1 contract
Entry Timing: Market open
Confidence Level: 70%
⚠️ Risk Management Notes
🔻 Premium decay: Watch theta decay closely, especially if no bounce by day 5
🚫 Technical breach: Close trade if $280–$285 breaks on strong volume
💣 Headline risk: Musk-related catalysts or macro shifts can swing direction rapidly
⏳ Time Exit Rule: Consider exiting by June 14 if trade hasn’t reached target
🧠 Trade Rationale
TSLA’s sharp pullback into oversold territory alongside strong call OI at $300 sets the stage for a short-term relief bounce. Multiple models support the call play, with a focus on a 5–10 day recovery swing.

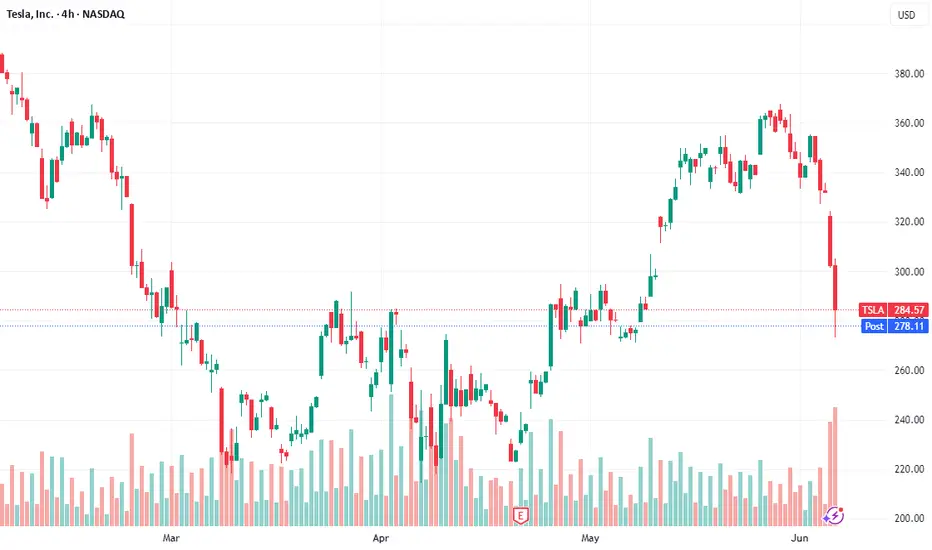
Tesla Recovers After Announcement of Trump–Musk DialogueBy Ion Jauregui – Analyst at ActivTrades
After a session marked by a sharp decline, Tesla shares rebounded strongly in after-hours trading. The catalyst: a *Politico* report revealing that President Donald Trump’s advisors have scheduled a phone call with Elon Musk for today, Friday, in an effort to ease tensions following a public dispute between the two figures. On Thursday, Tesla suffered one of its worst declines of the year, plunging 14.26% and wiping out more than \$150 billion in market value within hours. This brings the quarterly loss to 25.70%. However, news of a potential reconciliation pushed the stock back into positive territory, closing at \$288.35 with a 2.31% recovery, sparking speculative after-hours trading that could extend into the week’s final session.
The clash erupted after Musk criticized a new tax cut bill championed by the White House. Trump promptly responded by threatening to reassess federal contracts awarded to Musk's companies, such as SpaceX. Tensions escalated further when Musk, via social media, hinted at alleged ties between Trump and the late financier Jeffrey Epstein.
According to *Politico*, although Trump has publicly projected an air of indifference, his advisors have been working behind the scenes to de-escalate the feud and avoid broader political and economic fallout. The scheduled call on Friday may mark the beginning of a truce.
It’s worth recalling that during his tenure at the Department of Government Efficiency (DOGE) under Trump’s administration, Elon Musk faced accusations of conflicts of interest, particularly for pushing deregulatory policies that directly benefited Tesla and SpaceX. These actions triggered public protests, the "Tesla Takedown" boycott movement, and investor concerns over Musk's divided attention—ultimately harming Tesla’s reputation and market valuation.
Tesla Under the Microscope: Between Market Rebound and Financial Pressure
The technical rebound has offered investors some relief, but Tesla’s challenges extend beyond the political arena. As of 2025, the stock is down nearly 25% amid shrinking global EV demand, intensified competition, and margin pressure. In its Q1 2025 earnings report, Tesla posted \$21.3 billion in revenue, down 5% year-on-year. Net income also fell to \$1.04 billion, dragged by an aggressive discount strategy and rising operational costs. Gross margin declined to 17.2%, while free cash flow stood at \$620 million. Despite these headwinds, the company maintains a strong financial position, with \$22 billion in cash and \$7.8 billion in total debt. Tesla currently trades at a price-to-earnings ratio of 56, well above the industry average, reflecting high—though increasingly questioned—growth expectations.
Technical Outlook: Key Support Level in Sight
From a technical perspective, Tesla has found crucial support around the \$271.22 level. This bounce aligns with the beginning of a bearish consolidation cross seen on Wednesday. If the 200-day moving average remains below the 100-day and the 50-day adjusts downward, further bearish momentum could ensue. A break below this level may lead to a decline toward \$250. Conversely, a sustained recovery could push the stock toward the previous control point at \$361.93, though not before consolidating around the \$320 resistance zone. The RSI shows clear signs of extreme overselling at 19%, potentially signaling the door to an upward move.
In the short term, everything hinges on the outcome of today’s Trump–Musk conversation, which markets will be watching very closely.
Conclusion
The clash between Musk and Trump has left visible scars on the market. While a possible rapprochement may open a window for stabilization, Tesla’s financial and technical fundamentals reveal ongoing challenges. Any recovery could prove as volatile as the leadership surrounding it.
*******************************************************************************************
The information provided does not constitute investment research. The material has not been prepared in accordance with the legal requirements designed to promote the independence of investment research and such should be considered a marketing communication.
All information has been prepared by ActivTrades ("AT"). The information does not contain a record of AT's prices, or an offer of or solicitation for a transaction in any financial instrument. No representation or warranty is given as to the accuracy or completeness of this information.
Any material provided does not have regard to the specific investment objective and financial situation of any person who may receive it. Past performance is not reliable indicator of future performance. AT provides an execution-only service. Consequently, any person acting on the information provided does so at their own risk.

Tesla Monthly TF (Next Target —110-140)I will not bore you with too many details. I will do an analysis based on the moving averages to support my bias, bearish at this point.
April 2024 tests EMA89 as support and this support level holds. This results in a bullish impulse.
The impulse ends December 2024. On the drop, TSLA founds support at EMA55 monthly. There is bounce at this level and this bounce ends as a lower high.
» When this happens, the next moving average in line gets tested, in this case EMA89 or a minimum of 191 as the next target.
EMA55 monthly sits at 229.88 (230). This level will fail as support, why? Because the test of it in March and April led to a lower high and this lower high will be followed by a lower low.
If TSLA had moved higher than December 2024, then any drop or correction would not go below EMA55. Since the action is ending as a lower high, then the next drop which is already underway will break through this level.
The main level for the current move sits around 110-140 based on the long-term. These levels are close to the lows in January 2023 and December 2022.
Technical analysis can help you predict a move regardless of its cause. Don't believe me? See the 'related publications'.
Thanks a lot for your continued support.
Namaste.

Tesla Daily, Update (Bearish Trend Extends)Today TSLA produced the highest bearish volume session since July 2020. This high volume and strong sellers pressure shows up to break EMA55, EMA89 and MA200 daily as support. Needless to say, this is a very strong bearish development.
The break of this long-term support comes after a major lower high. May 2025 much lower compared to December 2024.
My point is to alert you of a much stronger correction than expected on this stock. Now that MA200 has been lost as support, with the highest volume in five years after a strong lower high, we can expect the continuation of the bearish trend.
I will look at Tesla on the monthly timeframe in a separate publication.
Thank you for reading.
Namaste.

TESLA PRICE ACTION JUNE 5TH 2025Welcome to Tesla weekly &there is a news about Elon going against the bill from trump.
I will never buy their news as they are manipulating retailers.
I am buying & I have discussed all the important levels here,
If you have any doubts, feel free to leave your comments here.

Tesla Still Slightly Bearish Until FED Cuts RatesOne of my followers asked, "how about now?"
The question comes because he is bullish and I am sharing bearish charts.
Here is the thing, the chart is still bearish of course because of the red candles and the double-top. This can't change unless the last high is broken with significant rising volume.
I'll make it easy. This stock is likely to continue bearish until after the Federal Reserve cuts interest rates. When they lower the stuff, they do their magic their numbers then the market will turn bullish. So bearish before, bullish after. And this is a classic dynamic.
The market goes through a retrace or correction preceding a major bullish development. Since the bullish development will definitely push prices up, the market must express its bearish tendencies before the event shows up.
So bearish now. When the Fed announces that they are reducing interest rates later this month, then 100% bullish I agree of course.
Thanks a lot for your continued support.
This same analysis applies to Bitcoin and all related markets.
The altcoins though are a different thing because these are smaller and already trading at bottom prices. They will recover sooner and will start moving ahead of the pack revealing what is coming to the bigger ones.
All is good.
Thank you for reading.
Namaste.

TSLA Going below 300?Seen head and shoulder on TSLA daily , can we get break and gap fill below 312? 300- 295 ish is target . Lets see

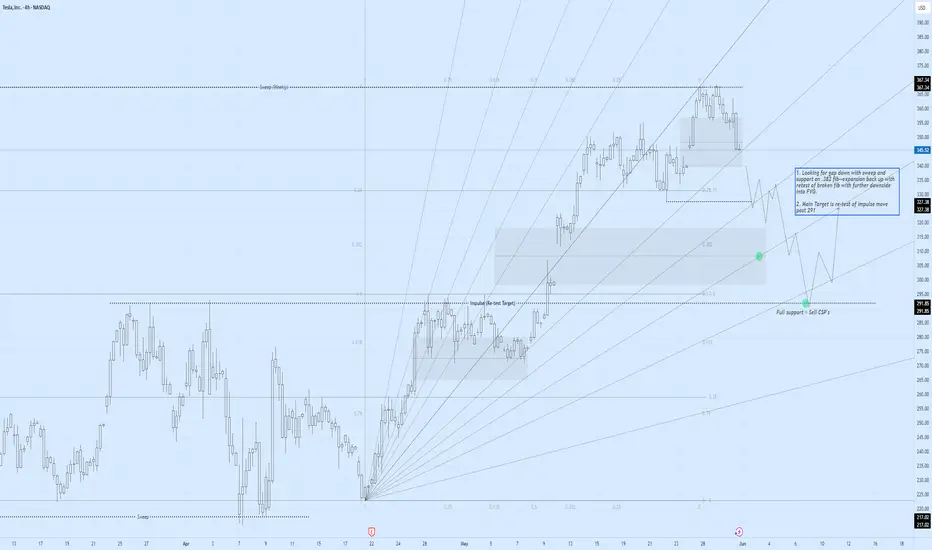
TSLA Descent 4-hr OutlookTSLA Descent!
1. Looking for gap down with sweep and support on .382 fib--expansion back up with retest of broken fib with further downside into FVG.
2. Main Target is re-test of impulse move (291 level).
-- take into consideration TSLA moves 29 points weekly (avg).
3. Full support = selling CSP's 14+ days out.
Tesla's Perfect Storm: A $152 Billion MeltdownTesla's Perfect Storm: A $152 Billion Meltdown, Chinese Rivals on the Attack, and a Faltering Shanghai Fortress
A tempest has engulfed Tesla, the electric vehicle behemoth, wiping a staggering $152 billion from its market capitalization in a single day. This monumental loss, the largest in the company's history, was triggered by a dramatic and public feud between CEO Elon Musk and former U.S. President Donald Trump. The confrontation, however, is but the most visible squall in a much larger storm. Lurking just beneath the surface are the relentless waves of competition from Chinese automakers, who are rapidly eroding Tesla's dominance, and the ominous sign of eight consecutive months of declining shipments from its once-impenetrable Shanghai Gigafactory.
The confluence of these events has plunged Tesla into a precarious position, raising fundamental questions about its future trajectory and its ability to navigate the turbulent waters of a rapidly evolving automotive landscape. The narrative of Tesla as an unstoppable force is being rewritten in real-time, replaced by a more complex and challenging reality.
The Trump-Musk Spat: A Bromance Turned Billion-Dollar Blow-Up
The relationship between Elon Musk and Donald Trump, once a seemingly symbiotic alliance of power and influence, has spectacularly imploded, leaving a trail of financial and political wreckage in its wake. The public falling out, which played out in a series of scathing social media posts and public statements, sent shockwaves through Wall Street and Washington, culminating in a historic sell-off of Tesla stock.
The genesis of the feud lies in Musk's vocal criticism of a sweeping tax and spending bill, a cornerstone of the Trump administration's second-term agenda. Musk, who had previously been a vocal supporter and even an advisor to the President, lambasted the legislation as a "disgusting abomination" filled with "pork." This public rebuke from a figure of Musk's stature was a direct challenge to Trump's authority and legislative priorities.
The President's response was swift and sharp. In an Oval Office meeting, Trump expressed his "disappointment" in Musk, questioning the future of their "great relationship." The war of words then escalated dramatically on their respective social media platforms. Trump, on his social media platform, threatened to terminate Tesla's lucrative government subsidies and contracts, a move that would have significant financial implications for Musk's business empire. He also claimed to have asked Musk to leave his advisory role, a statement Musk labeled as an "obvious lie."
Musk, in turn, did not hold back. On X (formerly Twitter), he claimed that without his substantial financial support in the 2024 election, Trump would have lost the presidency. This assertion of his political influence was a direct jab at the President's ego and a stark reminder of the financial power Musk wields. The spat took an even more personal and inflammatory turn when Musk alluded to Trump's name appearing in the unreleased records of the Jeffrey Epstein investigation.
The market's reaction to this public spectacle was brutal. Tesla's stock plummeted by over 14% in a single day, erasing more than $152 billion in market capitalization and pushing the company's valuation below the coveted $1 trillion mark. The sell-off was a clear indication of investor anxiety over the political instability and the potential for tangible financial repercussions from the feud. The incident underscored how intertwined Musk's personal and political activities have become with Tesla's financial performance, a vulnerability that has been a recurring theme for the company.
The Chinese Dragon Breathes Fire: Tesla's EV Dominance Under Siege
While the political drama in Washington captured headlines, a more fundamental and perhaps more enduring threat to Tesla's long-term prosperity is brewing in the East. The Chinese electric vehicle market, once a key engine of Tesla's growth, has become a fiercely competitive battleground where a host of domestic rivals are not just challenging Tesla, but in some aspects, surpassing it.
Companies like BYD, Nio, XPeng, and now even the tech giant Xiaomi, are relentlessly innovating and offering a diverse range of electric vehicles that are often more affordable and technologically advanced than Tesla's offerings. This intense competition has led to a significant erosion of Tesla's market share in China. From a dominant position just a few years ago, Tesla's share of the battery electric vehicle market has fallen significantly.
One of the key advantages for Chinese automakers is their control over the entire EV supply chain, particularly in battery production. This allows them to produce vehicles at a lower cost, a crucial factor in a price-sensitive market. The result is a growing disparity in pricing, with many Chinese EVs offering comparable or even superior features at a fraction of the cost of a Tesla.
Furthermore, Chinese consumers are increasingly viewing electric vehicles as "rolling smartphones," prioritizing advanced digital features, connectivity, and a sophisticated user experience. In this regard, many domestic brands are seen as more innovative and in tune with local preferences than Tesla. This shift in consumer sentiment has been a significant factor in the declining interest in the Tesla brand in China.
The numbers paint a stark picture of Tesla's predicament. While the overall new-energy vehicle market in China continues to grow at a remarkable pace, Tesla's sales have been on a downward trend. This is a worrying sign for a company that has invested heavily in its Chinese operations and has historically relied on the country for a substantial portion of its global sales.
The pressure on Tesla's sales in China is so intense that its sales staff are working grueling 13-hour shifts, seven days a week, in a desperate attempt to meet demanding sales targets. The high-pressure environment has reportedly led to high turnover rates among sales staff, a clear indication of the immense strain the company is under in this critical market.
The Shanghai Gigafactory: A Fortress with a Faltering Gate
The struggles in the Chinese market are reflected in the declining output from Tesla's Shanghai Gigafactory. For eight consecutive months, shipments from the factory, which serves both the domestic Chinese market and is a key export hub, have seen a year-on-year decline. In May 2025, the factory delivered 61,662 vehicles, a 15% drop compared to the same period the previous year.
This sustained decline in shipments is a significant red flag for several reasons. Firstly, the Shanghai factory is Tesla's largest and most efficient production facility, accounting for a substantial portion of its global output. A slowdown in production at this key facility has a direct impact on the company's overall delivery numbers and financial performance.
Secondly, the declining shipments are a direct consequence of the weakening demand for Tesla's vehicles in China. Despite being a production powerhouse, the factory's output is ultimately dictated by the number of cars it can sell. The falling shipment numbers are a clear indication that the company is struggling to maintain its sales momentum in the face of fierce competition.
The situation in China is a microcosm of the broader challenges facing Tesla. The company's product lineup, which has not seen a major new addition in the affordable segment for some time, is starting to look dated compared to the rapid product cycles of its Chinese competitors. The refreshed Model 3 and Model Y, while still popular, are no longer the novelties they once were, and are facing a growing number of compelling alternatives.
A Confluence of Crises: What Lies Ahead for Tesla?
The convergence of a high-profile political feud, intensifying competition, and production headwinds has created a perfect storm for Tesla. The company that once seemed invincible is now facing a multi-front battle for its future.
The spat with Trump, while seemingly a short-term crisis, has exposed the risks associated with a CEO whose public persona is so closely tied to the company's brand. The incident has also highlighted the potential for political winds to shift, and for government policies that have benefited Tesla in the past to be reversed.
The challenge from Chinese automakers is a more fundamental and long-term threat. The rise of these nimble and innovative competitors is not a fleeting trend, but a structural shift in the global automotive industry. Tesla can no longer rely on its brand cachet and technological lead to maintain its dominance. It must now compete on price, features, and innovation in a market that is becoming increasingly crowded and sophisticated.
The declining shipments from the Shanghai factory are a tangible manifestation of these challenges. The factory, once a symbol of Tesla's global manufacturing prowess, is now a barometer of its struggles in its most important market.
To navigate this storm, Tesla will need to demonstrate a level of agility and adaptability that it has not been required to show in the past. This will likely involve a renewed focus on product development, particularly in the affordable EV segment, to better compete with the value propositions offered by its Chinese rivals. It will also require a more nuanced and strategic approach to the Chinese market, one that acknowledges the unique preferences and demands of Chinese consumers.
The coming months will be a critical test for Tesla and its leadership. The company's ability to weather this storm and emerge stronger will depend on its capacity to innovate, to compete, and to navigate the complex and often unpredictable currents of the global automotive market. The era of unchallenged dominance is over. The battle for the future of electric mobility has truly begun.
congrats to tesla longs! boost and follow for more ❤️🔥 in my last tesla update in early april I mentioned the break of trend resistance, and how that resistance acted as support.. how this meant the bottom was likely in. lots of people doubted this, but here we are a few months later at my short term targets 🎯
now we are sitting at a important trend support that has held since april, a break below can send us to 290-300 before the next push higher.. if we hold here and start to rally it might go straight to my next target around 430..
whether it breaks or holds, I think 430 will get hit soon enough.. I am wearing a tesla shirt as a write this analysis hehe.. 🤣 I will see you soon with more updates, I am done for today! felt good to post some stuff after being gone for over a month.
