Apple Stock in 10 years perspective: Stability or New Heights?The future of Apple stock remains a hot topic among investors and analysts. For today’s July, the company’s market capitalization has climbed to $3 trillion, up from $2.9 trillion (a year ago, on May 2024). But can this tech giant continue to deliver significant returns for shareholders over the next decade? Let’s take a quick look on it.
AI’s Take on the Future
Recently, ChatGPT highlighted Apple NASDAQ:AAPL as a top contender among stocks poised to generate substantial wealth by 2035, outranking peers like Microsoft NASDAQ:MSFT , Amazon NASDAQ:AMZN , and Nvidia NASDAQ:NVDA . The prediction has sparked curiosity, but what do real-world experts think?
Analyst Perspectives: Strengths and Challenges
Opinions on Apple’s outlook vary. On one hand, the company boasts a robust financial foundation, steady revenue from subscriptions, and substantial cash reserves. On the other hand, some analysts argue that its current share price is overstretched. Apple’s forward P/E ratio—based on projected earnings for the next 12 months—stands at 27, compared to the S&P 500’s near 22, suggesting investors are paying a premium for future growth.
Additionally, Apple faces mounting competition and regulatory pressures. The key question is whether it can maintain its edge in a fast-evolving tech industry.
Services and Devices
In recent years, Apple has leaned heavily into services like subscriptions and digital platforms, delivering high-margin and recurring revenue. Yet, its core business still hinges on device sales, particularly the well-known iPhone. Without groundbreaking new products, the company risks getting stuck in a cycle of incremental updates, potentially slowing its growth trajectory.
Financial Resilience
Despite these challenges, Apple’s financial metrics remain impressive. Its market cap has risen to $3 trillion, and it continues to generate significant free cash flow. The company also offers modest dividends, making it attractive for those people, who prefer and seek stable returns.
What to Expect from Apple by 2035?
Apple stands as one of the most dependable long-term investments, but we shouldn’t expect the explosive growth, just like it was at their early years. Of course iconic brand, loyal customer base, and adaptability— is a strong side and support its stability. But the high share price, competitive pressures, and reliance on certain hardware components may limit and slow down its upside.
Can Apple make you wealthy by 2035? It depends on your goals, risk tolerance and the size of your investment. For those seeking stability and modest gains, Apple is a solid pick. But if you’re chasing rapid wealth, you might need to look elsewhere for higher-risk opportunities.
0R2V trade ideas

Apple: Next Week’s Long Trade Opportunity with Upside PotentialCurrent Price: $213.55
Direction: LONG
Targets:
- T1 = $225
- T2 = $240
Stop Levels:
- S1 = $210
- S2 = $200
**Wisdom of Professional Traders:**
This analysis synthesizes insights from thousands of professional traders and market experts, leveraging collective intelligence to identify high-probability trade setups. The wisdom of crowds principle suggests that aggregated market perspectives from experienced professionals often outperform individual forecasts, reducing cognitive biases and highlighting consensus opportunities in Apple.
**Key Insights:**
Apple continues to lead the technology sector with sustained bullish momentum. Strong seasonal trends averaging 13.4% gains during July and August further underscore its upside potential. AI-driven product developments and its role in mega-cap leadership positions it for ongoing strength, though near-term overextension risks persist.
**Recent Performance:**
Apple gained 6% last week, spotlighting its dominance among mega-cap stocks as a leader of the broader tech rally. While the "Magnificent 7" stocks, including Nvidia and Tesla, showed mixed signals, Apple has preserved relative strength and upward momentum.
**Expert Analysis:**
Portfolio managers have expressed confidence in Apple as part of the "big three" tech stocks, favoring its innovation and operational strategies despite valuation concerns. The mixed sentiment, with mentions of potential put activity, suggests cautious optimism, but its breakout above $213 highlights stronger short-term opportunities.
**News Impact:**
Apple’s AI initiatives, such as outsourcing Siri's development, contribute positively to market sentiment. Additionally, anticipation of earnings season strength in late July adds weight to bullish strategies. As mega-cap stocks maintain leadership, Apple’s pivot into AI-driven innovation reinforces its critical role in technological advancement.
**Trading Recommendation:**
Based on robust performance trends, seasonal advantages, and a supportive macro backdrop, a LONG position on Apple offers strong upside potential with defined risk parameters.

$AAPL On The Run? NASDAQ:AAPL breaking out of the stage 1 and entering a stage 2 breakout back to prior support and resistance zones.
RSI is a little hot at 67.52 so it may trade sideways to allow a cooling off phase before grinding higher to reach its value. News is that it is investing in the USA.
Stop loss would be a trailing stop loss of $4.48.

AAPL LONG 05/07/2025Price has been moving inside a multi-year bullish tunnel, price has also broken a minor resistance level of 207$ with a nice bullish engulfing candle with some increase in volume on the last few daily candles.
Analysis HTF - Weekly
execution LTF - Weekly
Candle pattern - Bullish engulfing
Acceleration - Check
Volume - Check
Structure - Check
Moving average - X
Base rate - 70%(to hit stop loss)/30% to succeed
With the acceleration, volume pattern and strong multi year structure I suggest a base rate of 55%/45%(to succeed)
Good luck

Watch OutIf it breaks the 214 supply zone the next one to break is the 224 zone. I know most people would put stop loss around 193. However, that's where my smart money friend places his huge buy orders. He calls it the demand zone. Not financial advice.

AAPL // I used Fibonacci numbers. 144 is our ema support point. Let's look for closings above the green line for the trend.

The #1 Breakout Pattern Above The Engulfing Am thinking about the girl that broke my ❤️ heart two days ago.
We started arguing.She wanted me to do what she tells me.I didn't want that.
She wanted me to not talk.But I wanted to talk.It was the most immature interaction but I held my breathing.
It didnt go well she broke out in anger and told me "never come back here!"
My feelings are hurt.
The market has a break out moment.Right now the MACD Indicator on the weekly chart of 🍎 Apple stock
Is showing you a strong momentum and breakout pattern.
This chart has reached that moment of "anger". It will never come back to this price again.
Even the bearish engulfing has been left behind.
This is a real breakout above a very strong resistance represented by the candlestick pattern (BE).
🚀 Rocket Boost This Content To Learn More.
Disclaimer ⚠️ Trading is risky please learn about Risk Management And Profit Taking Strategies. Also feel free to use a simulation trading account before you use real money.

aapl just got great news, great stock! ATH coming?? YEA???aapl just got great news, great stock!
bullish. so very bullish
let us know!
free transparent no edit no delete
🐉We value full transparency. All wins and fails fully publicized, zero edit, zero delete, zero fakes.🐉
🐉Check out our socials for some nice insights.🐉
information created and published doesn't constitute investment advice!
NOT financial advice

AAPL Significant Event NASDAQ:AAPL
1. Bullish Breakout :
In the daily chart bullish breakout has been seen. If the bullish momentum is strong, the price may follow the upward.
2. Target Price : Potential target price 214
3. Risk Factors:
A. Failure to breakout the resistance 206
B. Sideways trend may be started.
C. Broader market weakness or correction
D. False Breakouts
---------------------
Note :
If you’re interested in receiving detailed technical analysis reports on your selected stocks, feel free to reach out to me. I can provide you with customized reports covering trends, key levels, momentum, patterns, and price projections to support your trading or investment decisions.

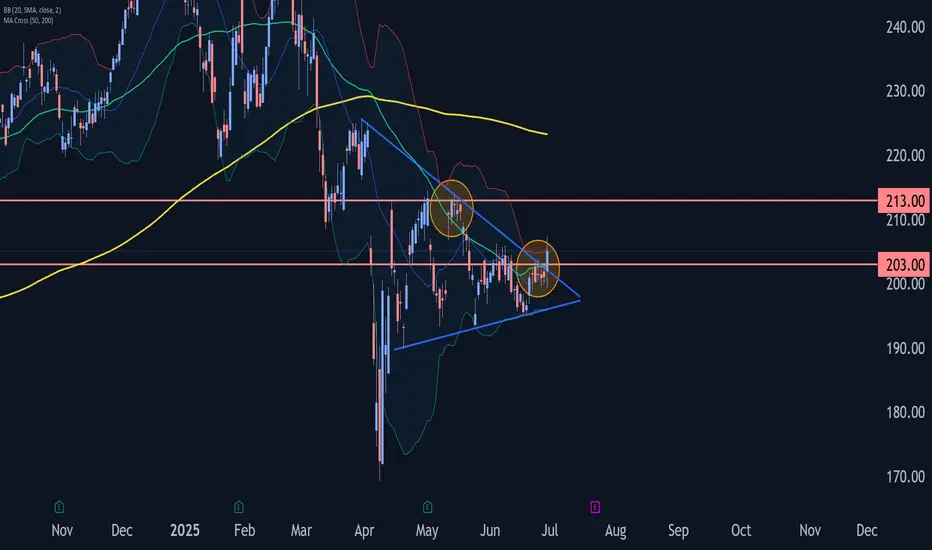
Apple Wave Analysis – 30 June 2025
- Apple broke resistance zone
- Likely to rise to resistance level 213.40
Apple recently broke the resistance zone between the resistance level 203.00 (which has been reversing the price from the start of June) and the resistance trendline of the daily Triangle from March.
The breakout of this resistance zone should add to the bullish pressure on Apple.
Apple can be expected to rise to the next resistance level 213.40, which reversed the previous waves (A), (C) and (2), as can be seen below.
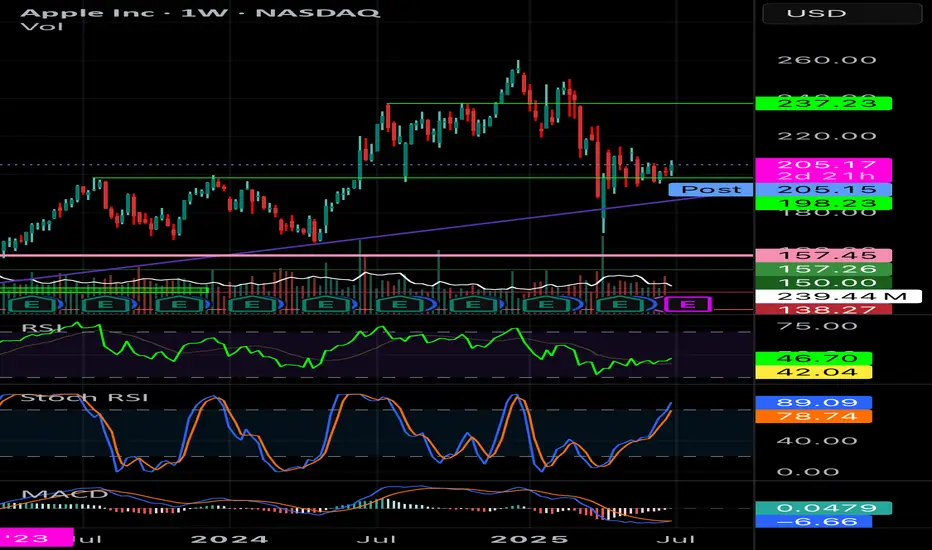
AAPL Weekly ChartOn the weekly chart, AAPL seems to find support on a previous resistance level after testing it several times. Macd has signaled a green as well. Seems optimistic.
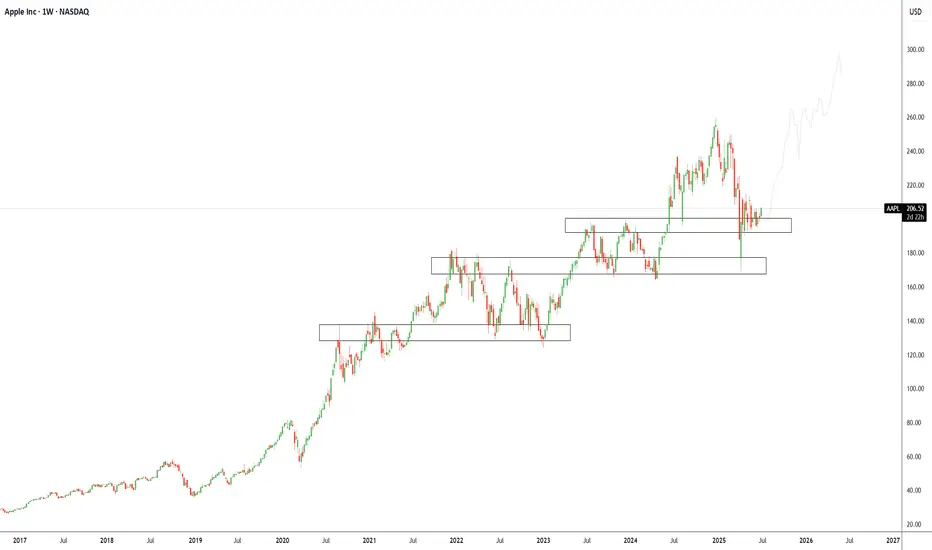
Apple Inc (APPL): Trend Continuation to $300+Overview Summary
We’ve added new long positions on Apple ( NASDAQ:AAPL ) recently after a textbook rejection from a well-established support/demand zone between $185–$200. This area has consistently acted as a launchpad for previous rallies and is now once again serving as a structural support on the weekly timeframe.
Apple’s ability to consistently innovate through product cycles, expand its services ecosystem, and integrate AI-driven features into its devices provides strong conviction for long-term upside. With Vision Pro, Apple Intelligence, and chip-level innovations underway, the company is positioning itself to benefit from both hardware and software expansion over the next decade.
Technically, the price has formed a multi-year stair-step structure with clear levels of accumulation. We believe NASDAQ:AAPL is beginning its next leg higher after consolidating above this zone. A clean move to retest all-time highs is likely, and a long-term target of $300 aligns with both trend structure and growth potential.
Green Zone Capital remains bullish on NASDAQ:AAPL with a long-term horizon and will continue to scale into strategic pullbacks within the broader uptrend, our current setup is:
Bias: Long
Type: Long-Term Accumulation
Entry Zone: $190–$205
Target: $300+
Invalidation: $165
Technical Analysis:
Apple is currently sitting at a critical demand zone that has historically acted as a base for previous multi-month rallies. Our TradingView chart highlights several key structural zones showing Apple’s tendency to build stair-step accumulation ranges followed by breakouts. The current zone between $185–$205 has been tested and held multiple times, confirming its significance.
We are seeing bullish rejection candles forming on the weekly timeframe, showing buyer interest is returning. This confluence of technical support and long-term structural demand confirms our long entry thesis.
Macro/Fundamental Thesis:
Apple remains one of the strongest tech companies globally with unmatched brand equity, pricing power, and integration across hardware, software, and services. The company continues to expand aggressively into AI with Apple Intelligence, spatial computing with Vision Pro, and strategic chip development.
With record cash reserves, a loyal consumer base, and continued innovation cycles across iPhone, Mac, and Services, Apple remains a strong defensive and offensive tech allocation in any long-term portfolio. Despite current macro volatility, Apple has consistently outperformed over market cycles.
$AAPL In ConsolidationNASDAQ:AAPL is consolidating here in a wedging pattern. I do not know which way this will resolve. But, since I rarely if ever short, I am looking on the long side of a trade. The thing I like about a consolidation pattern like this is, you know when you are wrong very quickly. My plan is to take a ¼ size long position if / when it moves above the 50 DMA (red) with a stop just below the most recent low (which would also correspond to dropping below the lower wedging trendline.
Then if it can break out over the upper downtrend line, I will look to build out my position. I thought this would be a good one to put on your watchlist. If you like the idea, please make it your own so that it fits within your trading plan.

AAPL : Technical Analysis Report - 29 June 2025
Trend:
The primary trend (big picture) is downward. Bearish momentum is weak.
Short Term Trend : sideways / consolidation. Momentum in sideways trends is usually weak and indecisive. Sideways within a long term downtrend is often a continuation pattern.
Reasons:
Market Uncertainty: Waiting for news, earnings, or macro events.
Accumulation/Distribution: Smart money prepares for the next move (either continuation or reversal).
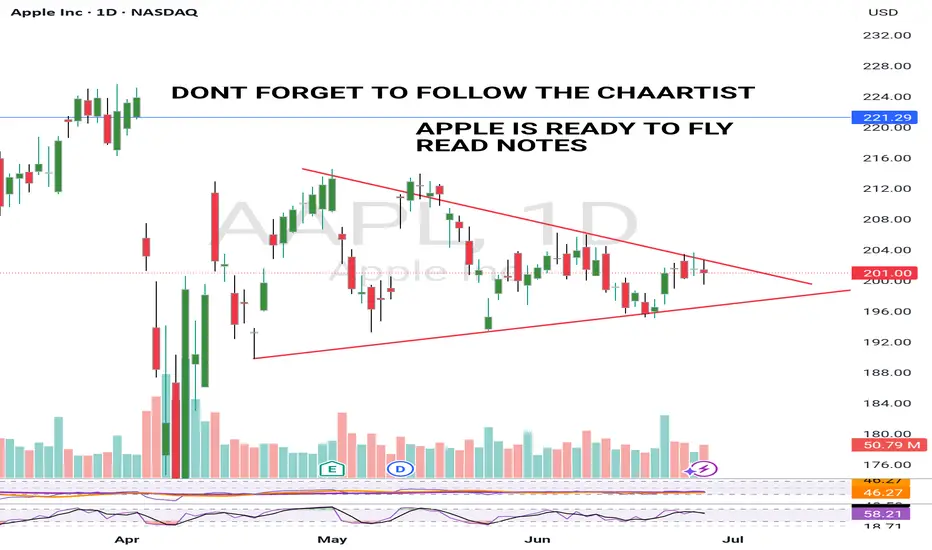
Pattern : Symmetrical Triangle Pattern
The pattern represents a temporary pause in the prevailing trend. The symmetrical triangle is considered a continuation pattern. This means that the price is likely to continue in the direction of the trend that preceded the triangle's formation. Neutral pattern until the breakout direction is confirmed.
Key levels :
R2 - 214
R1 - 206
S1 - 193
S2 - 186
Tips for Trading
Wait for a confirmed breakout (e.g., a daily candlestick close above/below the trendline) to avoid false signals
-----------------------
Note :
If you’re interested in receiving detailed technical analysis reports on your selected stocks, feel free to reach out to me. I can provide you with customized reports covering trends, key levels, momentum, patterns, and price projections to support your investment decisions.

Apple Consolidates Above $200 with Upside PotentialAAPL is trading sideways, consolidating above $200.0.
Resistance stands at $203.0, and if breached, Apple could rally toward $206.0.

Goes up to $220It is true that the trend is currently up and it is going to $210 and $220, but I expect it to react in these ranges and come down to $170.
But if you want to buy, it is better to wait for it to correct and come down to $170-180, then think about buying. It is too early to buy right now.

AAPL Inside a Coil – Big Move Loading from the $200 Zone 🧠 GEX-Based Options Sentiment:
Apple (AAPL) is caught between tight gamma compression and heavy resistance.
The $205–$207 zone is packed with GEX9 and multiple Call Walls. This is the key ceiling that has rejected price repeatedly over the past week. On the other side, the Highest Positive Net GEX / Gamma Wall is just below at $202, acting as the current pivot level.
Support sits around $197.50, marked by the HVL zone and the lower end of GEX structure. Below that, $195 is protected by the 2nd PUT Wall — a critical gamma defense zone.
Implied Volatility Rank is 20.7, so options are still relatively cheap. Notably, we’re seeing a 5% PUT flow dominance, a subtle bearish tilt — not extreme, but worth watching.
🔧 Options Setup for Monday–Wednesday:
Bullish Scenario:
If AAPL clears $203.21 and holds, this opens up the play toward $204.98 (Gamma Ceiling), and potentially $207 if momentum builds.
You can consider a CALL debit spread, like 202.5c/205c or 205c/207c for July 3/5 expiry.
Stop out if price drops below $200.
Bearish Scenario:
If AAPL fails to hold $199.50 and breaks through $197.50 HVL, we may see a sharper unwind toward $195 or even $190 PUT wall zone.
Consider 200p or 197.5p for July 3 expiry.
Cut if price reclaims $202 with strength.
📉 1-Hour Chart Breakdown:
Price has been coiling in a symmetrical triangle just below the $203–$205 resistance supply zone. There’s a visible CHoCH just under structure, with multiple tap rejections from the overhead resistance.
The recent CHoCH printed after a bounce from minor demand, suggesting that sellers are still defending the top channel. Volume has been flat, but tightening price range signals an imminent breakout or breakdown.
As long as price remains pinned inside this triangle under the BOS and supply zone, this is a range-bound chop — not a trending setup yet.
📌 Key Levels to Watch:
$204.98 – Gamma ceiling and top of supply
$203.21 – Structure pivot, minor resistance
$201.17 – Local midpoint and breakout base
$199.50 – Demand edge, current support
$197.50 – HVL and gamma support zone
$195.00 – 2nd PUT Wall
$190.00 – Final gamma support if breakdown accelerates
✅ Thoughts and Monday Game Plan:
AAPL is one of the cleanest coil setups among the tech names heading into Monday. This type of structure doesn’t last long — expect expansion.
Wait for direction at open:
If we break $203.21 with volume, we ride toward $205–207 for a short-term gamma pop.
If price fails to break and loses $199.50, the fade to $197.50 or lower is likely.
This is not a time to anticipate — react to the move. Let the coil resolve and follow the breakout or breakdown.
Disclaimer:
This analysis is for educational purposes only. Always do your own due diligence, trade with a plan, and manage your risk carefully.

Apple about to popTight BB squeeze — contractions like these are usually followed by heightened volatility.

AAPL: Premium PlayApple beat expectations this quarter—revenue, profit, EPS—all slightly better than analysts hoped. But the stock dropped to $196.26, down from $212.83. Why? Investors are still worried about tariffs, margin pressure, and supply chain changes.
Tim Cook talked about strong product sales (iPhone, Mac, iPad) and all-time high Services revenue. But he also admitted tariffs and regulatory issues are weighing on Apple’s outlook.
My Covered Call Strategy
I’m selling the $202.5 call and buying the $210 call for June 27, 2025. Big money seems to be doing the same—there was a huge premium sale over $2 million, likely betting Apple stays range-bound short term.
- Why this works:
- Resistance near $202.50 gives me a clear ceiling
- Apple fundamentals are strong, but macro risk caps upside
Chart Notes
- Resistance: $202.50 and $210
- Support: Around $192.50
Bottom line:
I like this trade as a way to bring in income while defining my risk. If Apple grinds sideways or pushes a bit higher, the trade still pays. Clean structure, high odds.

APPLE BULLISH 26 JUNE 2025Apple looks ready to breakout.It is really well squeezed now and ready to form a Green candle.
Breakout is an expectation so dont trade blindly.
I will upload video analysis Asap.
I am bullish and my price target is a minimum $220 from here.
NOTE: RISK MANAGEMENT IS A MUST
AAPLApple shares trade in a consolidation zone after solid Q2 results—revenue at $95.4B (+5%), record services growth, and strong margins despite tariff headwinds.
Technically , indicators lean bullish, but resistance near $202–204 poses a short-term barrier. Market reaction to WWDC AI updates and further supply‑chain diversification will be key. On dips toward $196, there’s room for selective buying; if $204–214 breaks decisively, upside toward $235 could unfold . However, the lack of clear AI revenue guidance warrants caution, aligning with Needham’s cautious stance.

AAPL: Update - Key Levels to Watch for Price DevelopmentAAPL: Update - Key Levels to Watch for Price Development
Overall nothing changed and AAPL remains a valuable and strong structure
Apple's stock (AAPL) has been range-bound between $193 and $212.50 for the past two months, repeatedly testing support near $193 on three occasions.
Each time, the price has rebounded strongly, pushing back toward $212.50—the upper boundary of this trading range.
Given this pattern, the likelihood of another move toward $212.50 remains high.
If AAPL successfully breaches $212.50, it could signal a larger bullish breakout, with upside targets at $224.50 and $240, as highlighted in the chart.
You may find more details in the chart!
Thank you and Good Luck!
❤️PS: Please support with a like or comment if you find this analysis useful for your trading day❤️

AAPL death cat bounceAAPL is looking like a technical death cat bounce (0.5 fib retracement).
Targets around $100 probably lower...
