LARSEN buy for intraday tradingLARSEN buy for intraday trading if stock break the previous days High.......
LTOD trade ideas

L&t at a crucial supportLT had given an upmove of massive 30% in just 6 months from its previous breakout level of 1600 shared earlier.
It has already retested that breakout zone. Currently, stock is trading at its 200 DEMA and a strong demand zone of 1720-1740.
This stock is looking great for long term as well as short term investing at this current price.

LT Rounding bottom formation LT - Rounding bottom formation at 200 ema.
The structure seems strong here.
One can go long with a SL of today's low / 200 ema.

LT - Channel Breakout & RetestL&T looks extremely bullish based on the below observations:
1. Broke the 20 EMA resistance with a Big Green candle forming a bullish engulfing pattern.
2. Channel Breakout and re-test done
3. Good volume compared to the last 7 days
Targets & SL are as mentioned on the Chart.
This is for educational Purpose only.

LT buy for intraday tradingLT buy for intraday trading if stock and NIFTY also strong then we will enter in trade............


LT buy for intraday tradingLT buy for intraday trading if stock break the two days consolidation with volume....


LARSEN TOUBROLT - Channel support accompanied by regular bullish divergence.
The risk reward ratio is favorable here.
One can go long with a SL of this week's low.


LARSEN SELL for intraday tradingLARSEN SELL for intraday trading if stock break the support zone............

LT Closing at important level, is it a halt or reversal?Good move from 1300 levels in an ascending channel, consistent pyramiding at multiple levels.
Important close at 1875, above 1890 it can see its journey for 2K, Immediate support at 1800.

LTNSE:LT
Please note that we are not a SEBI Registered Investor Adviser/PMS/ Broking House.
All the contents over here are for educational purposes only and are not investment advice or recommendations
offered to any person(s) with respect to the purchase or sale of the stocks / futures and options.
You are also requested to apply your prudence and consult your advisers in case you choose to act on
any such content available as WE claims no responsibilities for any of your actions or any outcome of
such action

LT 44 Moving average Swing trading ideaLT Share target buy 1425
STOP LOSS 1844
Target 2098
1.2 ratio

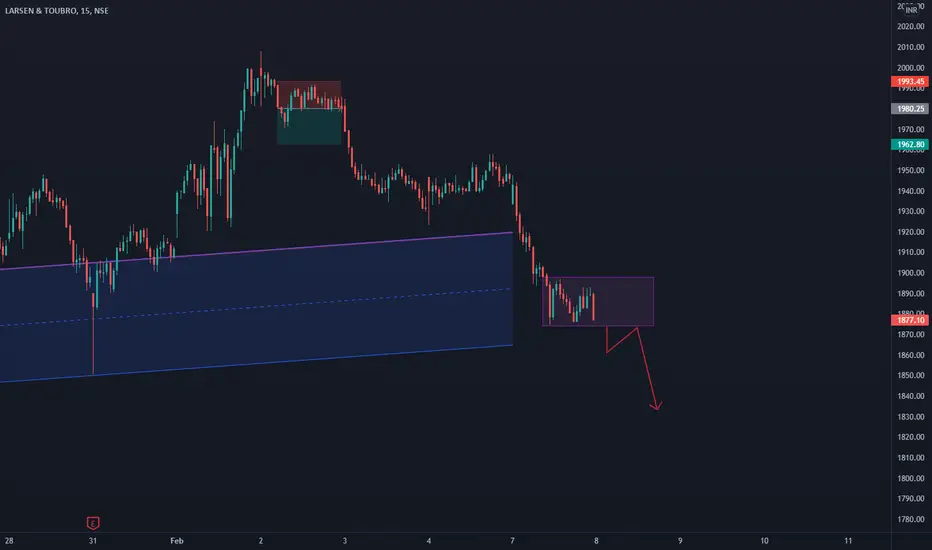
LT ANALYSISInverted Flag and Pole Pattern
Entry Stop Above 1946
Upside Target: 1988-1955
Entry Stop Below 1890
Downside Target: 1845-1850


LARSENLarsen took support @ 50% fib retracement level of 1987.85,
Try to buy near 1995-2000 range with 1986 as stoploss. If Nifty has to recover from these levels then LT is best buy.

Larsen & Toubro , A Long Term Investment (Keep It Simple) FYI : Red Line refers to Monthly Trendline(TL) , Blue Line refers to Weekly Trendline(TL), Black Line refers to Daily Trendline (TL)
Larsen & Toubro ( NSE:LT ) is an Indian construction and manufacturing mammoth with MCap of Rs . 2.7L Crores ,so it's safe to say that LT is a blue chip stock with low downside and prospect of consistent return. Stock has given a CAGR of 18% over the last 5 years. Now coming to Technical Analysis of it's chart :
1. Stock gave a breakout and closed above redline for the first time in last weeks & has re -tested and bounced back from it which confirms this
breakout is genuine.
2. Stock is also respecting the blue line since post covid bull run.
3. Stock is trading @ All Time High ,hence using Fibonacci retracement tool to aim for targets which is 2800 in this case.
4. Swing traders can keep a trailing SL to minimize losses & maximize profits; for me it's whenever it breaks the blueline and gives a closing below
it.
5. For people looking to buy & forget, can keep a SL if it breaks and closes below the red line.
Have a Peaceful Trading!

LT APPROACHING TGT - BOOK PROFITS PEOPLEAll levels marked on Chart. Approaching T2 (T1 was 2000,,checkout previous idea). Profit booking advisable.


LT - VCP patternTape has formed VCP pattern.
Volume dry-up on contractions.
Long @1910
SL at Inside candle low; the final contraction.
Publishing for my future reference.
Only for educational purpose.
