RIL S/R for 6/3/24Support and Resistance Levels: In technical analysis, support and resistance levels are significant price levels where buying or selling interest tends to be strong. They are identified based on previous price levels where the price has shown a tendency to reverse or find support.
Support levels are represented by the green line and green shade, indicating areas where buying interest may emerge to prevent further price decline.
Resistance levels are represented by the red line and red shade, indicating areas where selling pressure may arise to prevent further price increases. Traders often consider these levels as potential buying or selling opportunities.
Breakouts: Breakouts occur when the price convincingly moves above a resistance level (red shade) or below a support level (green shade). A bullish breakout above resistance suggests the potential for further price increases, while a bearish breakout below support suggests the potential for further price declines. Traders pay attention to these breakout signals as they may indicate the start of a new trend or significant price movement.
Keltner Channel: The Keltner Channel is a technical indicator that uses an exponential moving average (EMA) and an average true range (ATR) to create an upper and lower channel around the price action. The upper line of the channel represents the upper limit of the average range, and the lower line represents the lower limit. Traders can use the Keltner Channel to identify potential long and short positions.
Long Position: A long position may be considered when the price is trading above the upper line of the Keltner Channel. This suggests that the price is trading above the average range and may continue in an upward trend, potentially offering buying opportunities.
Short Position: A short position may be considered when the price is trading below the lower line of the Keltner Channel. This suggests that the price is trading below the average range and may continue in a downward trend, potentially offering selling opportunities.
Disclosure: I am not SEBI registered. The information provided here is for learning purposes only and should not be interpreted as financial advice. It is important to consult with a qualified financial advisor before making any investment decisions. Tweets neither advice nor endorsement.
RIGD trade ideas

Breakout of a Falling channel - RIL on the moveReliance Industries has broken out of a big falling channel. The pattern size projection is around 3200. The momentum indicators are bullish across Monthly, Weekly and Daily Timeframes.

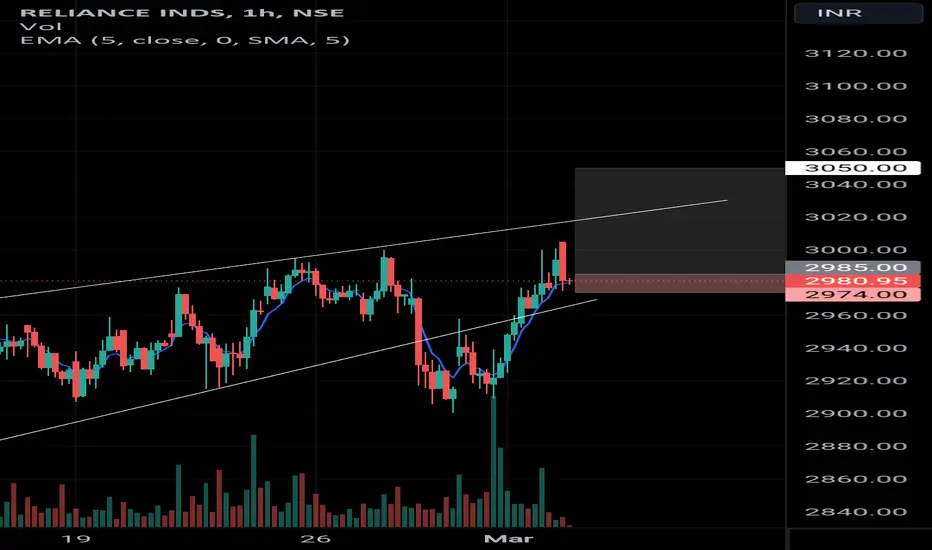
RELIANCE INTRADAY TO SWING TRADE Reliance can give a good swing or positional trade with a decent stoploss and big targets Right now can give a good INTRADAY to swing trade opportunity with a decent stoploss and good Targets
ENTRY - 2985
STOPLOSS - 2970
TARGETS- 3050, 3100, 3160++
Note- if any trade or value that's gone from the marked levels then that's not our trade just let it go or wait for it to come back
I'm not sebi registered this is my personal view
Please like or boost my idea if you like it or traded it
Thankyou
RIL S/R for 4/3/24Support and Resistance Levels:
Based on the price action, you have to identify two significant levels: the red line acting as resistance and the green line acting as support. Additionally, there have marked red and green shades to represent resistance and support zones, respectively.
Support: The green line and green shade represent support levels. These levels are where the price tends to find buying interest, preventing it from falling further. Traders can consider these levels as potential buying opportunities.
Resistance: The red line and red shade represent resistance levels. These levels are where the price tends to encounter selling pressure, preventing it from rising further. Traders can consider these levels as potential selling opportunities.
Breakouts: If the price breaks above the resistance zone (red shade) convincingly, it may indicate a bullish breakout, and the price could move higher to the next resistance level. On the other hand, if the price breaks below the support zone (green shade) convincingly, it may indicate a bearish breakout, and the price could move lower to the next support level.
Keltner Channel:
The Keltner Channel is a technical indicator that uses an exponential moving average (EMA) to create an upper and lower channel around the price action. Traders can use this channel to identify potential long and short positions.
Long Position: If the price is above the upper line of the Keltner Channel, it may indicate a potential long opportunity, as it suggests the price is trading above the average range and might continue in an upward trend.
Short Position: If the price is below the lower line of the Keltner Channel, it may indicate a potential short opportunity, as it suggests the price is trading below the average range and might continue in a downward trend.
Disclosure: I am not SEBI registered. I just wanted to let you know that the information provided here is for learning purposes only. Please consult your financial advisor before making any decisions. Tweets neither advice nor endorsement.

Reliance target 2753.25lower limit- 2181.25
upper limit- 2753.25
cmp- 2455.20
gain- 12.1% from cmp
Rangebound trading strategy in reliance, target will be achieved by 18/08/23

BUY RELIANCEBuy Reliance and hold it for 2-3 months. It is the largest company of BHARAT and also the most profitable company. It is a good company for investment purpose.

Will RELIANCE touch 3200Reliance the biggest company in India is ready to give an upside of 23.5% to reach a level of 3200 in the coming months. It is the best time to buy the elephant now. Beautiful cup with handle pattern supports the uptrend of this stock.
Please follow if you like my analysis.
Trade or invest at your own risk

RIL S/R for 1/3/24Support and Resistance Levels:
Based on the price action, you have to identify two significant levels: the red line acting as resistance and the green line acting as support. Additionally, there have marked red and green shades to represent resistance and support zones, respectively.
Support: The green line and green shade represent support levels. These levels are where the price tends to find buying interest, preventing it from falling further. Traders can consider these levels as potential buying opportunities.
Resistance: The red line and red shade represent resistance levels. These levels are where the price tends to encounter selling pressure, preventing it from rising further. Traders can consider these levels as potential selling opportunities.
Breakouts: If the price breaks above the resistance zone (red shade) convincingly, it may indicate a bullish breakout, and the price could move higher to the next resistance level. On the other hand, if the price breaks below the support zone (green shade) convincingly, it may indicate a bearish breakout, and the price could move lower to the next support level.
Keltner Channel:
The Keltner Channel is a technical indicator that uses an exponential moving average (EMA) to create an upper and lower channel around the price action. Traders can use this channel to identify potential long and short positions.
Long Position: If the price is above the upper line of the Keltner Channel, it may indicate a potential long opportunity, as it suggests the price is trading above the average range and might continue in an upward trend.
Short Position: If the price is below the lower line of the Keltner Channel, it may indicate a potential short opportunity, as it suggests the price is trading below the average range and might continue in a downward trend.
Disclosure: I am not SEBI registered. I just wanted to let you know that the information provided here is for learning purposes only. Please consult your financial advisor before making any decisions. Tweets neither advice nor endorsement.

RELIANCE looking weak from here. Wedge broken.NSE:RELIANCE has broken down from rising wedge (bearish) in hourly chart convincingly. We should see weakness in the stock for few days and given it's weight in NSE:NIFTY , that also can remain subdued. 2800/2850 should be the target zone on the downside for this and those level should offer support.
On the flip side, 20 day MA is around 2925 which might stop the stock from falling further hence keep an eye on that. If 20 DMA breaks today on closing basis then downside remains open.

RIL S/R for 28/2/24Support and Resistance Levels:
Based on the price action, you have to identify two significant levels: the red line acting as resistance and the green line acting as support. Additionally, there have marked red and green shades to represent resistance and support zones, respectively.
Support: The green line and green shade represent support levels. These levels are where the price tends to find buying interest, preventing it from falling further. Traders can consider these levels as potential buying opportunities.
Resistance: The red line and red shade represent resistance levels. These levels are where the price tends to encounter selling pressure, preventing it from rising further. Traders can consider these levels as potential selling opportunities.
Breakouts: If the price breaks above the resistance zone (red shade) convincingly, it may indicate a bullish breakout, and the price could move higher to the next resistance level. On the other hand, if the price breaks below the support zone (green shade) convincingly, it may indicate a bearish breakout, and the price could move lower to the next support level.
Keltner Channel:
The Keltner Channel is a technical indicator that uses an exponential moving average (EMA) to create an upper and lower channel around the price action. Traders can use this channel to identify potential long and short positions.
Long Position: If the price is above the upper line of the Keltner Channel, it may indicate a potential long opportunity, as it suggests the price is trading above the average range and might continue in an upward trend.
Short Position: If the price is below the lower line of the Keltner Channel, it may indicate a potential short opportunity, as it suggests the price is trading below the average range and might continue in a downward trend.
Disclosure: I am not SEBI registered. I just wanted to let you know that the information provided here is for learning purposes only. Please consult your financial advisor before making any decisions. Tweets neither advice nor endorsement.

RIL S/R for 26/2/24Support and Resistance Levels:
Based on the price action, you have to identify two significant levels: the red line acting as resistance and the green line acting as support. Additionally, there have marked red and green shades to represent resistance and support zones, respectively.
Support: The green line and green shade represent support levels. These levels are where the price tends to find buying interest, preventing it from falling further. Traders can consider these levels as potential buying opportunities.
Resistance: The red line and red shade represent resistance levels. These levels are where the price tends to encounter selling pressure, preventing it from rising further. Traders can consider these levels as potential selling opportunities.
Breakouts: If the price breaks above the resistance zone (red shade) convincingly, it may indicate a bullish breakout, and the price could move higher to the next resistance level. On the other hand, if the price breaks below the support zone (green shade) convincingly, it may indicate a bearish breakout, and the price could move lower to the next support level.
Keltner Channel:
The Keltner Channel is a technical indicator that uses an exponential moving average (EMA) to create an upper and lower channel around the price action. Traders can use this channel to identify potential long and short positions.
Long Position: If the price is above the upper line of the Keltner Channel, it may indicate a potential long opportunity, as it suggests the price is trading above the average range and might continue in an upward trend.
Short Position: If the price is below the lower line of the Keltner Channel, it may indicate a potential short opportunity, as it suggests the price is trading below the average range and might continue in a downward trend.
Disclosure: I am not SEBI registered. I just wanted to let you know that the information provided here is for learning purposes only. Please consult your financial advisor before making any decisions. Tweets neither advice nor endorsement.

RIL S/R for 22/2/24Support and Resistance Levels:
Based on the price action, you have to identify two significant levels: the red line acting as resistance and the green line acting as support. Additionally, there have marked red and green shades to represent resistance and support zones, respectively.
Support: The green line and green shade represent support levels. These levels are where the price tends to find buying interest, preventing it from falling further. Traders can consider these levels as potential buying opportunities.
Resistance: The red line and red shade represent resistance levels. These levels are where the price tends to encounter selling pressure, preventing it from rising further. Traders can consider these levels as potential selling opportunities.
Breakouts: If the price breaks above the resistance zone (red shade) convincingly, it may indicate a bullish breakout, and the price could move higher to the next resistance level. On the other hand, if the price breaks below the support zone (green shade) convincingly, it may indicate a bearish breakout, and the price could move lower to the next support level.
Keltner Channel:
The Keltner Channel is a technical indicator that uses an exponential moving average (EMA) to create an upper and lower channel around the price action. Traders can use this channel to identify potential long and short positions.
Long Position: If the price is above the upper line of the Keltner Channel, it may indicate a potential long opportunity, as it suggests the price is trading above the average range and might continue in an upward trend.
Short Position: If the price is below the lower line of the Keltner Channel, it may indicate a potential short opportunity, as it suggests the price is trading below the average range and might continue in a downward trend.
Disclosure: I am not SEBI registered. I just wanted to let you know that the information provided here is for learning purposes only. Please consult your financial advisor before making any decisions. Tweets neither advice nor endorsement.

Reliance trap level diductedAttention Investors: Formation of Trap Level Detected in Reliance Industries Shares! Exercise Caution and Evaluate Risks Carefully. Stay Informed for Informed Decision-Making.

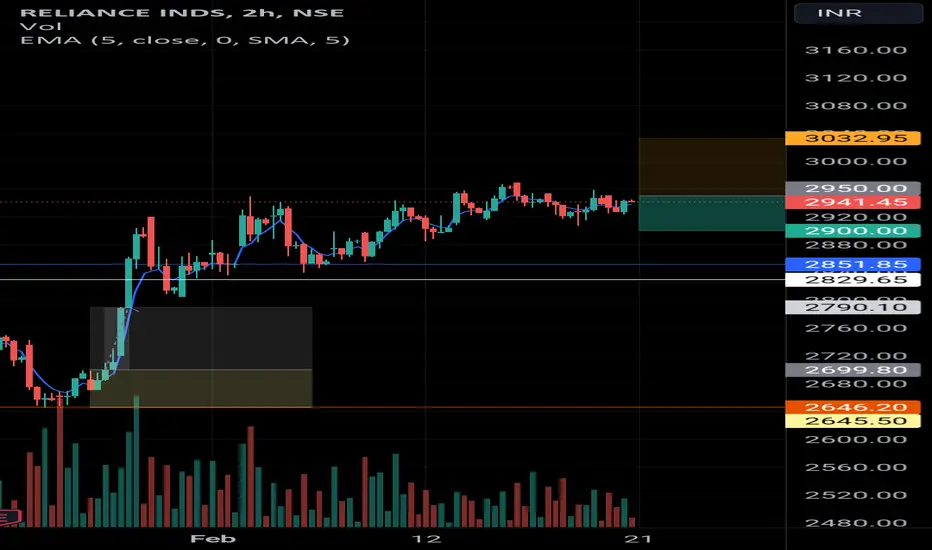
RELIANCE can give a possible up move Reliance can give a good swing or positional trade with a decent stoploss and good Targets
Entry - 2950
STOPLOSS - 2900
TARGETS - 3020, 3050, 3100++
Note- if any trade or value that's gone from the marked levels then that's not our trade just let it go or wait for it to come back
I'm not sebi registered this is my personal view
Please like or boost my idea of you like it or traded it.. thankyou
RIL S/R for 21/2/24Support and Resistance Levels:
Based on the price action, you have to identify two significant levels: the red line acting as resistance and the green line acting as support. Additionally, there have marked red and green shades to represent resistance and support zones, respectively.
Support: The green line and green shade represent support levels. These levels are where the price tends to find buying interest, preventing it from falling further. Traders can consider these levels as potential buying opportunities.
Resistance: The red line and red shade represent resistance levels. These levels are where the price tends to encounter selling pressure, preventing it from rising further. Traders can consider these levels as potential selling opportunities.
Breakouts: If the price breaks above the resistance zone (red shade) convincingly, it may indicate a bullish breakout, and the price could move higher to the next resistance level. On the other hand, if the price breaks below the support zone (green shade) convincingly, it may indicate a bearish breakout, and the price could move lower to the next support level.
Keltner Channel:
The Keltner Channel is a technical indicator that uses an exponential moving average (EMA) to create an upper and lower channel around the price action. Traders can use this channel to identify potential long and short positions.
Long Position: If the price is above the upper line of the Keltner Channel, it may indicate a potential long opportunity, as it suggests the price is trading above the average range and might continue in an upward trend.
Short Position: If the price is below the lower line of the Keltner Channel, it may indicate a potential short opportunity, as it suggests the price is trading below the average range and might continue in a downward trend.
Disclosure: I am not SEBI registered. I just wanted to let you know that the information provided here is for learning purposes only. Please consult your financial advisor before making any decisions. Tweets neither advice nor endorsement.

RELIANCE--Rising Wedge??Rising wedge bearish pattern is observed in this stock..
This stock is showing strong bullishness from the demand areas at 2600 levels.
A strong bullishness is observed after broken the trendline previously
and a continuous move is identified.
So look for long in this stock from the demand Areas.

Found 938 Days Long - Box Consolidation Breakout In RELIANCE Points To Learn - This is a Weekly chart.
A long Term Stock.
-Box Consolidation of 938 days breakout - Done.
-Upper high Upper Low formation has confirmed the change in trend.
-Fibbs. Retracement from 0.6 levels has increased the probability of a genuine retest and breakout.
-Retest Required at box upper level.
Kindly feel free to message me personally to enquire about any particular stock.
Thank you

RIL S/R for 19/2/24Support and Resistance Levels:
Based on the price action, you have to identify two significant levels: the red line acting as resistance and the green line acting as support. Additionally, there have marked red and green shades to represent resistance and support zones, respectively.
Support: The green line and green shade represent support levels. These levels are where the price tends to find buying interest, preventing it from falling further. Traders can consider these levels as potential buying opportunities.
Resistance: The red line and red shade represent resistance levels. These levels are where the price tends to encounter selling pressure, preventing it from rising further. Traders can consider these levels as potential selling opportunities.
Breakouts: If the price breaks above the resistance zone (red shade) convincingly, it may indicate a bullish breakout, and the price could move higher to the next resistance level. On the other hand, if the price breaks below the support zone (green shade) convincingly, it may indicate a bearish breakout, and the price could move lower to the next support level.
Keltner Channel:
The Keltner Channel is a technical indicator that uses an exponential moving average (EMA) to create an upper and lower channel around the price action. Traders can use this channel to identify potential long and short positions.
Long Position: If the price is above the upper line of the Keltner Channel, it may indicate a potential long opportunity, as it suggests the price is trading above the average range and might continue in an upward trend.
Short Position: If the price is below the lower line of the Keltner Channel, it may indicate a potential short opportunity, as it suggests the price is trading below the average range and might continue in a downward trend.
Disclosure: I am not SEBI registered. I just wanted to let you know that the information provided here is for learning purposes only. Please consult your financial advisor before making any decisions. Tweets neither advice nor endorsement.

RIL S/R for 16/2/24Support and Resistance Levels:
Based on the price action, you have to identify two significant levels: the red line acting as resistance and the green line acting as support. Additionally, there have marked red and green shades to represent resistance and support zones, respectively.
Support: The green line and green shade represent support levels. These levels are where the price tends to find buying interest, preventing it from falling further. Traders can consider these levels as potential buying opportunities.
Resistance: The red line and red shade represent resistance levels. These levels are where the price tends to encounter selling pressure, preventing it from rising further. Traders can consider these levels as potential selling opportunities.
Breakouts: If the price breaks above the resistance zone (red shade) convincingly, it may indicate a bullish breakout, and the price could move higher to the next resistance level. On the other hand, if the price breaks below the support zone (green shade) convincingly, it may indicate a bearish breakout, and the price could move lower to the next support level.
Keltner Channel:
The Keltner Channel is a technical indicator that uses an exponential moving average (EMA) to create an upper and lower channel around the price action. Traders can use this channel to identify potential long and short positions.
Long Position: If the price is above the upper line of the Keltner Channel, it may indicate a potential long opportunity, as it suggests the price is trading above the average range and might continue in an upward trend.
Short Position: If the price is below the lower line of the Keltner Channel, it may indicate a potential short opportunity, as it suggests the price is trading below the average range and might continue in a downward trend.
Disclosure: I am not SEBI registered. I just wanted to let you know that the information provided here is for learning purposes only. Please consult your financial advisor before making any decisions. Tweets neither advice nor endorsement.

RIL S/R for 15/2/24Support and Resistance Levels:
Based on the price action, you have to identify two significant levels: the red line acting as resistance and the green line acting as support. Additionally, there have marked red and green shades to represent resistance and support zones, respectively.
Support: The green line and green shade represent support levels. These levels are where the price tends to find buying interest, preventing it from falling further. Traders can consider these levels as potential buying opportunities.
Resistance: The red line and red shade represent resistance levels. These levels are where the price tends to encounter selling pressure, preventing it from rising further. Traders can consider these levels as potential selling opportunities.
Breakouts: If the price breaks above the resistance zone (red shade) convincingly, it may indicate a bullish breakout, and the price could move higher to the next resistance level. On the other hand, if the price breaks below the support zone (green shade) convincingly, it may indicate a bearish breakout, and the price could move lower to the next support level.
Keltner Channel:
The Keltner Channel is a technical indicator that uses an exponential moving average (EMA) to create an upper and lower channel around the price action. Traders can use this channel to identify potential long and short positions.
Long Position: If the price is above the upper line of the Keltner Channel, it may indicate a potential long opportunity, as it suggests the price is trading above the average range and might continue in an upward trend.
Short Position: If the price is below the lower line of the Keltner Channel, it may indicate a potential short opportunity, as it suggests the price is trading below the average range and might continue in a downward trend.
Disclosure: I am not SEBI registered. I just wanted to let you know that the information provided here is for learning purposes only. Please consult your financial advisor before making any decisions. Tweets neither advice nor endorsement.

Reliance : On a hourly chart bearish pattern Alert! Bearish Pattern Spotted! 🐻
📊 Pattern: Rising Wedge
📌 Symbol/Asset: RELIANCE
🔍 Description: Stock is making rising wedge on a smaller timeframe.
Reliance is around curve resistance shown in the previous post.
Reliance resistance is around 2980-3030
Connecting the dots shows Reliance should fall from here on.
👉 Disclosure: We are not SEBI registered analysts, this is not a buy or sell recommendation.

Reliance : Sit on the sell side before anyone else Alert! Bearish Pattern Spotted! 🐻
📊 Pattern: Curve Resistance
📌 Symbol/Asset: RELIANCE
🔍 Description: Reliance is near the resistance of curve on a weekly timeframe.
We can see correction of upto 15-20% from this prices.
Resistance is around 2990-3020 and Reliance stock should fall from these prices.
👉 Disclosure: We are not SEBI registered analysts, this is not a buy or sell recommendation.

RIL S/R for 14/2/24Support and Resistance Levels:
Based on the price action, you have to identify two significant levels: the red line acting as resistance and the green line acting as support. Additionally, there have marked red and green shades to represent resistance and support zones, respectively.
Support: The green line and green shade represent support levels. These levels are where the price tends to find buying interest, preventing it from falling further. Traders can consider these levels as potential buying opportunities.
Resistance: The red line and red shade represent resistance levels. These levels are where the price tends to encounter selling pressure, preventing it from rising further. Traders can consider these levels as potential selling opportunities.
Breakouts: If the price breaks above the resistance zone (red shade) convincingly, it may indicate a bullish breakout, and the price could move higher to the next resistance level. On the other hand, if the price breaks below the support zone (green shade) convincingly, it may indicate a bearish breakout, and the price could move lower to the next support level.
Keltner Channel:
The Keltner Channel is a technical indicator that uses an exponential moving average (EMA) to create an upper and lower channel around the price action. Traders can use this channel to identify potential long and short positions.
Long Position: If the price is above the upper line of the Keltner Channel, it may indicate a potential long opportunity, as it suggests the price is trading above the average range and might continue in an upward trend.
Short Position: If the price is below the lower line of the Keltner Channel, it may indicate a potential short opportunity, as it suggests the price is trading below the average range and might continue in a downward trend.
Disclosure: I am not SEBI registered. I just wanted to let you know that the information provided here is for learning purposes only. Please consult your financial advisor before making any decisions. Tweets neither advice nor endorsement.
