Reliance_Long_DailyReliance shows Flag Formation in DAILY Timeframe with recent days trading in tight range.
Target: 1640+ if price breaks out Flag on Long side
Educational Purpose only
RIGD trade ideas

RELIANCE LTD – 1H TIME FRAME ANALYSIS📊 NSE:RELIANCE – 1H TIME FRAME ANALYSIS
A symmetrical triangle pattern is forming on Reliance's 1-hour chart, showing a consolidation phase. This pattern is neutral in nature, meaning a breakout can occur in either direction, but the setup provides a great opportunity for a breakout trade.
The price is now at the apex of the triangle, indicating a potential breakout in the upcoming sessions. Watch for a strong move backed by volume.
TRADE PLAN :
Chart Pattern: Symmetrical Triangle
Timeframe: 1 Hour
Stock: Reliance Industries Ltd (NSE)
🔼 Long Trade (Breakout above 1430.55)
Entry: Above 1,430.55 (candle close with volume confirmation)
Target 1: 1,458.35
Target 2: 1,479.35
Stop Loss: Below 1,417
🔽 Short Trade (Breakdown below trendline):
Entry: Below triangle breakdown with strong red candle
Target 1: 1,397.55
Target 2: 1,368.25
Stop Loss: Above 1,430
Note: Avoid entering during the triangle zone. Trade only post-confirmation of breakout/breakdown with volume.
Disclaimer: This analysis is for educational purposes only. Please consult your financial advisor before making any trading decisions.

Reliance Buy Sell Model For Swing Or IntradayI Am Sharing Reliance Share Analysis For Swing Or Intraday Trading. According To My Prespective In Weekly Or In Daily Demand And Supply Zone Market Are Middle On It. In Hourly Chart Created Demand And Supply Zone With Some Garbage Area ( Not Meaningful Area). Also Market React On M15 Supply Zone With BOS . According To Me Wait For Next Supply Or Demand Sone If Market touch H1 Or D1 Demand / Supply Zone We Trade It Because I Mark Powerful Zones that have some meaning . Or For Intadqy If Market Hit M15 Demand Zone I Wait For Proper Entry Setup And Do 1:2 RR
Buy If Touch H1 Or Daily Demand Zone
Sell If Touch H1 Or Daily Supply Zone
For Intraday Wait For Proper Setup Or Sell Out From Supply Zone Or Buy And Wait For 1:2 In M15 Demand Zone

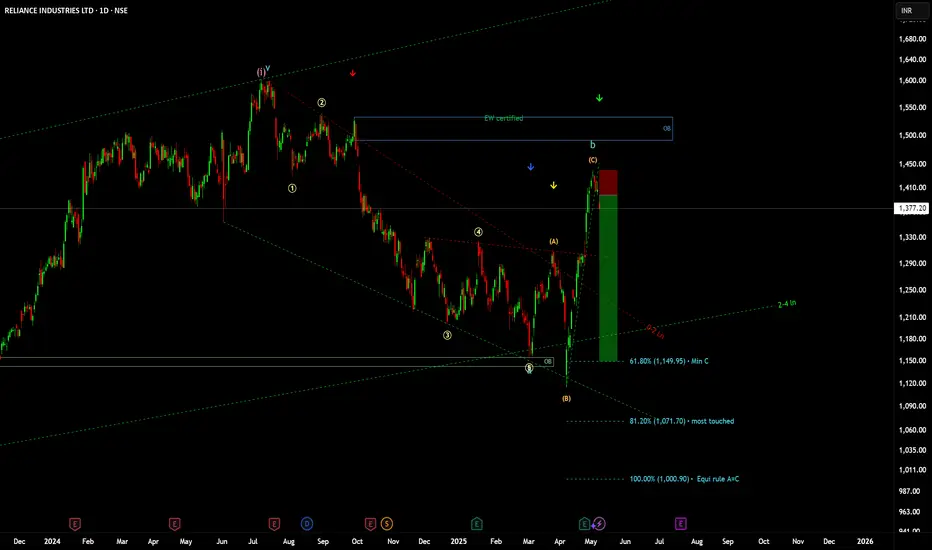
Realinace elliot wave count.I think wave b is complete and entered wave c, expecting to fall till 61.8%,100%,161%. this is just my view.
RIL S/R Support and Resistance Levels:
Support Levels: These are price points (green line/shade) where a downward trend may be halted due to a concentration of buying interest. Imagine them as a safety net where buyers step in, preventing further decline.
Resistance Levels: Conversely, resistance levels (red line/shade) are where upward trends might stall due to increased selling interest. They act like a ceiling where sellers come in to push prices down.
Breakouts:
Bullish Breakout: When the price moves above resistance, it often indicates strong buying interest and the potential for a continued uptrend. Traders may view this as a signal to buy or hold.
Bearish Breakout: When the price falls below support, it can signal strong selling interest and the potential for a continued downtrend. Traders might see this as a cue to sell or avoid buying.
MA Ribbon (EMA 20, EMA 50, EMA 100, EMA 200) :
Above EMA: If the stock price is above the EMA, it suggests a potential uptrend or bullish momentum.
Below EMA: If the stock price is below the EMA, it indicates a potential downtrend or bearish momentum.
Trendline: A trendline is a straight line drawn on a chart to represent the general direction of a data point set.
Uptrend Line: Drawn by connecting the lows in an upward trend. Indicates that the price is moving higher over time. Acts as a support level, where prices tend to bounce upward.
Downtrend Line: Drawn by connecting the highs in a downward trend. Indicates that the price is moving lower over time. It acts as a resistance level, where prices tend to drop.
Disclaimer:
I am not a SEBI registered. The information provided here is for learning purposes only and should not be interpreted as financial advice. Consider the broader market context and consult with a qualified financial advisor before making investment decisions.

Reliance Industries Ltd view for Intraday 22nd May #RELIANCE Reliance Industries Ltd view for Intraday 22nd May #RELIANCE
Resistance 1450 Watching above 1452 for upside momentum.
Support area 1410 Below 1430 ignoring upside momentum for intraday
Watching below 1408 for downside movement...
Above 1430 ignoring downside move for intraday
Charts for Educational purposes only.
Please follow strict stop loss and risk reward if you follow the level.
Thanks,
V Trade Point

RELIANCE : Completing correction, ready to bounce back🚀 Trading Opportunity: Reliance Industries Ltd. (NSE: RELIANCE) -
⏱️ Timeframe: 1 Day (1D)
💰 Current Price: ₹1,175.60
🎯 Swing Target Zone: ₹1,374 - ₹1,565 🏆
🛡️ Support Level: ₹1,182.10
🛑 Stop Loss: ₹1,159.00 (Day Close Below) 📉
🔍 Wave Analysis:
📈 The chart indicates a completed corrective wave (primary) 5 on the daily chart. This suggests a potential end to the downtrend and the start of an upward move.
🔄 We observe a corrective wave (A), followed by a potential reversal at (B), and a completed intermediate correction wave 5.
💥 The breakout at point (2) signals the start of wave (C), aiming for the swing target zone of ₹1,374-₹1,565. 🎯
💪 Current support near ₹1,182.10.
⚠️ Daily close below ₹1,159.00 invalidates the wave count and the setup. ❌
📊 Strategy:
✅ Entry: Enter near current market prices (around ₹1,175.60). 🛒
🔒 Risk Management: Set stop loss at ₹1,159.00 (daily close) to limit downside. 📉
💸 Exit: Aim for profits within the swing target zone of ₹1,374-₹1,565, aligning with the wave (C) target. 🏆
#Trading 📈 #StockMarket 💰 #RELIANCE 🏭 #TechnicalAnalysis 🧐 #Investing 💼 #ElliottWave
⚠️ Disclaimer: I am not a financial adviser; please consult one. Don't share information that can identify you. ⚠️

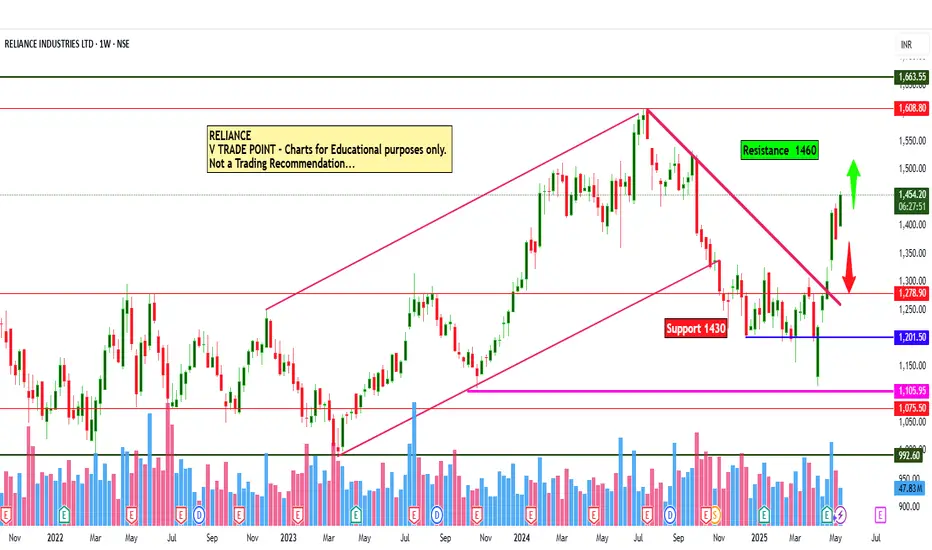
bull run may continue tomorrow in Reliance Industries.Reliance Industries Stocks price escaped from equilibrium zone today. It tried twice to continue bull run but price failed today and it again approaching to the zone again. But if tomorrow it opens above 1462 and stays above this level we may take bullish trade and our first target will be 1462
Entry 1440
Target 1462

Reliance Industries Ltd view for Intraday 16th May #RELIANCE Reliance Industries Ltd view for Intraday 16th May #RELIANCE
Resistance 1460 Watching above 1462 for upside momentum.
Support area 1430 Below 1440 ignoring upside momentum for intraday
Watching below 1425 for downside movement...
Above 1440 ignoring downside move for intraday
Charts for Educational purposes only.
Please follow strict stop loss and risk reward if you follow the level.
Thanks,
V Trade Point
Reliance : Sitting right at a red band resistance Reliance : Sitting right at a red band resistance
( Not a Buy / Sell Recommendation
Do your own due diligence ,Market is subject to risks, This is my own view and for learning only .)

Reliance Industries Ltd view for Intraday 14th May #RELIANCE Reliance Industries Ltd view for Intraday 14th May #RELIANCE
Resistance 1420 Watching above 1423 for upside movement...
Support area 1400 Below 1400 ignoring upside momentum for intraday
Watching below 1397 for downside movement...
Above 1420 ignoring downside move for intraday
Charts for Educational purposes only.
Please follow strict stop loss and risk reward if you follow the level.
Thanks,
V Trade Point

RELIANCE KEY LEVELS FOR 13/05/2025// The core idea behind this indicator was sparked by a simple but powerful clue:
// 👉 "If you get one level, you get all levels."
// From that point onward, everything—the logic, calculation method, and application—has been developed independently through my own analysis and experience.
// I am not a seller, and no one taught me this system. This method is a result of my own effort and refinement.
///////////////////// Explanation /////////////////////
// This trading system is designed to eliminate blind trades by offering confirmation-based entry and exit points.
///////////////////// Entry/Exit Strategy /////////////////////
// - Use the BLACK line for long trades, and the RED line for short trades, in line with confirmation from your trading plan.
// - Stop Loss:
// - For long trades: below the RED line.
// - For short trades: above the BLACK line.
// - Take Profit:
// - For long trades: target the next RED line above.
// - For short trades: target the next BLACK line below.
///////////////////// Recommended Timeframe /////////////////////
// Use on a 5-minute chart for best results.
///////////////////// Disclaimer /////////////////////
// This setup is shared purely for educational purposes.
// I am not responsible for any gains or losses that may result from its use.
// Always use your own judgment and risk management.

Reliance Industries Ltd view for Intraday 12th May #RELIANCE Reliance Industries Ltd view for Intraday 12th May #RELIANCE
Resistance 1400 Watching above 1402 for upside movement...
Support area 1350 Below 1380 ignoring upside momentum for intraday
Watching below 1347 for downside movement...
Above 1360 ignoring downside move for intraday
Charts for Educational purposes only.
Please follow strict stop loss and risk reward if you follow the level.
Thanks,
V Trade Point

Reliance trend directionReliance has resistance at 1463 and support at 1401 and 1370.
In chart it has a round bottom with a sudden raise possibility to form a V Top pattern.
We expect Reliance back to pavilion after hitting 1463

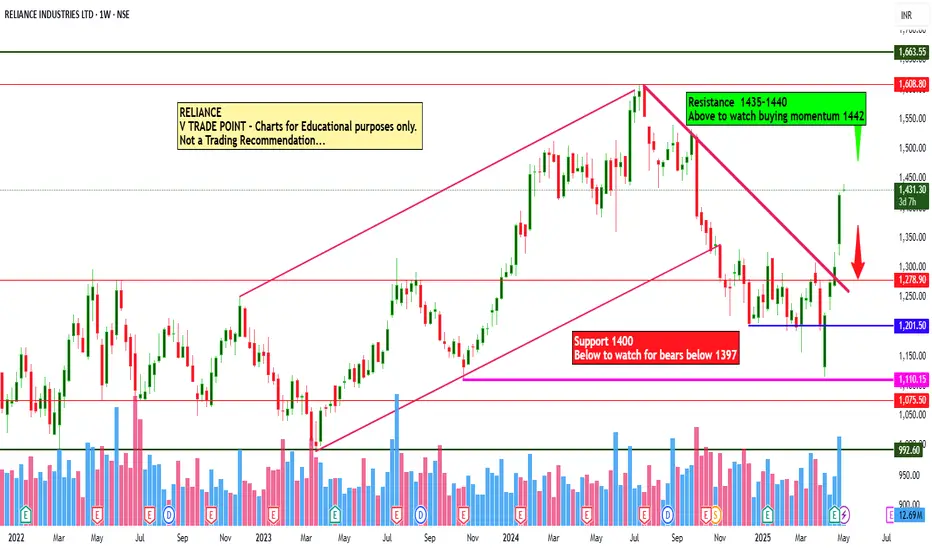
Reliance Industries Ltd view for Intraday 6th May #RELIANCE Reliance Industries Ltd view for Intraday 6th May #RELIANCE
Resistance 1435-1440 Watching above 1442 for upside movement...
Support area 1400 Below 1420 ignoring upside momentum for intraday
Watching below 1397 for downside movement...
Above 1420 ignoring downside move for intraday
Charts for Educational purposes only.
Please follow strict stop loss and risk reward if you follow the level.
Thanks,
V Trade Point
Reliance Analysis with demand and Supply Indicatorkey highlights :
Reliance : Weekly supply zone short trade area
market structure : Bearish
Analysis Time frame : Weekly
proximal line - 1480.20
distal line - 1533.50
short entry - 1478
Stop loss- 1539
Target - 1539

REL INDUS : After a fantastic run ,inching closer to resistanceREL INDUS : After a fantastic run from the support of 1114 and then becoming a buy around 1280 ish range and also clearing the resistance of 1310 now inching closer to the next resistance levels.
Red bands are displayed on the chart .
( Not a Buy / Sell Recommendation
Do your own due diligence ,Market is subject to risks, This is my own view and for learning only .)

RELIANCE VERY BULLISH CHARTreliance@1423 ready for bull run buy-above-1428 sl-1359 target-1623 time-15-90days

Reliance Industries - Analysis & BTO,STC Strategy derivedThe chart provided is a daily candlestick chart for RELIANCE. Here are some key observations:
Recent Uptrend: The price has shown a significant upward movement starting in early April 2025, culminating in a recent high. This aligns with the positive sentiment following the earnings report released on April 25, 2025.
Bollinger Bands: The price has recently broken above the upper Bollinger Band, suggesting potential overbought conditions in the short term but also indicating strong upward momentum.
Moving Averages: The price is trading well above the 20-day Simple Moving Average (SMA), further confirming the uptrend. The 50-day and 200-day SMAs (not explicitly shown with values but implied by the longer-term trend) likely lie below the current price, indicating a broader bullish trend.
Fibonacci Retracement: The chart shows Fibonacci retracement levels drawn from a recent swing high around ₹1,503.85 and a swing low around ₹1,202.45. The price has currently surpassed the 0.618 Fibonacci retracement level (approximately ₹1,390).
Reasons for the Uptrend Based on the Earnings Report:
The positive uptrend is likely fueled by the following key highlights from the recent earnings report:
Strong Consolidated Performance: Both revenue and net profit showed healthy year-on-year growth for Q4 FY25 and the full financial year FY25, indicating a strong overall financial performance.
Robust Growth in Consumer Businesses: Reliance Retail and Reliance Jio demonstrated significant growth in revenue and profitability, driven by factors like store expansion, increased subscriber base, and improved ARPU. These consumer-facing businesses are key growth drivers for RIL.
Positive Outlook and Initiatives: The company's progress in new energy initiatives (solar panel and battery manufacturing) and strategic acquisitions signal future growth potential and investor confidence.
Dividend Announcement: The recommendation of a final dividend is generally viewed positively by investors.
Market Sentiment: The overall market reaction to the earnings report was positive, leading to increased buying interest in the stock.
Trading Strategies and Levels:
Based on the current chart and the positive earnings report, here are potential trading scenarios for both options and equity, along with suggested take profit (TP) and stop loss (SL) levels and risk-reward ratios.
1. Equity Trading:
Immediate Support: ₹1,368.70 (This level has acted as a recent pivot and is close to the current price).
Next Level Support: ₹1,332.40 (This level aligns with the 0.382 Fibonacci retracement and a previous consolidation area).
Immediate Resistance: ₹1,417.85 (This is the level the price is currently testing and the 0.786 Fibonacci retracement).
Next Level Resistance (Potential Take Profit 1): ₹1,503.85 (This is the previous swing high and the 1.0 Fibonacci extension of the recent move).
Potential Take Profit 2: Above ₹1,503.85 (If the upward momentum continues strongly, targeting higher Fibonacci extensions or previous all-time highs, if applicable).
Potential Long Entry: Consider a long position on a pullback towards the immediate support level of ₹1,368.70, provided there are bullish confirmation signals (e.g., a bullish candlestick pattern).
Stop Loss: Place the stop loss below the next level of support at ₹1,332.40 to limit potential losses.
Take Profit 1: ₹1,503.85
Risk-Reward Ratio (Entry at ₹1,368.70, SL at ₹1,332.40, TP at ₹1,503.85):
Risk per share = ₹1,368.70 - ₹1,332.40 = ₹36.30
Reward per share = ₹1,503.85 - ₹1,368.70 = ₹135.15
Risk-Reward Ratio = ₹135.15 / ₹36.30 ≈ 3.72 : 1 (Favorable)
2. Options Trading:
Given the bullish sentiment, traders might consider buying call options or call spreads.
Bull Call Spread:
Buy: A call option with a strike price near the current resistance level (e.g., ₹1,420 strike price expiring in the near term).
Sell: A call option with a higher strike price as the target (e.g., ₹1,500 strike price with the same expiry).
Potential Profit: Limited to the difference between the strike prices minus the net premium paid.
Maximum Loss: Limited to the net premium paid.
Stop Loss (Strategy Level): If the underlying price breaks below the immediate support level (₹1,368.70), consider exiting the spread to limit losses.
Profit Target: If the price reaches or surpasses the higher strike price (₹1,500).
Profit/Loss Ratio: This depends on the premiums paid and received. Calculate the maximum profit and maximum loss before entering the trade to assess the ratio. For example, if the net premium paid is ₹15 and the difference between strikes is ₹80, the max profit is ₹65 and the max loss is ₹15, resulting in a ratio of approximately 4.33 : 1.
Buying a Call Option:
Buy: A call option with a strike price near the current price or slightly out-of-the-money (OTM).
Potential Profit: Unlimited if the price moves significantly above the strike price.
Maximum Loss: Limited to the premium paid.
Stop Loss (Price Level): Set a stop loss on the underlying price (e.g., below the immediate support of ₹1,368.70) to protect the premium.
Take Profit: Based on the resistance levels identified (₹1,503.85 and above) or based on a target profit in terms of premium multiple.
Profit/Loss Ratio: Highly variable depending on the price movement and premium paid.
Important Considerations for Options Trading:
Time Decay (Theta): Options lose value over time, especially as they approach their expiry date. This is a crucial factor to consider, especially for short-term trades.
Volatility (Vega): Changes in implied volatility can significantly impact option prices. Earnings announcements often lead to a spike in volatility, which may decrease after the event.
Expiry Date: Choose an expiry date that aligns with your trading timeframe and expectations for the price movement.
Disclaimer:
This analysis is for informational and educational purposes only and should not be considered as financial advice. Trading in equities and options involves significant risks, and you could lose your entire investment. Always conduct your own thorough research and consult with a qualified financial advisor before making any trading decisions. The levels provided are based on the current chart and may not hold true in the future. Market conditions can change rapidly.

1500 before AGM Reliance 2025 I feel superbolish on Reliance not since today but since it was at the 1250 level I feel that Reliance will show us 1500 and above levels not sure about the lifetime high but 1500 levels before AGM which is mostly held in July or August

Reliance Reliance Cmp 1394
this is daily chart of reliance...
looking at the chart,
this are my wave counts on reliance....
we are in wave c of wave B....
I am expecting reversal from current levels or from the marked levels...
we can soon see wave C moving down and retesting new low as 1st tgts ....
Just a View!!!
Vedang ! :)
Discliamer: Chart is for study purpose only!!!

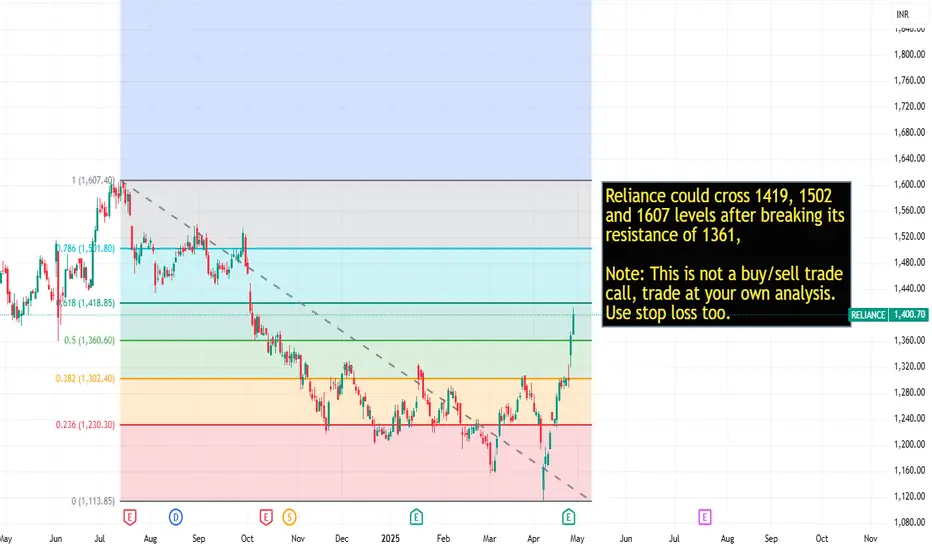
Reliance key levels after breakout of 1361Reliance could cross 1419, 1502
and 1607 levels after breaking its
resistance of 1361,
Note: This is not a buy/sell trade
call, trade at your own analysis.
Use stop loss too.
Reliance Industries Ltd view for Intraday 29th April #RELIANCE Reliance Industries Ltd view for Intraday 29th April #RELIANCE
Resistance 1370-1375 Watching above 1377 for upside movement...
Support area 1350 Below 1350 ignoring upside momentum for intraday
Watching below 1347 for downside movement...
Above 1370 ignoring downside move for intraday
Charts for Educational purposes only.
Please follow strict stop loss and risk reward if you follow the level.
Thanks,
V Trade Point
