Reliance Industries: Case of Ending DiagonalTheory:
DIAGONAL:
Diagonal are the motive waves like an impulse wave, but diagonals are different from impulse wave in that they do follow the first two Sutras (rules of impulse wave) for wave analysis, but it does not follow the third one i.e. Wave 4 should not intervene the territory of the wave 1. In a diagonal wave 4 always enters into the price territory of the wave 1.
Properties Of Diagonals:
Diagonals can be contracting or expanding type being expanding diagonal a rare one.
In contracting type, wave 3 is shorter than wave 1, wave 5 is shorter than wave 3, and wave 4 is shorter than wave 2.
In expanding type, wave 3 is longer than wave 1, wave 5 is longer than wave 3, and wave 4 is longer than wave 2.
Types Of Diagonals:
LEADING DIAGONAL
ENDING DIAGONAL
LEADING DIAGONAL: In a leading diagonal , waves 1,3, and 5 are all impulsive in nature or all in corrective form of zigzags. Wave 2 and wave 4 are always present in a zigzag form. A leading diagonal suggests the starting of a new wave & that is why it can develop wave 1 of a impulse wave and a first wave of a zigzag pattern.
ENDING DIAGONAL : This is the most common diagonal that can be found out at the ending of a main trend or main correction. It consists of all the waves 1-2-3-4-5 in a single or multiple zigzags. They can be found placed at 5th wave of an impulse wave or can been seen as a wave ‘C’ of a corrective waves zigzags or flat.
After the termination of the diagonal , a swift & a sharp reversal takes place which bring the prices back to the level from where the diagonal has began. (generally it retrace back to the wave-2 of the diagonal structure)
TRADING PLAN:
Stock is likely to hold above 1156 on any weakness and recover towards 1290-1300 in the coming days and weeks ahead.
RIGD trade ideas

Above 1200 Reliance can move upward otherwise it will be bearishYt - chartpatern - YT - @chartpatern
As of March 4, 2025, Reliance Industries Ltd. (RIL) shares closed at ₹1,161.70, reflecting a 0.80% decrease from the previous day. This positions the stock approximately 27.80% below its 52-week high of ₹1,608.95, achieved on July 8, 2024.
Your observation that RIL's stock may exhibit bullish behavior above ₹1,200 and bearish tendencies below this threshold aligns with recent performance. The stock's current price is marginally below this pivotal level, suggesting potential bearish momentum.
Analyst sentiment remains optimistic, with a consensus rating of 'Buy' and a median price target of ₹1,559, indicating a potential upside of approximately 24.38% from current levels.
In summary, while RIL's stock is trading below the ₹1,200 mark, indicating possible bearish trends, the prevailing analyst outlook suggests confidence in the company's long-term performance.

Reliance next levels to followReliance in the direction to form Cypher or shark pattern.
Next levels to watch 1217 / 1210 / 1160

Reliance looking to bounceReliance is at its key support and it can give a good retracement towards the highs if it does not break the previous low.
Keeping the previous low as SL, one can look for a small long position

Reliance stock analysis #Reliance stock analysis=Long-term trends berish
Reliance Industries Ltd is currently in a Bearish trading position according to technical analysis indicators.

RELIANCE | Short below 1219 with small SL above 1230Disclaimer:
This is not financial advice. Please do your own research or consult with a financial advisor before making any investment decisions. Investments in stocks can be risky and may result in loss of capital.

RELIANCE | SHORT | STBTRELIANCE is weak. Price rejection from the Weekly Pivot is evident through the Bearish Pin Bar close.
Short position can be taken for a Target to 1184 price level.

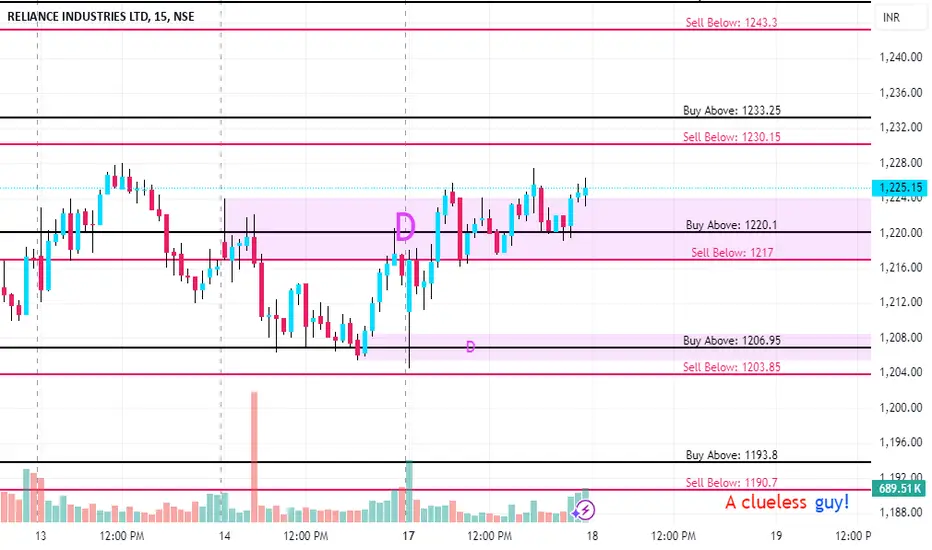
KEY LEVELS FOR 18/02/2025//description
// All credit goes to Tony for the concept of this indicator. His Trading View link: www.tradingview.com
// Note: The calculation method in this indicator differs from Tony's, but the concept is derived from his work.
I want to make it clear that I am not a seller, and this method was not taught to me by anyone. The original creator only gave me one clue:
👉 "If you get one level, you get all levels."
Everything else—the way I nail it the method and applied it—is my own work. I respect the original idea, but my approach is independent.
Explanation:
This trading system helps you avoid blind trades by providing confirmation for better entries and exits.
Entry/Exit Points:
- Entry/Exit Lines: Use the BLACK line for long trades and the RED line for short trades, based on confirmation from your trading plan.
- Stop Loss: For long trades, set the stop loss at the RED line below. For short trades, set it at the BLACK line above.
- Take Profit: For long trades, target the next RED line above. For short trades, target the next BLACK line below.
Timeframe:
Use a 5 mins timeframe for trading.
Risk Disclaimer:
This setup is for educational purposes. I'm not responsible for your gains or losses. Check the chart for more details.
RELIANCE KEY LEVELS FOR 17/02/2025//description
// All credit goes to Tony for the concept of this indicator. His Trading View link: www.tradingview.com
// Note: The calculation method in this indicator differs from Tony's, but the concept is derived from his work.
I want to make it clear that I am not a seller, and this method was not taught to me by anyone. The original creator only gave me one clue:
👉 "If you get one level, you get all levels."
Everything else—the way I nail it the method and applied it—is my own work. I respect the original idea, but my approach is independent.
Explanation:
This trading system helps you avoid blind trades by providing confirmation for better entries and exits.
Entry/Exit Points:
- Entry/Exit Lines: Use the BLACK line for long trades and the RED line for short trades, based on confirmation from your trading plan.
- Stop Loss: For long trades, set the stop loss at the RED line below. For short trades, set it at the BLACK line above.
- Take Profit: For long trades, target the next RED line above. For short trades, target the next BLACK line below.
Timeframe:
Use a 5 mins timeframe for trading.
Risk Disclaimer:
This setup is for educational purposes. I'm not responsible for your gains or losses. Check the chart for more details.

longexpected long on the stock because market seems to loosing momentum towards short higher the breaks towards upward side with strength can leads stock towards long

RIL S/R for 12/2/25Support and Resistance Levels:
Support Levels: These are price points (green line/shade) where a downward trend may be halted due to a concentration of buying interest. Imagine them as a safety net where buyers step in, preventing further decline.
Resistance Levels: Conversely, resistance levels (red line/shade) are where upward trends might stall due to increased selling interest. They act like a ceiling where sellers come in to push prices down.
Breakouts:
Bullish Breakout: When the price moves above resistance, it often indicates strong buying interest and the potential for a continued uptrend. Traders may view this as a signal to buy or hold.
Bearish Breakout: When the price falls below support, it can signal strong selling interest and the potential for a continued downtrend. Traders might see this as a cue to sell or avoid buying.
20 EMA (Exponential Moving Average):
Above 20 EMA(50 EMA): If the stock price is above the 20 EMA, it suggests a potential uptrend or bullish momentum.
Below 20 EMA: If the stock price is below the 20 EMA, it indicates a potential downtrend or bearish momentum.
Trendline: A trendline is a straight line drawn on a chart to represent the general direction of a data point set.
Uptrend Line: Drawn by connecting the lows in an upward trend. Indicates that the price is moving higher over time. Acts as a support level, where prices tend to bounce upward.
Downtrend Line: Drawn by connecting the highs in a downward trend. Indicates that the price is moving lower over time. It acts as a resistance level, where prices tend to drop.
Disclaimer:
I am not a SEBI registered. The information provided here is for learning purposes only and should not be interpreted as financial advice. Consider the broader market context and consult with a qualified financial advisor before making investment decisions.

BULLISH PATTERN IN RELIANCEMultiple Bullish Patterns..
Breakout Retest in Daily TF
Pole and Flag in 1 hr TF active above 1280 hourly candle closing
Can Expect Bullish Move
Idea Invalid if todays closing below 1260
Reliance in range from 6th Nov.. Breakout will lead to rally in long term above 1380

Reliance Build Long Set Up From Here 1. **Reliance Industries Limited (RIL)** is one of India's largest conglomerates, headquartered in Mumbai, founded by **Dhirubhai Ambani** in 1966.
2. The company operates in diverse sectors, including **petrochemicals, refining, telecommunications, retail, and digital services**.
3. RIL is India's most valuable company by market capitalization and a Fortune Global 500 entity.
4. **Mukesh Ambani** serves as the **Chairman and Managing Director**, leading the company’s expansion into new-age businesses like Jio and green energy.
5. The company’s business model is vertically integrated, spanning **upstream to downstream operations** in oil & gas, along with a strong focus on consumer businesses.
6. **Reliance Jio**, its telecom arm, revolutionized India's digital landscape by making data affordable and accessible.
7. **Reliance Retail** is the country’s largest retailer, operating supermarkets, fashion stores, and e-commerce platforms.
8. RIL is investing heavily in **renewable energy**, with plans to build gigafactories for solar, hydrogen, and battery storage solutions.
9. The company has strategic partnerships with global giants like Facebook, Google, and BP, enhancing its digital and energy initiatives.
10. With a vision for a sustainable future, Reliance continues to diversify, focusing on **innovation, digital transformation, and green energy expansion**.
"Reliance Stock: Harnessing the Power of Higher Momentum.Reliance Industries has shown remarkable progress in recent years, establishing itself as a key player in the market performer.
The company has consistently shown robust growth with its diversified business portfolio spanning petrochemicals, retail, and telecom.
NSE:RELIANCE
Its strategic investments in digital infrastructure and renewable energy are expected to drive future expansion,
Making Reliance stock a key player for investors seeking higher returns. As the company continues to innovate and adapt to market changes, its potential for higher growth remains a compelling factor for long-term investors.

RELIANCE KEY LEVEL FOR 06/02/2025**Explanation:**
This trading system helps you avoid blind trades by providing confirmation for better entries and exits.
**Entry/Exit Points:**
- **Entry/Exit Lines:** Use the BLACK line for long trades and the RED line for short trades, based on confirmation from your trading plan.
- **Stop Loss:** For long trades, set the stop loss at the RED line below. For short trades, set it at the BLACK line above.
- **Take Profit:** For long trades, target the next RED line above. For short trades, target the next BLACK line below.
**Timeframe:**
Use a 5 mins timeframe for trading.
**Risk Disclaimer:**
This setup is for educational purposes. I'm not responsible for your gains or losses. Check the chart for more details.

RELIANCE KEY LEVEL FOR 05/02/2025**Explanation:**
This trading system helps you avoid blind trades by providing confirmation for better entries and exits.
**Entry/Exit Points:**
- **Entry/Exit Lines:** Use the BLACK line for long trades and the RED line for short trades, based on confirmation from your trading plan.
- **Stop Loss:** For long trades, set the stop loss at the RED line below. For short trades, set it at the BLACK line above.
- **Take Profit:** For long trades, target the next RED line above. For short trades, target the next BLACK line below.
**Timeframe:**
Use a 5 mins timeframe for trading.
**Risk Disclaimer:**
This setup is for educational purposes. I'm not responsible for your gains or losses. Check the chart for more details.

RELIANCE | BULLISH REVERSALRELIANCE has bottomed out. Price has been forming Higher Lows since 31 Dec 2024.
Price broke out from 1267 levels, dipped and today's O=L candle confirms that Bulls have taken control.
It is quite possible that RELIANCE will hit price level of 1382 in the Feb series.
SL will be today's low.

RELIANCE KEY LEVEL FOR 04/02/2025**Explanation:**
This trading system helps you avoid blind trades by providing confirmation for better entries and exits.
**Entry/Exit Points:**
- **Entry/Exit Lines:** Use the BLACK line for long trades and the RED line for short trades, based on confirmation from your trading plan.
- **Stop Loss:** For long trades, set the stop loss at the RED line below. For short trades, set it at the BLACK line above.
- **Take Profit:** For long trades, target the next RED line above. For short trades, target the next BLACK line below.
**Timeframe:**
Use a 5 mins timeframe for trading.
**Risk Disclaimer:**
This setup is for educational purposes. I'm not responsible for your gains or losses. Check the chart for more details.

RELIANCE KEY LEVELS FOR 03/02/2025**Explanation:**
This trading system helps you avoid blind trades by providing confirmation for better entries and exits.
**Entry/Exit Points:**
- **Entry/Exit Lines:** Use the BLACK line for long trades and the RED line for short trades, based on confirmation from your trading plan.
- **Stop Loss:** For long trades, set the stop loss at the RED line below. For short trades, set it at the BLACK line above.
- **Take Profit:** For long trades, target the next RED line above. For short trades, target the next BLACK line below.
**Timeframe:**
Use a 5 mins timeframe for trading.
**Risk Disclaimer:**
This setup is for educational purposes. I'm not responsible for your gains or losses. Check the chart for more details.

Reliance IndustriesBuy with a Stop Loss 1198 for TGT - 1327.
RSI increasing from Oversold Area.
I am not SEBI Registered.

RELIANCE KEY LEVELS FOR 01/02/2025**Explanation:**
This trading system helps you avoid blind trades by providing confirmation for better entries and exits.
**Entry/Exit Points:**
- **Entry/Exit Lines:** Use the BLACK line for long trades and the RED line for short trades, based on confirmation from your trading plan.
- **Stop Loss:** For long trades, set the stop loss at the RED line below. For short trades, set it at the BLACK line above.
- **Take Profit:** For long trades, target the next RED line above. For short trades, target the next BLACK line below.
**Timeframe:**
Use a 5 mins timeframe for trading.
**Risk Disclaimer:**
This setup is for educational purposes. I'm not responsible for your gains or losses. Check the chart for more details.

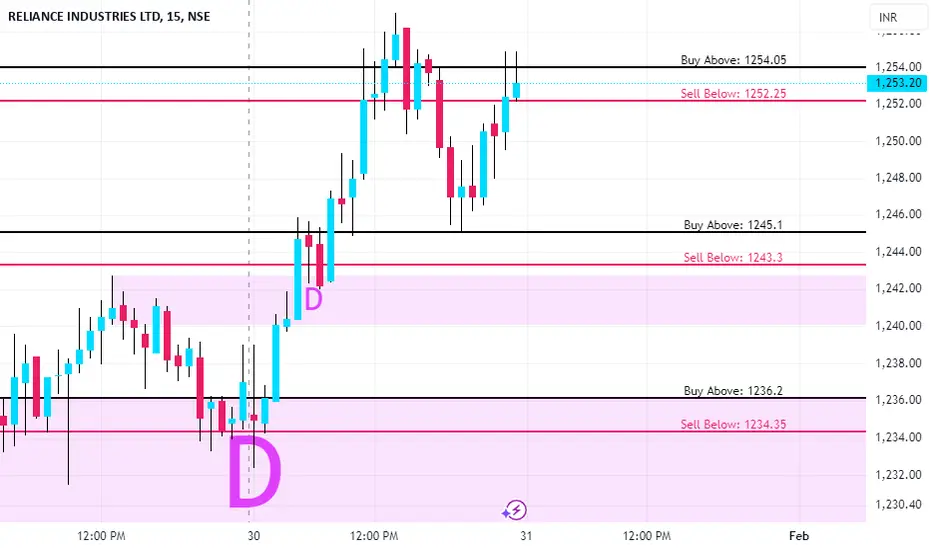
RELIANCE KEY LEVELS FOR 31/01/2025**Explanation:**
This trading system helps you avoid blind trades by providing confirmation for better entries and exits.
**Entry/Exit Points:**
- **Entry/Exit Lines:** Use the BLACK line for long trades and the RED line for short trades, based on confirmation from your trading plan.
- **Stop Loss:** For long trades, set the stop loss at the RED line below. For short trades, set it at the BLACK line above.
- **Take Profit:** For long trades, target the next RED line above. For short trades, target the next BLACK line below.
**Timeframe:**
Use a 5 mins timeframe for trading.
**Risk Disclaimer:**
This setup is for educational purposes. I'm not responsible for your gains or losses. Check the chart for more details.
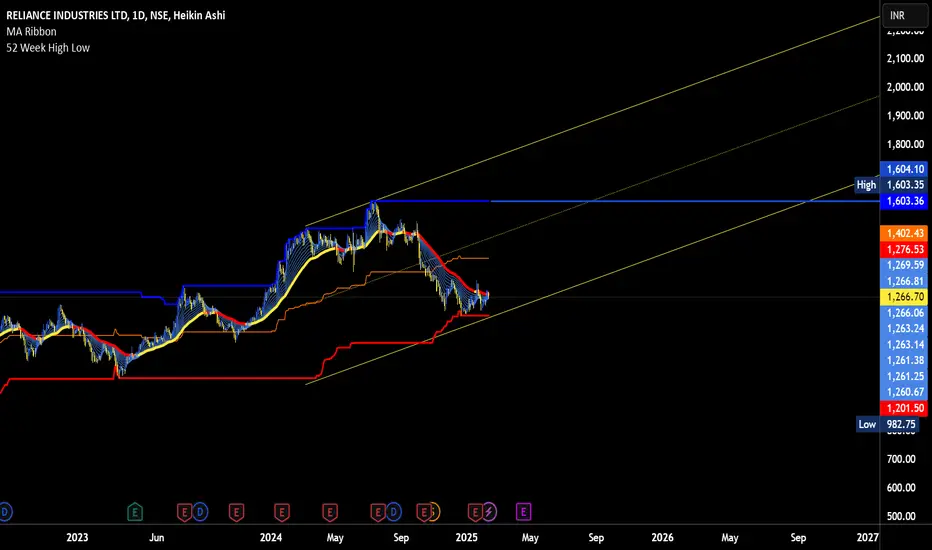
RELIANCE in Rising Parallel ChannelThis chart is a weekly timeframe analysis of Reliance Industries Ltd. (NSE: RELIANCE) , showing price movements within a rising parallel channel. The key features of the analysis include:
1. Parallel Channel (Purple)
- The price is moving within an upward-sloping channel with clear support and resistance levels.
- The lower boundary of the channel is acting as dynamic support.
- The upper boundary serves as resistance.
2. Key Support and Resistance Zones (Blue)
- The chart highlights significant horizontal support and resistance areas.
- A crucial support zone is around **₹1,200–₹1,250**, where the price is currently reacting.
- A lower support zone exists near **₹1,050–₹1,100**, which could come into play if the price breaks down.
3. Projected Scenarios (Black Arrows)
- Bullish Scenario: If the price sustains above the current support zone and reclaims ₹1,300, an upward move toward the channel's upper boundary (~₹1,500–₹1,600) is likely.
- Bearish Scenario: If the price fails to hold above the support zone and breaks the lower channel trendline, it could decline toward the next major support near **₹1,050–₹1,100**.
### Interpretation
- The price is at a **critical decision zone**, where it could either bounce and continue the uptrend or break down for further correction.
- **Traders should monitor price action around the support zone** to determine the next move.
