LSK/USD wait for a bottom.Is Lisk worth $1,4? I think it's worth a lot more than that, but we may see it's price at this level.
Volume is still weak and RSI has a problem in reaching 70 points mark for a long time.
It bounced upwards from $2,34, which was also 94.10 Fibonacci line, and reached a high of $5,39 (one could gain a 100% profit there).
But as of now it again crossed 30d EMA downwards and it seems that LISK wants to check that $2,34-2,60 lvl again.
If that support line will break, the next major one is at $1,40 mark. And possibility is quite high that it will reach that point.
-----------------
DISCLAIMER
I’m not a certified financial advisor nor a certified financial analyst. The contents posted by me are for informational and entertainment purposes only. Don't follow any analysis blindly, and make your own decisions. Always plan your trades and play with stop-loss.
If you like my charts, follow me on Twitter or Steemit.
LSKUSD trade ideas

A trading opportunity to buy in LSKUSDTechnical analysis:
. LISK/DOLLAR is in a downtrend and the beginning of uptrend is expected.
. The price is above the 21-Day WEMA which acts as a dynamic support.
. The RSI is at 49.
. The price downtrend in the daily chart is broken, so the probability of the resumption of an uptrend is increased.
Trading suggestion:
. There is a possibility of temporary retracement to suggested support zone (2.79 to 1.41). if so, traders can set orders based on Price Action and expect to reach short-term targets.
Beginning of entry zone (2.79)
Ending of entry zone (1.41)
Entry signal:
Signal to enter the market occurs when the price comes to "Buy zone" then forms one of the reversal patterns, whether "Bullish Engulfing" , "Hammer" or "Valley" in other words,
NO entry signal when the price comes to the zone BUT after any of the reversal patterns is formed in the zone.
To learn more about "Entry signal" and the special version of our "Price Action" strategy FOLLOW our lessons:
Take Profits:
TP1= @ 4.72
TP2= @ 6.00
TP3= @ 7.19
TP4= @ 9.95
TP5= @ 11.63
TP6= @ 14.57
TP7= @ 17.31
TP8= @ 33.05
TP9= Free


LSK breaking the log-downtrend with a falling wedge?LSK is sitting on the EMA20 and could break the res at $6 and the downtrend.
The last few days we have a nice increase in volume after it feels nearly dead.
After Lsk holding the $7+ EMA20 & EMA50 will cross and could give us a extra boost to the next res at $10
This only could happen with a strong BTC in the back.
My idea is that BTC will have a bullrun till mid of august because there is a hope that sec allow ETF´s (the chance for allowing ETF´s by sec is round about 25%.... this should be enough for a bullrun^^)
LSK/BTC could go down and LSK/USD up.
dont trust me blindly and dyor.

LSKUSD COMMENTSThere has been a recent downtrend in price over the past 3days, The EMAs dont show to be favorable, the RSI also shows prices currently going down. I would not recommend a buy currently in this market.


LISK: Buy zone; 700% profit potentialLisk is a perfect example of the market cycle we see all the time. This is definitely a buy zone.


Lisk update. Nobs got reKt. First buy zone reached.He he heeey!
So I guess the messiah did not appear. All the "I know something" speculators started getting out and we followed route 4.
It can keep going down a long time, and the lower it goes the more we'll buy with our sweet trading gains.
Lisk is a good project and all that stuff. It deserves getting a bit of the money we make trading.
Worth investing some in.
There's a good chance we drop sub 10$ It got bought too much, and then, when we lose the downtrend more people will feel they got scammed and the messiah did not appear and it could snowball down.
Buy some on the way down, forget about it, come back later. profit.
But be prepared to lose everything.
Thank you for the help bringing this down Bitcoin ^^
+++ I am not a financial advisor (good luck finding one in crypto). Trade at your own risk +++


LISK TO ATH $44 OR TO $1.89? - CryptoManiac101Lisk is a phenomenal coins with solid project but after such of a bearish market, we might not be done with downtrend just yet with high levels of resistance coming up at $9 - $11 range. If we do not break that resistance we will be back at just around $2
On a more positive note, with a firm break, we would go into a bull run with a mini bull run starting on firm break of downward wedge . That would lead us into $20 before 2019 and possibly even hitting ATH 0.57% of over $44 this year.
Those holding Lisk for long term, get ready for lambos in not so far away future.
Enjoy this trade advice my Crypto Maniacs, but remember to invest only what you can afford to lose or you're going right back to poverty on drop. We are not your financial advisors.


Market capitulation SHORTI think this is rising head and shoulders pattern, so finally LSK should reach about 1.5$
But this is only my point of view
I have my position for a while: waiting on the sideline, bucause of extremly low volitalyty i dont belive for any bull run in the short therm, all article and news about this is a bullSHIT
Live in peace :) and waiting for long term buying opportunity

Lisk Bullish DivergenceAfter Lisk found the bottom at $7.7, bullish divergence was formed on the RSI oscilater and price went up almost immediately. While moving higher LSK/USD broke above the descending channel and then the downtrend trendline, reaching $10 high.
The corrective wave down followed and was stopped at the 61.8% Fibonacci retracement level, that is $8.6. The Fib support has been rejected cleanly, although Lisk contiues to consolidate near that level.
It seems that now the broken downtrend trendline is now acting as the support and could be the starting point for list to start moving higher. The upside target is seen at $15.5 area, that is 427.2% Fibs applied to the current corrective wave down.
At the same time, daily break and close below $8.6 might invalidate bullish outlook and would probably extend the consolidation, rather than result in a continuation of a downtrend.


LSKUSD Lisk finally looking to form a possible head and shoulders pattern with the start of a new 5 wave mini set as well looking for this to break to the upside towards the $12 handle at least.


Lisk could drop furtherLSK/USD could slip lower on the short term despite the yesterday's aggressive rally.
A further drop will be confirmed if the rate will close below the 150% Fibonacci line of the minor ascending pitchfork. The next downside target will be at the 6.5581 static support.

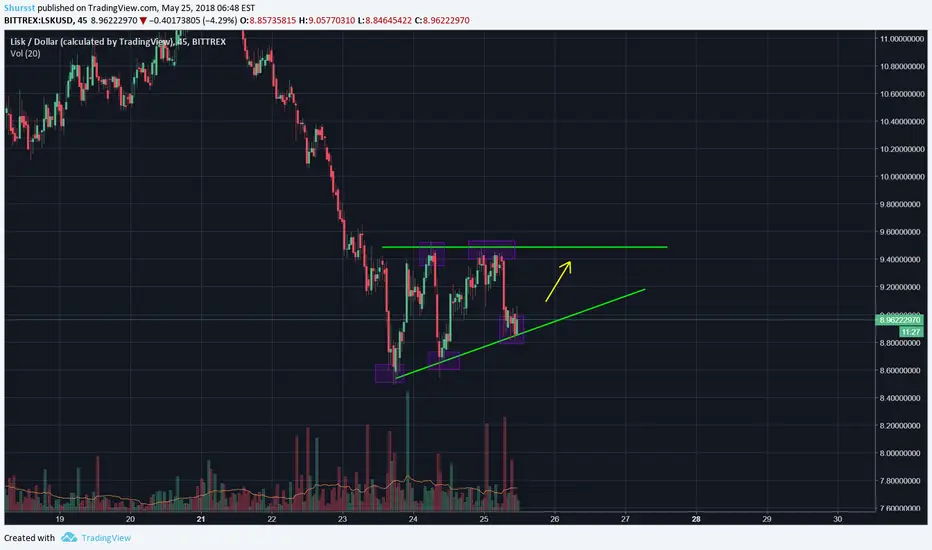
LISK: BreakoutLisk has formed a bullish pattern: Ascending Triangle. Ususally these patterns breakout on the 5th touch (purple rectangles).