Walgreens Stock Chart Fibonacci Analysis 061125Trading Idea
1) Find a FIBO slingshot
2) Check FIBO 61.80% level
3) Entry Point > 11/61.80%
Chart time frame:B
A) 15 min(1W-3M)
B) 1 hr(3M-6M)
C) 4 hr(6M-1year)
D) 1 day(1-3years)
Stock progress:B
A) Keep rising over 61.80% resistance
B) 61.80% resistance
C) 61.80% support
D) Hit the bottom
E)
Next report date
—
Report period
—
EPS estimate
—
Revenue estimate
—
−6.4483 EUR
−7.82 B EUR
133.67 B EUR
712.72 M
About Walgreens Boots Alliance, Inc.
Sector
Industry
CEO
Timothy C. Wentworth
Website
Headquarters
Deerfield
Founded
1909
Walgreens Boots Alliance, Inc. engages in the provision of healthcare and retail pharmacy services. It operates through the following segments: United States Retail Pharmacy, International, and United States Healthcare. The US Retail Pharmacy segment includes the operation of retail drugstores, health and wellness services, specialty and home delivery pharmacy services, and equity method investment. The International segment offers pharmacy-led health and beauty retail businesses outside the US and the pharmaceutical wholesaling and distribution business in Germany. The US Healthcare segment delivers improved health outcomes and lower costs for payors and providers through owned and partnered assets. The company was founded by Charles R. Walgreen and John Boot in 1909 and is headquartered in Deerfield, IL.

Walgreen Boots Long.Walgreen boots. WBA Long. target 33. Gann Fann. Bullish. By the end of summer max.

WBA SL-$9,76 TP-$11,29Technical Analysis:
Engulfing candle with high volume on the daily chart
Support at the Ichimoku Cloud on the daily chart
Momentum

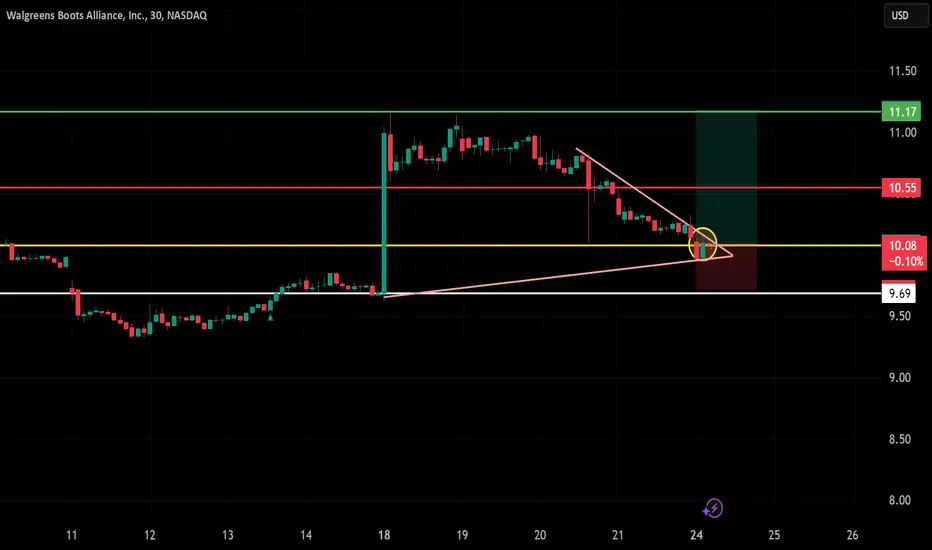
WBA – 30-Min Long Trade Setup!📌
🔹 Asset: Walgreens Boots Alliance, Inc. (WBA)
🔹 Timeframe: 30-Min Chart
🔹 Setup Type: Falling Wedge Breakout Long Trade
📌 Trade Plan (Long Position)
✅ Entry Zone: Above $10.09 (Breakout Confirmation)
✅ Stop-Loss (SL): Below $9.69 (Break of Support & Trendline)
🎯 Take Profit Targets
📌 TP1: $10.5
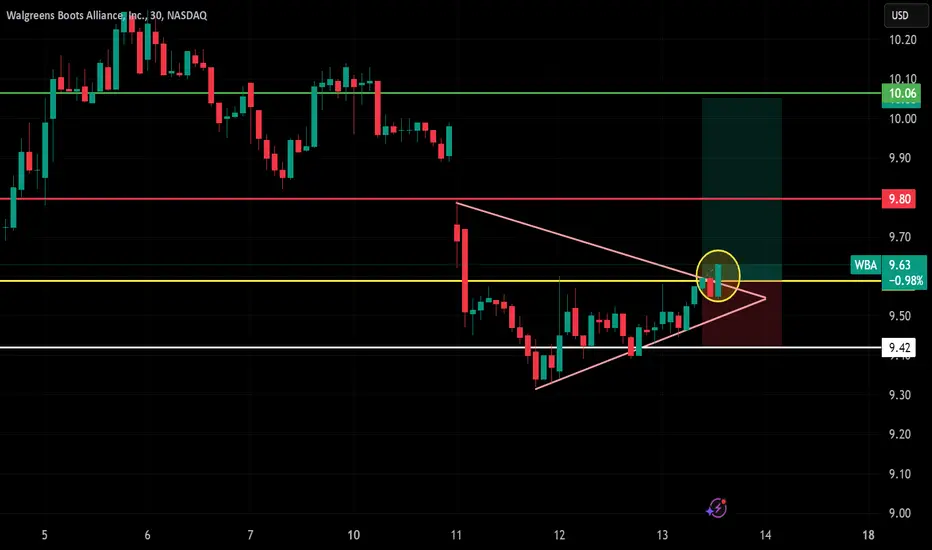
Long Trade Setup Breakdown for Walgreens 30Mins📊
🔹 Asset: Walgreens Boots Alliance, Inc. (WBA)
🔹 Timeframe: 30-Min Chart
🔹 Setup Type: Symmetrical Triangle Breakout
🚀 Trade Plan (Long Position):
✅ Entry Zone: $9.59 (Breakout Confirmation)
✅ Stop-Loss (SL): $9.42 (Below Support)
🎯 Take Profit Targets (Long Trade):
📌 TP1: $9.80 (First Resistanc
$WBA Walgreens Boots Alliance Inc. - - Fib GP Support Lost
- Channel Trendline Back-test
- 2024 close $9.33
- 0.786 Fib $9.19
⏰⏰ NYSE:CVS earnings ⏰⏰

WBA Walgreens boot alliance 24hr potterboxes.WBA Walgreens boot alliance 24hr potterboxes.well Walgreens is looking good for a long term trade option. probably go out to july18 , $15 dollar calls for about .08 maybe a stop out at $10.00 and take some profit at 15.00 dollars and $18.00 dollars.. That's is what I would probably do. Educational

Walgreens Boots Alliance.
Following WBA since early Sep24. Both structural and basic technical analysis work well in this name. Optimistic version is presented.

WBA NUMBERS AND MANAGEMENT LOOKS GREAT SHORT TERMThis is a trade that is highly interesting for investors both in the short and long term. It would be optimal if I can accumulate all the buying opportunities up to around 15, then trim the position and hold a smaller portion for the long term. I truly believe this could be a great point to invest i

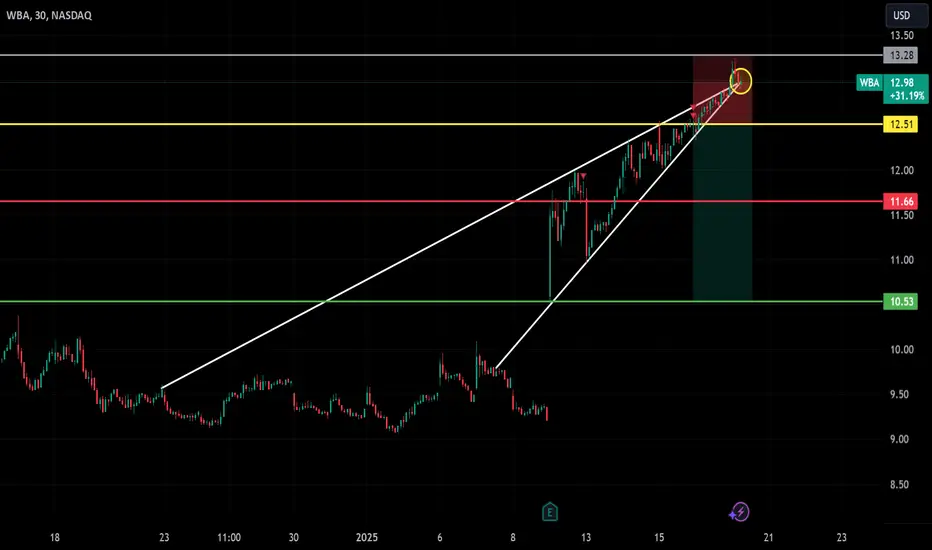
WBA Short Trade Setup | Entry, SL, T1, T2! 📉
Entry: $12.98 (breakdown level)
Stop Loss (SL): $13.28 (marked in red) 🚫
Target 1 (T1): $12.51 (marked in yellow) 🟡
Target 2 (T2): $10.53 (marked in green) ✅
Reason: Rising wedge breakdown indicates bearish momentum. Entry at $12.98 confirms potential downside.
#WBA #ShortTrade #StockMarket #T
See all ideas
Summarizing what the indicators are suggesting.
Neutral
SellBuy
Strong sellStrong buy
Strong sellSellNeutralBuyStrong buy
Neutral
SellBuy
Strong sellStrong buy
Strong sellSellNeutralBuyStrong buy
Neutral
SellBuy
Strong sellStrong buy
Strong sellSellNeutralBuyStrong buy
An aggregate view of professional's ratings.
Neutral
SellBuy
Strong sellStrong buy
Strong sellSellNeutralBuyStrong buy
Neutral
SellBuy
Strong sellStrong buy
Strong sellSellNeutralBuyStrong buy
Neutral
SellBuy
Strong sellStrong buy
Strong sellSellNeutralBuyStrong buy
Displays a symbol's price movements over previous years to identify recurring trends.
WAG5869718
Walgreens Boots Alliance, Inc. 8.125% 15-AUG-2029Yield to maturity
6.58%
Maturity date
Aug 15, 2029
WAG4976358
Walgreens Boots Alliance, Inc. 4.1% 15-APR-2050Yield to maturity
5.61%
Maturity date
Apr 15, 2050
WAG4182650
Walgreens Boots Alliance, Inc. 4.8% 18-NOV-2044Yield to maturity
5.57%
Maturity date
Nov 18, 2044
WAG4182648
Walgreens Boots Alliance, Inc. 4.5% 18-NOV-2034Yield to maturity
5.11%
Maturity date
Nov 18, 2034
WAG4976357
Walgreens Boots Alliance, Inc. 3.2% 15-APR-2030Yield to maturity
4.32%
Maturity date
Apr 15, 2030
See all A12HJF bonds
Curated watchlists where A12HJF is featured.


Related stocks
Frequently Asked Questions
The current price of A12HJF is 9.8270 EUR — it has increased by 0.20% in the past 24 hours. Watch Walgreens Boots Alliance, Inc. stock price performance more closely on the chart.
Depending on the exchange, the stock ticker may vary. For instance, on LSX exchange Walgreens Boots Alliance, Inc. stocks are traded under the ticker A12HJF.
A12HJF stock has fallen by −0.26% compared to the previous week, the month change is a −2.72% fall, over the last year Walgreens Boots Alliance, Inc. has showed a 22.95% increase.
We've gathered analysts' opinions on Walgreens Boots Alliance, Inc. future price: according to them, A12HJF price has a max estimate of 12.95 EUR and a min estimate of 8.63 EUR. Watch A12HJF chart and read a more detailed Walgreens Boots Alliance, Inc. stock forecast: see what analysts think of Walgreens Boots Alliance, Inc. and suggest that you do with its stocks.
A12HJF reached its all-time high on Jan 17, 2025 with the price of 12.8300 EUR, and its all-time low was 7.6980 EUR and was reached on Nov 20, 2024. View more price dynamics on A12HJF chart.
See other stocks reaching their highest and lowest prices.
See other stocks reaching their highest and lowest prices.
A12HJF stock is 2.61% volatile and has beta coefficient of 0.19. Track Walgreens Boots Alliance, Inc. stock price on the chart and check out the list of the most volatile stocks — is Walgreens Boots Alliance, Inc. there?
Today Walgreens Boots Alliance, Inc. has the market capitalization of 8.51 B, it has increased by 0.53% over the last week.
Yes, you can track Walgreens Boots Alliance, Inc. financials in yearly and quarterly reports right on TradingView.
Walgreens Boots Alliance, Inc. is going to release the next earnings report on Jun 26, 2025. Keep track of upcoming events with our Earnings Calendar.
A12HJF earnings for the last quarter are 0.61 EUR per share, whereas the estimation was 0.52 EUR resulting in a 17.85% surprise. The estimated earnings for the next quarter are 0.28 EUR per share. See more details about Walgreens Boots Alliance, Inc. earnings.
Walgreens Boots Alliance, Inc. revenue for the last quarter amounts to 37.20 B EUR, despite the estimated figure of 36.60 B EUR. In the next quarter, revenue is expected to reach 32.41 B EUR.
A12HJF net income for the last quarter is −2.75 B EUR, while the quarter before that showed −250.59 M EUR of net income which accounts for −997.91% change. Track more Walgreens Boots Alliance, Inc. financial stats to get the full picture.
Yes, A12HJF dividends are paid quarterly. The last dividend per share was 0.24 EUR. As of today, Dividend Yield (TTM)% is 8.78%. Tracking Walgreens Boots Alliance, Inc. dividends might help you take more informed decisions.
As of Jun 14, 2025, the company has 312 K employees. See our rating of the largest employees — is Walgreens Boots Alliance, Inc. on this list?
EBITDA measures a company's operating performance, its growth signifies an improvement in the efficiency of a company. Walgreens Boots Alliance, Inc. EBITDA is 2.76 B EUR, and current EBITDA margin is 2.87%. See more stats in Walgreens Boots Alliance, Inc. financial statements.
Like other stocks, A12HJF shares are traded on stock exchanges, e.g. Nasdaq, Nyse, Euronext, and the easiest way to buy them is through an online stock broker. To do this, you need to open an account and follow a broker's procedures, then start trading. You can trade Walgreens Boots Alliance, Inc. stock right from TradingView charts — choose your broker and connect to your account.