LTC bottom in?Hi everyone,
There are a lot of opportunities lately! I had never really intended to buy LTC but this looks like a great time to do so.
Weekly USD RSI cross above 50 and bounce, resting on supports without a major breakout yet. First target is 225 (20% increase).
Weekly BTC ratio looks to be bottomed out with a steady increase in RSI to the midline (although averages are still of course negative for the time being). Watch for the BTC ratio to be supported by the weekly 17 EMA which will likely occur after this initial 20% jump.
Entry is anywhere from 170-185 (current price). I would enter with a % of total you are willing you place in and follow up with the other when the 17 EMA support occurs. I'll update if we get to that point. I would consider exiting if the BTC ratio breaks out of the current BTC trendline curve and BTC RSI does not break above 50.
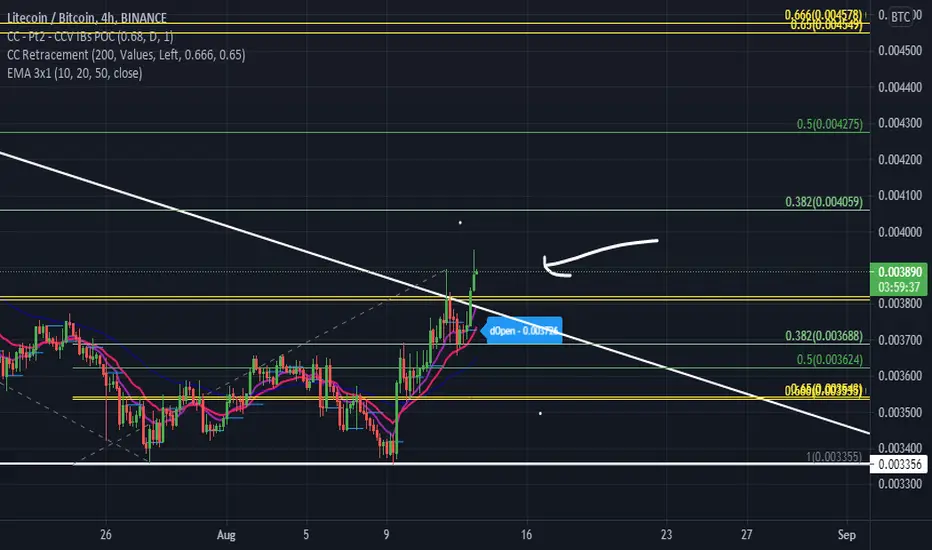
TP at 0.004670 or $225 and reevaluate.
I'm personally still in the DOT trade but I am definitely considering either splitting up the trade or moving other assets into this. I think due to my personal risk tolerance I would wait until the BTC ratio rests on that support but I commend anyone willing to try to catch the bottom!
Good luck as usual!
LTCBTC trade ideas


Litecoin looking for a breakout against BTC!Litecoin has been really struggling as of late with us continuing to push down following this descending channel, one positive we have seen is that we have broken up into the upper half of the channel, but we still can't seem to breakout! We could be looking at a breakout sooner than later, looking at the bollinger bands we seem to be also stuck underneath the midline which as of right now acts as resistance, if we are going to move anywhere to the upside we need to see a strong push above this level and sort of target that top band so we can take it for a ride upwards. The MACD looks to be coming to an end of this current bearish cycle we see the blue MA pushing upwards looking for that bullish cross, i figure we will see this in the next couple days but we have to watch for a healthy histogram and healthy separation in the MA's! The Wavetrend aswell seems to be coming out of its little bearish cycle, we are seeing the wave starting to push back up, but we definitely still have some work to do like making sure we can fully cross that midline without any hold ups! Overall looking pretty good for LTC which tends to lag behind the rest of the market, looking for a breakout in the coming days/weeks! Not financial advice just my opinion!

LTC/USD, ETH/USD, Technical Outlook, Edition #93 (31/08/2021)Buyers kick into gear as Bitcoin consolidates at retracement zone
Bulls spring to life with the optimistic sideways consolidation presenting some excellent dip-buying opportunities.
Meanwhile, the 0.5 fib retracement zone at USD 46.8K continues to hold.
Sustaining both the D1 20 EMA (GREEN) and D1 200 MA (BLUE) adds bullish confluence to the zone - while the BTC/USD trading pair maintains consolidation overhead.
Price action must now climb above USD 49.2K, where a successful recapture may inspire a further leg up to the .618 fib retracement zone at USD 51K.
Bitcoin, BTC/USD - Daily (D1)
Bitcoin, BTC/USD - 4 Hour (H4)
Bitcoin, BTC/USD - 1 Hour (H1)
The hourly BTC/USD chart illuminates the significant value of achieving above USD 49K.
Now, looking to Ethereum...
Qluster analysts underscore that beyond the bullish consolidation, the second-largest cryptocurrency appears to be the leader of the two.
Ethereum, ETH/USD - Daily (D1)
The ETH/USD trading pair seems ready to rally up to USD 3.7K - the next major resistance zone.
However, buyers must secure a daily close above the .618 fib retracement level at USD 3.36K for this perspective to carry substance.
Ethereum vs. Bitcoin, ETH/BTC - Daily (D1)
The cross pair re-affirms technical bullishness as ETH/BTC breaks out of downward sloping resistance.
Following a successful breakout, price distribution appears primed and ready to tackle the .618 fib retracement zone at 0.072216 SAT.
Litecoin, LTC/USD - Daily (D1)
From a risk to reward perspective, Litecoin is attractive but bashful.
While it is the most enticing of the three cryptocurrencies reviewed in tonight’s report, Qluster analysts emphasise its present dormancy.
A proverb for Litecoin short-sellers mistaking hibernation for vulnerability:
Wake not a sleeping lion.
Litecoin vs. Bitcoin, LTC/BTC - Daily (D1)
Qluster analysts intend to observe Litecoin closely as it continues consolidating.
See the LTC/BTC breakout and retest forecasts above - pending a flip of both the D1 20 EMA (GREEN) and D1 50 MA (RED) into support.
Q’s Conclusion
In light of the technical analysis, cryptocurrency seems to remain bullish, with BTC/USD price action approaching the conclusion of its consolidation period.
It is truly incredible what can occur within 24 hours, simply by being patient and waiting for the market to produce added confirmation.
Our regular readers must now understand patience’s pivotal role in being a calm and collected technical practitioner.
See you again for the next update.
- q
Follow us for more detailed analysis on all markets, including Decentralised technology. Find us on Facebook and Join our Group!

ltc/btc best area for up!hi guys!
ltc/btc strong support on 0.003 and positive Divergence can show on chart
targets :
tp1: 0.018
tp2: 0.025
tp3: 0.030

LTC/BTC, Monthly ChartA chart missed out by many showing some bomb movement for LTC, the pump from the bottom could've been predicted by this too ;)
before dipping this might just touch 4500 sats

$LTC/$BTCPriced in Bitcoin, Litecoin is now approaching the Apex of a MASSIVE FALLING WEDGE. This is a MEGA BULLISH Pattern. While we did have a quick explosion in price earlier, it was a "false breakout". The next one will be the REAL DEAL!!! PS--Litecoin is possibly one of the most hated majors at the moment. As a contrarian, this is about as BIG a contrarian play as $XRP. I Buy what others loathe. There is a reason there is a 1%. You cant make BIG returns unless your willing to be mocked for the short term, just to look like a genius in the long run. To me you are being handed a gift. The only thing that can derail my Bullish outlook on $LTC are 1) government regs and 2) a technical break down on the $USD pair under $97.


LTC/BTC - 26% Possible GainsIn this chart we see this support line been held since Mar/17, with almost no touches to it and also no closes below.
Right now LTC is very close to this support line, and we might be on the verge of a short term reversal until the touch of the above resistance line.
I'm taking this long with a RR of 3.12, since we have a bullish momentum on the market.
Entry Point: 0.003480 - 0.003530
TP1: 0.003630
TP2: 0.003764
TP3: 0.003905
TP4: 0.004026
TP5: 0.004278
TP6: 0.004463
SL: 0.003231
I'm using a moving SL as TPs get hit.
Thank you for reading.

LTCBCT back in rangeFailed to breakout of the descending channel after breaking out of the falling wedge. It is possible price will retest the falling wedge. On the USD pair, LTCBTC broke down from a rising widening wedge with a measured move of $64. Currently I see price bouncing around the range, and breaking down in the near future, touching bottom.
Last January I outlined a path for LTCBTC and called for a bottom at 0.023-0.035, after which there will be a major bullrun, that I projected the timing with the help of a special gann fann, this idea still holds. The gann fann I designed in June 2020. All of the ideas are listed below and I suggest that they be reviewed.
If you are disheartned by the drop, you shouldn't. This is the true nature of Crypto, it is volatile and volatility is money if you are prepared. Early this year I warned that LTC can retrace, and got very bad feedback from people that think price action is "up only". Price action is up and down. There will be a bullrun for LTC, it will not die, although personally I think it is a clone of BTC that has not been updated and can be replaced in the future, but it has its own network that the successful meme coin Doge uses and it has enough liquidity and quick transaction relative to BTC for LTC to be useful as currency. In fact, I believe in the next altrun LTC will outperform ETH from time to time, which warrants a flipping between ETH and LTC if you like such a play.

Litecoin will wake upHello friends , show your love and push like button . litecoin update : it is interesting that from 5 aprils analys nothing has changed , check related ideas down below . bearish trendline is about to end , rsi shows huge positive divergence as well , bearish volume is decreasing and everything is getting ready for a bull run for litecoin , as i said manytimes i belive in supercycle and i dont consider it finished untill litecoin is above 1000 $
see you there

LTCBTC:Is the bearish cycle about to end? The trade of the year?LTCBTC, as we can see on the charts have been on a massive downtrend for a couple years. Price tried to break above the resistance line (long term trendline) but failed to stay above. For many that could be a bad sign but in my experience that usually happens often when price is showing signs that the trend could reverse, in this case, could be for the long term because the analysis is based on the higher timeframes.
Important factors to mention regarding price action:
Price held nicely above the Monthly demand area. Price bounced creating a weekly demand, tried to break the trend but failed and returned to its original price point. Once again, this time price managed to bounce after creating a double bottom on top of the weekly demand previously created, which aligns with the monthly demand.
Price is currently sitting above a 4 hour demand area creating plenty of support.
With that being said, we are soon to be facing a daily supply area (marked in red) which could either make price push down again or keep price in a range between the daily and 4 hour levels. (I do believe the daily area will be broken, taking the liquidity of the sellers in that area).
The level that I will be looking the most is the Weekly supply (marked in violet) above the dynamic resistance (trendline). I do believe that that is the area that will challenge price the most.
A good sign would be for price to break the dynamic resistance and in the near future end up breaking the weekly supply zone, which will make price to rally and provide massive returns to the long traders. Failure to break the daily area or get above the dynamic resistance will invalidate the idea.

LTCBTC is inside a falling wedge 🦐LTCBTC is inside a falling wedge. IF the price will have a breakout, According to Plancton's strategy (check our Academy ), we can set a nice order
–––––
Follow the Shrimp 🦐
Keep in mind.
🟣 Purple structure -> Monthly structure.
🔴 Red structure -> Weekly structure.
🔵 Blue structure -> Daily structure.
🟡 Yellow structure -> 4h structure.
⚫️ Black structure -> <4h structure.

LTC/BTC break from the triangle, cheersLooking like LTC broke from BTC dominance, a leg up is likely to happen.
LTCBTC: Finally... Time to Grow!!!
Hey traders,
It looks like LTCBTC is finally ready for a strong bullish rally:
the market formed a huge double bottom formation on hourly
and broke and closed above a resistance line of a major falling wedge pattern.
The growth is expected to 0.0041
❤️Please, support this idea with a like and comment!❤️

Is Litecoin dead?? Probably yes...:)
Price of LTC is currently around 160USD. BUT this price is going up bcs bitcoin is growing...
Check the chart litecoin/bitcoin. This chart is still in downtrend. This is more then 3 years long downtrend!!
If (maybe not) litecoin breaks the red bearish resist then we will see big bullish rally on this coin.Targets for LTC/USD will be 500USD and more.
If not, then...in this case is better to trade another coin :)

LTC/BTCWe got a wick above the triangle today and got rejected the battle is still going, stay tuned for this set up

Looking at this triangle to break, LTC/BTC$LTC is battling hard to Break this triangle, I v been looking at it for a month now, we wicked above it today, got rejected, if we break above we may see $LTC going for huge run up, 295$-310$ is a major resistance (CC Pocket)

Ltc ready to gain against Btcltc has bottomed out for the final time and has started its up trend against btc. This is just a chart idea.

Watching out LTCBTCAs everything is clear on the chart, you can consider long or short positions depending on what market decides to do in next hours.
With risk management you can also consider a long on consolidation between the support and resistance.
Consider the linked ideas as well.
Best Regards,
Median Eagle.

What I am looking at for $LTC to break against $ BTCEyeing this triangle, and waiting for $LTC to make a move to the upside before it starts rallying.

LTC/BTCSetting Above The Long Term Trend Line ,If a Price Breakout From The 0.003705 Level It’s a Buy Trigger.

LTC Big Move Coming??!looking at the Litecoin BTC chart and you notice a lot of price action against this downtrend support/resistance, we are currently right on this resistance and we seem to be slipping below this level, now i think we could see a potential drop in sats, we gotta be careful treading along the bottom of the bollinger bands, this could very well induce a pullback if we continue to ride the bottom. Something you notice on the bollinger bands is that we are beginning to squeeze which means volatility is shrinking and we could be in for a big run, now the only problem is that we don't get an idea of which direction, personally i think we will see the move to the upside just based on the fact that the market is waking up again and getting back into bullish mode. Looking at the pivot points we definitely have some work to do, we need to get up and above this bullish pivot point where we could get an overall trend reversal because its clear we are stuck in a downtrend since late May. Checking out the MACD we are looking a little bearish, we are coming up soon on what looks like a bearish cross unless we see an unlikely bounce, our histogram is getting close to that midpoint where we could soon see some red bars, i think this will likely be a short term pullback if we see one and then i imagine we will see LTC start to wake up a bit, very key is first of all reaching that pivot point and staying above that and also not getting stuck under this downtrend resistance! Not financial advice just my opinion!
