Litecoin (LTC) Breaks Key Support – Bears Eye Next Major SupportLitecoin (LTC) has taken a sharp bearish turn as the latest monthly close fell decisively below the critical $97.12 support level. This breakdown signals a major shift in market sentiment, reinforcing the downside risks for the cryptocurrency. As broader market conditions remain uncertain, Litecoin now faces the possibility of further downside momentum, with the next significant support level resting at $57.70.
Bearish Outlook Strengthens
The monthly candlestick chart confirms a significant rejection from recent highs, forming a strong red candle that suggests continued selling pressure. The break below $97.12, a long-standing support level, paves the way for deeper losses and a potential retest of lower support zones. The technical landscape remains in favor of the bears, raising concerns over Litecoin’s short-term recovery prospects.
Why the Bears Are in Control
Several key factors contribute to Litecoin’s bearish momentum:
Technical Breakdown: The confirmed close below $97.12 eliminates a crucial demand zone, turning it into new resistance. This breakdown invalidates previous bullish attempts to reclaim higher ground, making the path of least resistance to the downside.
Momentum Shift: The failure to sustain prices above the critical level of $132.36 had indicated weakening bullish strength and a potential continuation of the downtrend.
Market Conditions: Broader cryptocurrency market weakness, declining investor confidence, and risk-averse trading behavior have compounded the selling pressure on Litecoin.
Price Targets
Immediate Resistance: $97.12 (now acting as resistance)
Bearish Target: $57.70 (next major key support level)
As Litecoin struggles to find support, traders should watch for potential relief bounces, which may provide short-term selling opportunities before the next major leg down. If bearish momentum persists, a move toward $57.70 could materialize in the coming weeks.
Litecoin’s Technology and Vision: Is There Still Hope?
Despite its current technical struggles, Litecoin remains one of the most well-established cryptocurrencies in the market. Created in 2011 by Charlie Lee, Litecoin was designed as a faster and more efficient alternative to Bitcoin. Often referred to as the “silver to Bitcoin’s gold,” Litecoin has continued to evolve over the years, maintaining its relevance in the industry through continuous upgrades and improvements.
Key Technological Features
Faster Transactions: Litecoin’s block generation time is 2.5 minutes, significantly faster than Bitcoin’s 10-minute blocks. This allows for quicker transaction confirmations and improved usability for everyday payments.
Low Transaction Fees: Litecoin offers a cost-effective way to transfer value compared to Bitcoin, making it attractive for microtransactions and cross-border payments.
Security and Decentralization: Utilizing the Proof-of-Work (PoW) consensus mechanism with the Scrypt hashing algorithm, Litecoin remains secure and resistant to attacks while offering more efficient mining options.
Integration of MimbleWimble: Litecoin has integrated MimbleWimble, a privacy-enhancing technology that improves fungibility and scalability while ensuring confidential transactions.
Litecoin’s Long-Term Vision
Litecoin continues to push forward with its goal of becoming a leading digital payment solution. The Litecoin Foundation has actively worked on merchant adoption, partnerships, and technical enhancements to improve scalability and usability. Despite current market conditions, the project remains committed to advancing cryptocurrency adoption and serving as a viable alternative for digital transactions.
However, technical challenges and bearish sentiment in the market have overshadowed Litecoin’s fundamental strengths. While the technology remains robust, price action continues to be dictated by broader market sentiment, making it essential for traders to monitor key technical levels.
Conclusion
Litecoin’s recent breakdown below $97.12 marks a crucial turning point in its price action. While the long-term vision and technological advancements remain intact, the immediate outlook leans bearish, with the next major support level at $57.70. Traders should remain cautious, watching for potential relief rallies that could provide opportunities for re-entry before further downside.
LTCBULLUSD trade ideas

Trading balanceTrading balance The price of the asset has rebounded from the balance zone. With the prospect of growth into the resistance zone.
#LTCUSD #Signals #Tramp
LTC breaking down - bad news for the crypto market- for the past three months, Litecoin has been forming an extremely clear daily range
- now trading below range low and, furthermore, range low has been re-tested and rejected as resistance
- target almost 40% lower which implies a strong downside move is around the corner for the entire crypto market

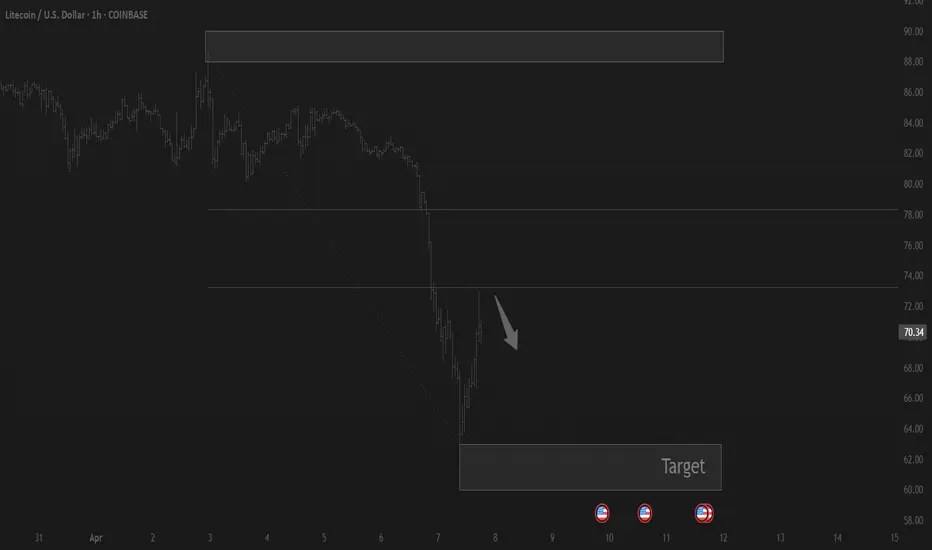
LTCUSD Litecoin OH NO TARIFFS! Everyone SELL NOW!The market reacted to the tariffs negatively as expected. I don't think these tariffs will last long. Countries will cave and remove their tariffs. Bottom line is they need us more than we need them. Once global free and easier trade starts you're going to see a boom cycle like never before. This is the bottom and the beginning of the biggest bull run you'll ever see. I don't get involved in politics but this move that Trump made with the tariffs is going to be a major positive for the USA and the world moving forward. This isnt 1929, we live in a much more advanced world now. Collapses and depressions are a thing of the past in my opinion.
As for Litecoin I see it coming down to test around $70 dollars by the middle of April. This is also timed almost perfectly to the 2017 run Litecoin had, coincidentally trump was starting his first term in 2017 as well. Also timed perfectly to when tax day is over for USA.
Many have capitulated and sold everything thinking a giant recession is coming, or a war, or a collapse, or aliens, or you name it people are scared of their own shadows lately. Like a plague of Grackles where one gets spooked and the whole lot of them get scared and take off when they dont even know why. This is how the markets work though, most will make the wrong decision so the few who made the right decision can profit from their mistakes. Once the market starts to run again those who sold will think its just a fake pump or dead cat bounce and wont buy in. Then the market will continue to rise and rise and finally when its near an all time high those who capitulated and sold early will fomo back in and buy the top to provide liquidity for those who were called crazy for buying the bottom. Its a cycle thats been happening since markets started.
So Im sticking with my predictions for Litecoin, I am not falling for this bear trap crap. Im doubling down. This is not financial advice. This is just my opinion.
LTC/USD "Litecoin vs U.S.Dollar" Crypto Heist (Scalping/Day)🌟Hi! Hola! Ola! Bonjour! Hallo! Marhaba!🌟
Dear Money Makers & Thieves, 🤑 💰🐱👤✈️
Based on 🔥Thief Trading style technical and fundamental analysis🔥, here is our master plan to heist the LTC/USD "Litecoin vs U.S.Dollar" Crypto market. Please adhere to the strategy I've outlined in the chart, which emphasizes long entry. Our aim is the high-risk Yellow MA Level. Risky level, overbought market, consolidation, trend reversal, trap at the level where traders and bearish robbers are stronger. 🏆💸"Take profit and treat yourself, traders. You deserve it!💪🏆🎉
Entry 📈 : "The heist is on! Wait for the MA breakout (85.00) then make your move - Bullish profits await!"
however I advise to Place Buy stop orders above the Moving average (or) Place buy limit orders within a 15 or 30 minute timeframe most recent or swing, low or high level after the MA breakout.
📌I strongly advise you to set an "alert (Alarm)" on your chart so you can see when the breakout entry occurs.
Stop Loss 🛑: "🔊 Yo, listen up! 🗣️ If you're lookin' to get in on a buy stop order, don't even think about settin' that stop loss till after the breakout 🚀. You feel me? Now, if you're smart, you'll place that stop loss where I told you to 📍, but if you're a rebel, you can put it wherever you like 🤪 - just don't say I didn't warn you ⚠️. You're playin' with fire 🔥, and it's your risk, not mine 👊."
📌Thief SL placed at the nearest/swing low or high level Using the 30m timeframe (81.00) Day trade basis.
📌SL is based on your risk of the trade, lot size and how many multiple orders you have to take.
Target 🎯:
✂Primary Target - 88.70
✂Secondary Target - 93.00
LTC/USD "Litecoin vs U.S.Dollar" Crypto Market Heist Plan (Day / Scalping Trade) is currently experiencing a bullishness,., driven by several key factors.👇
📰🗞️Get & Read the Fundamental, Macro, COT Report, On Chain Analysis, Sentimental Outlook, Intermarket Analysis, Future trend targets.. go ahead to check 👉👉👉🔗
⚠️Trading Alert : News Releases and Position Management 📰 🗞️ 🚫🚏
As a reminder, news releases can have a significant impact on market prices and volatility. To minimize potential losses and protect your running positions,
we recommend the following:
Avoid taking new trades during news releases
Use trailing stop-loss orders to protect your running positions and lock in profits
💖Supporting our robbery plan 💥Hit the Boost Button💥 will enable us to effortlessly make and steal money 💰💵. Boost the strength of our robbery team. Every day in this market make money with ease by using the Thief Trading Style.🏆💪🤝❤️🎉🚀
I'll see you soon with another heist plan, so stay tuned 🤑🐱👤🤗🤩

"Litecoin vs U.S Dollar" Crypto Market Heist Plan (Swing Trade)🌟Hi! Hola! Ola! Bonjour! Hallo! Marhaba!🌟
Dear Money Makers & Robbers, 🤑 💰💸✈️
Based on 🔥Thief Trading style technical and fundamental analysis🔥, here is our master plan to heist the LTC/USD "Litecoin vs U.S Dollar" Crypto Market. Please adhere to the strategy I've outlined in the chart, which emphasizes long entry. Our aim is the high-risk Red Zone. Risky level, overbought market, consolidation, trend reversal, trap at the level where traders and bearish robbers are stronger. 🏆💸"Take profit and treat yourself, traders. You deserve it!💪🏆🎉
Entry 📈 : "The heist is on! Wait for the MA breakout (96.00) then make your move - Bullish profits await!"
however I advise to Place Buy stop orders above the Moving average (or) Place buy limit orders within a 15 or 30 minute timeframe most recent or swing, low or high level.
📌I strongly advise you to set an alert on your chart so you can see when the breakout entry occurs.
Stop Loss 🛑:
Thief SL placed at the recent/swing low level Using the 2H timeframe (86.00) swing trade basis.
SL is based on your risk of the trade, lot size and how many multiple orders you have to take.
🏴☠️Target 🎯: 111.00 (or) Escape Before the Target
🧲Scalpers, take note 👀 : only scalp on the Long side. If you have a lot of money, you can go straight away; if not, you can join swing traders and carry out the robbery plan. Use trailing SL to safeguard your money 💰.
LTC/USD "Litecoin vs U.S Dollar" Crypto Market Heist Plan (Swing Trade) is currently experiencing a bullishness,., driven by several key factors.
📰🗞️Get & Read the Fundamental, Macro, COT Report, On Chain Analysis, Sentimental Outlook, Intermarket Analysis, Future trend targets.. go ahead to check 👉👉👉
📌Keep in mind that these factors can change rapidly, and it's essential to stay up-to-date with market developments and adjust your analysis accordingly.
⚠️Trading Alert : News Releases and Position Management 📰 🗞️ 🚫🚏
As a reminder, news releases can have a significant impact on market prices and volatility. To minimize potential losses and protect your running positions,
we recommend the following:
Avoid taking new trades during news releases
Use trailing stop-loss orders to protect your running positions and lock in profits
💖Supporting our robbery plan 💥Hit the Boost Button💥 will enable us to effortlessly make and steal money 💰💵. Boost the strength of our robbery team. Every day in this market make money with ease by using the Thief Trading Style.🏆💪🤝❤️🎉🚀
I'll see you soon with another heist plan, so stay tuned 🤑🐱👤🤗🤩

LTCUSD INTRADAY sideways consolidation capped at 897.70Market Sentiment:
The prevailing trend for LTCUSD remains bearish, with the recent price action appearing to be an oversold bounce rather than a sustained recovery.
Key Levels:
Resistance: 897.70 (Previous consolidation zone)
Support Levels: 826.80 → 790.20 → 746.40
Potential Scenarios:
Bearish Continuation: If LTCUSD fails to break above 897.70 and faces rejection, it could resume its downtrend, targeting 826.80 initially, followed by 790.20 and 746.40 over the longer term.
Bullish Breakout: A confirmed breakout and daily close above 897.70 would shift the sentiment bullish, paving the way for a rally toward 931.60 and potentially 960.00.
Conclusion:
LTCUSD remains in a bearish structure unless a breakout above 897.70 is confirmed. Until then, price action suggests that any rally is likely to be a short-term relief within a broader downtrend.
This communication is for informational purposes only and should not be viewed as any form of recommendation as to a particular course of action or as investment advice. It is not intended as an offer or solicitation for the purchase or sale of any financial instrument or as an official confirmation of any transaction. Opinions, estimates and assumptions expressed herein are made as of the date of this communication and are subject to change without notice. This communication has been prepared based upon information, including market prices, data and other information, believed to be reliable; however, Trade Nation does not warrant its completeness or accuracy. All market prices and market data contained in or attached to this communication are indicative and subject to change without notice.

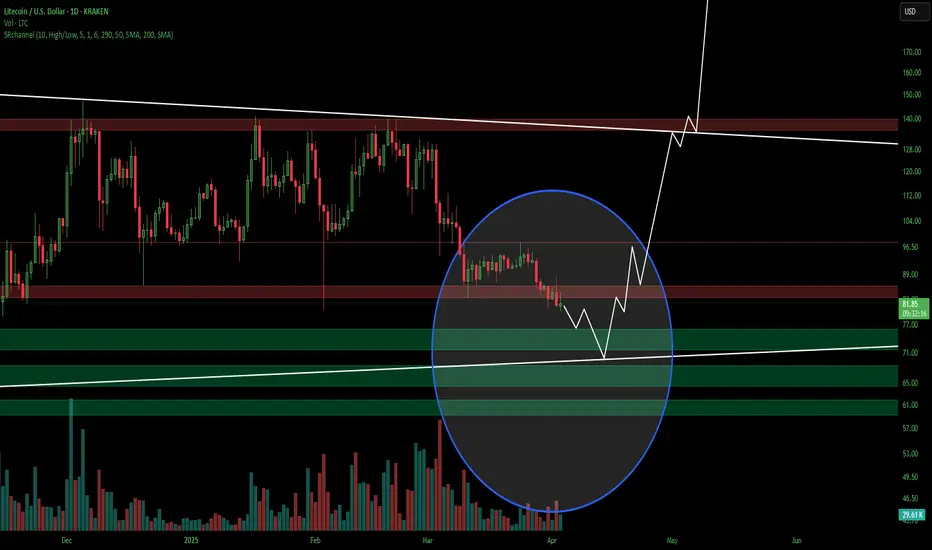
LTC - Bulls Getting Ready!Hello TradingView Family / Fellow Traders. This is Richard, also known as theSignalyst.
📈 Long-term, LTC has been overall bullish, trading within the rising channel marked in red.
📍 As it retests the lower bound of the channel — perfectly intersecting with the blue support—I will be looking for medium-term longs.
🚀 For the bulls to take over long-term and initiate the next bullish phase, a breakout above the last major high marked in orange at $97 is needed.
📚 Always follow your trading plan regarding entry, risk management, and trade management.
Good luck!
All Strategies Are Good; If Managed Properly!
~Rich

3-Phase Litecoin FractalWe are experiencing 2017 again. coins like CRYPTOCAP:LTC just go sideways for infinity while CRYPTOCAP:ETH gets sent to hades. i have no idea what will trigger a pump but it just feels so familiar. the phases of the fractal from LTC in 2017 are almost identical (excluding timing).

LTC price to fall one last time before HUGE upside1. Now that price reached $133, it will reverse
2. Price will fall to towards circled lows of $106, $92, and potentially even lower to sub $86 - this zone is the BUY zone
3. Price will take off to ALL TIME HIGHS

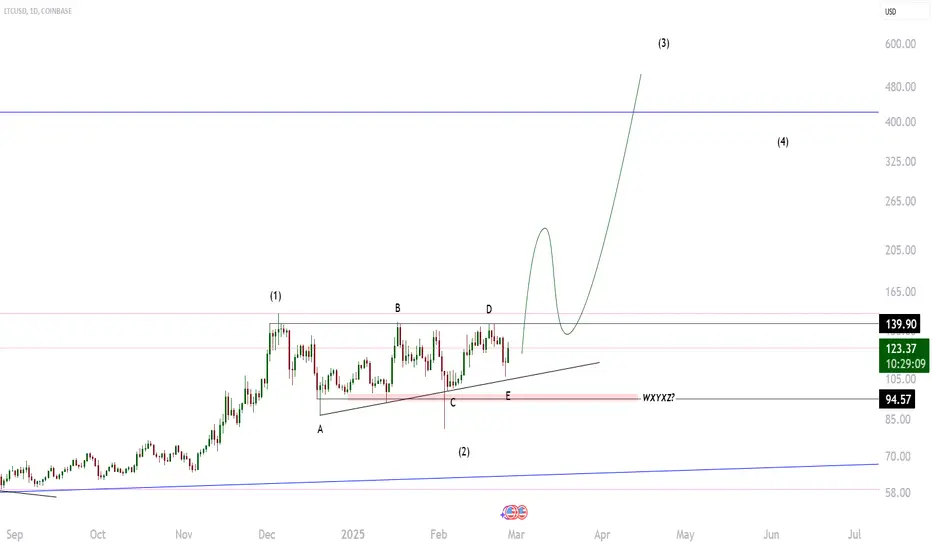
LTC new trendglobal idea graph
completion of the correction in the form of ABCDE and continuation of the trend !
It is possible to expand into a WXYXZ correction when the minimum of the E point is broken - then the impulse wave will be even stronger.
LTCUSD Oversold bounce back capped at 897.70Market Sentiment:
The prevailing trend for LTCUSD remains bearish, with the recent price action appearing to be an oversold bounce rather than a sustained recovery.
Key Levels:
Resistance: 897.70 (Previous consolidation zone)
Support Levels: 826.80 → 790.20 → 746.40
Potential Scenarios:
Bearish Continuation: If LTCUSD fails to break above 897.70 and faces rejection, it could resume its downtrend, targeting 826.80 initially, followed by 790.20 and 746.40 over the longer term.
Bullish Breakout: A confirmed breakout and daily close above 897.70 would shift the sentiment bullish, paving the way for a rally toward 931.60 and potentially 960.00.
Conclusion:
LTCUSD remains in a bearish structure unless a breakout above 897.70 is confirmed. Until then, price action suggests that any rally is likely to be a short-term relief within a broader downtrend.
This communication is for informational purposes only and should not be viewed as any form of recommendation as to a particular course of action or as investment advice. It is not intended as an offer or solicitation for the purchase or sale of any financial instrument or as an official confirmation of any transaction. Opinions, estimates and assumptions expressed herein are made as of the date of this communication and are subject to change without notice. This communication has been prepared based upon information, including market prices, data and other information, believed to be reliable; however, Trade Nation does not warrant its completeness or accuracy. All market prices and market data contained in or attached to this communication are indicative and subject to change without notice.

Litecoin Tests Key Support: Reversal or Further Drop?Litecoin is currently testing a key support zone between $80.0 and $83.0, which previously marked its February low. The overall trend remains bearish, but this support level could trigger a price rebound, potentially shifting momentum in favor of buyers.
If Litecoin holds above $80.0, there is a possibility of a recovery toward $100.0.

LTC Decision Incomming One more drop? or moving in the upward momentum? Bouncing around in this Bear Flag loading for another drop? Would love to get another reload oppurtunity at low 80s. Upsaide potential around 102?
Bullish longterm but BTC looking green this week feeling like another bloody Monday is in store next week

LTCUSD INTRADAY, sideways consolidation capped at 960.00Trend Overview: LTC/USD exhibits a neutral sentiment within a prevailing range-bound trading structure. The recent price action suggests an oversold bounce-back, forming a bearish sideways consolidation. This indicates indecision in the market, with neither bulls nor bears taking full control.
Key Levels:
Resistance: 960.00, 988.50, 1031.40
Support: 883.00, 840.10, 808.80
Price Action Analysis: The key resistance level at 960.00 serves as a crucial pivot point. An oversold rally from current levels could face rejection at this zone, leading to further downside movement. Failure to break this resistance may result in renewed bearish momentum, targeting lower support levels at 883.00, followed by 840.10 and 808.80 in the longer timeframe.
Alternatively, a confirmed breakout and daily close above 960.00 would shift sentiment to bullish, potentially opening the door for an upward move towards 988.50 resistance. Further bullish momentum could drive LTC/USD to 1031.40, reinforcing a stronger uptrend.
Conclusion: LTC/USD remains in a consolidation phase, with the 960.00 level acting as a decisive point for future price direction. A bearish rejection at this level could reinforce a downward trajectory, while a breakout above it would invalidate the bearish bias, signaling potential further gains. Traders should closely monitor price action near 960.00 to assess the next significant move.
This communication is for informational purposes only and should not be viewed as any form of recommendation as to a particular course of action or as investment advice. It is not intended as an offer or solicitation for the purchase or sale of any financial instrument or as an official confirmation of any transaction. Opinions, estimates and assumptions expressed herein are made as of the date of this communication and are subject to change without notice. This communication has been prepared based upon information, including market prices, data and other information, believed to be reliable; however, Trade Nation does not warrant its completeness or accuracy. All market prices and market data contained in or attached to this communication are indicative and subject to change without notice.

LTCUSDTWe expected demand when the price reached the $85 range, but given the current market conditions, there was no good demand. Now, if the $85 range is lost and stabilized below it, we expect a further decline to the $74 range, and otherwise, we expect the price to grow to higher numbers and unimaginable targets for Litecoin.
Litecoin LTF Signals Potential Bullish Catapult in PlayWith SEC decision day for the Litecoin ETF delayed until May 5, 2025 , seems those idle hands are idle no more with Litecoin.
From a fundamentals perspective, the hash rate for Litecoin is in overdrive since November, racing to the 2.37 PH/s handle, and continues to dominate as the most used cryptocurrency for transactions on Bitpay (34.7%), surpassing Bitcoin, Ethereum, and USD stables.
From a very basic fundamentals perspective, it seems Litecoin should be primed for a move higher in the near term.
Potential Bullish Catapult & Target Price
In Point & Figure Charting “a typical Bullish Catapult forms with a Triple Top Breakout, a pullback, and then a Double Top Breakout.”
The formation is showing a clear triple top followed by a Sign of Strength (SOS) on the breakout to the $97 handle. It appears to be a textbook Bullish Catapult formation. The Horizontal Price Count suggests that if this formation plays out, the target price for this move would be the $120 handle.
Always remember this is not trading advice.
Outside of that, Happy Trading.

LTCUSDCrypto ,solana took off , eth as well bitcoin is doing the same ,now here its the same thing waiting for that break and from there it will fly!!!!


LITECOIN Stock Chart Fibonacci Analysis 032025Trading Idea
1) Find a FIBO slingshot
2) Check FIBO 61.80% level
3) Entry Point > 91/61.80%
Chart time frame: B
A) 15 min(1W-3M)
B) 1 hr(3M-6M)
C) 4 hr(6M-1year)
D) 1 day(1-3years)
Stock progress: A
A) Keep rising over 61.80% resistance
B) 61.80% resistance
C) 61.80% support
D) Hit the bottom
E) Hit the top
Stocks rise as they rise from support and fall from resistance. Our goal is to find a low support point and enter. It can be referred to as buying at the pullback point. The pullback point can be found with a Fibonacci extension of 61.80%. This is a step to find entry level. 1) Find a triangle (Fibonacci Speed Fan Line) that connects the high (resistance) and low (support) points of the stock in progress, where it is continuously expressed as a Slingshot, 2) and create a Fibonacci extension level for the first rising wave from the start point of slingshot pattern.
When the current price goes over 61.80% level , that can be a good entry point, especially if the SMA 100 and 200 curves are gathered together at 61.80%, it is a very good entry point.
As a great help, tradingview provides these Fibonacci speed fan lines and extension levels with ease. So if you use the Fibonacci fan line, the extension level, and the SMA 100/200 curve well, you can find an entry point for the stock market. At least you have to enter at this low point to avoid trading failure, and if you are skilled at entering this low point, with fibonacci6180 technique, your reading skill to chart will be greatly improved.
If you want to do day trading, please set the time frame to 5 minutes or 15 minutes, and you will see many of the low point of rising stocks.
If want to prefer long term range trading, you can set the time frame to 1 hr or 1 day.

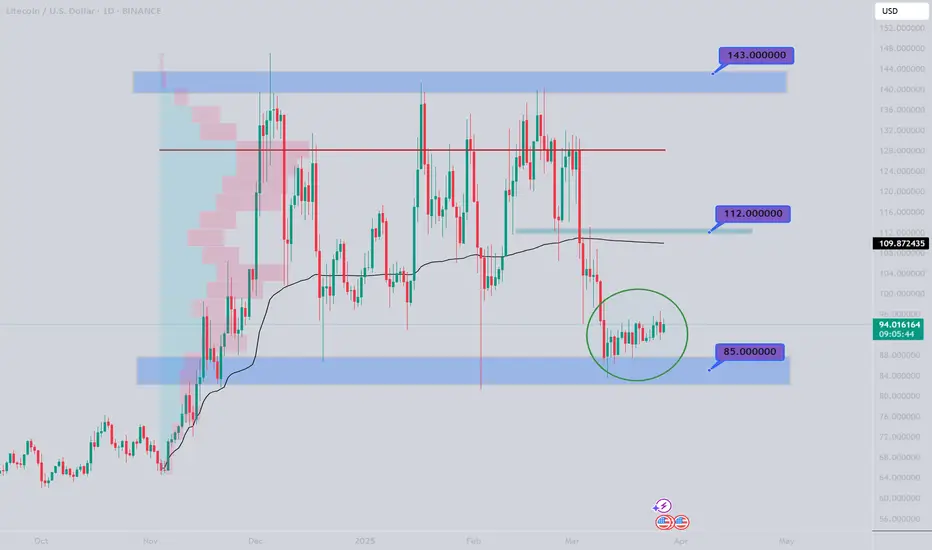
A Litecoin Swing TradeMarkets have been understandably battered over the last weeks. Current conditions are why I've generally been cautious about trading, and not getting married to long positions. As I explained in my last Litecoin analysis, things are precarious. The good thing is, I got out of my trades with a little bit of profit and no losses. The bad thing is, entering long right now is a bit scary. We cannot predict economic conditions. Instead, we can use sentiment. Sentiment for altcoins is totally in the gutter right now. Based on this alone, a bounce makes sense.
On the weekly chart, Litecoin is (so far) holding the 50 and 100 moving averages, while it broke below the 200. To look bullish on bigger timeframes, price needs to at least stabilize here and begin slowly moving up to allow the MA structure to bullishly support price (a weekly golden cross would be a start).
This play is simple - buying at support here between $86-94 and selling at resistance, near $106-107 (conservatively). If price makes it back up there, I will observe conditions to determine whether an additional leg up seems likely. If price is rejected heavily up there, it could point to another leg down. I'm also watching whether Bitcoin can break back above its 50 and 100 day moving averages. Litecoin is unlikely to have any explosive ATH moves if Bitcoin cannot at least get back above $90K and stay there for a while, I think.
On the downside, taking out the $80 level would set up price to fall back towards $50-66, and it may take a long while to recover. I may stop myself out if that happens and aim to rebuy near $66.
Litecoin has experienced steady (though not explosive) growth. This seems somewhat attractive to me when it comes to crypto. While I wouldn't be surprised to see this entire market fade in the future and be forgotten as an investment, this one at least sees some steady user growth.
This post is to show that even though I remain largely bearish on crypto, I am open to trading opportunities that present themselves, even if they are narrow in scope and focus on one cryptocurrency.
This is not meant as financial advice, but for speculation and entertainment only!
Thanks for reading :)
-Victor Cobra

LTC PATTERNSI've always had high expectations for $LTC. One day it will surprise you, I've said that for years. I consider myself good at pivots but its been difficult to pin down in terms of time. For me, its not a matter of IF but when. One of the few that I invest in and seldom trade.

Litecoin LTCUSD at pivotal level Litecoin (LTCUSD) remains in a neutral stance, as price action continues to trade within a longer-term sideways range. The key trading level at 940.00 will play a crucial role in determining the next directional move.
Key Levels to Watch
Resistance Levels: 1,120, 1,217, 1,320, 1,374
Support Levels: 859.00, 816.00
Bearish Scenario
If LTCUSD fails to bounce back from 940.00 and faces rejection, a downside move could emerge. A sustained decline below this level may trigger selling pressure, targeting 859, followed by a potential retest of the 816.00 psychological support over the longer timeframe.
Bullish Scenario
A decisive bounce back from the 940.00 support level, confirmed by a daily close higher, would shift sentiment toward a bullish outlook. This could open the way for further gains, with upside targets at 1,120, followed by 1,217 and1,274 in an extended rally.
Conclusion
LTCUSD is currently consolidating within a neutral range, with 940.00 acting as a key pivot level. A rejection from this zone could reinforce bearish pressure, while a breakout above 1,120 could confirm bullish momentum. Traders should monitor these levels for confirmation of the next move.
This communication is for informational purposes only and should not be viewed as any form of recommendation as to a particular course of action or as investment advice. It is not intended as an offer or solicitation for the purchase or sale of any financial instrument or as an official confirmation of any transaction. Opinions, estimates and assumptions expressed herein are made as of the date of this communication and are subject to change without notice. This communication has been prepared based upon information, including market prices, data and other information, believed to be reliable; however, Trade Nation does not warrant its completeness or accuracy. All market prices and market data contained in or attached to this communication are indicative and subject to change without notice.
