LTC/USD "Litecoin vs US Dollar" Crypto Market Heist Plan🌟Hi! Hola! Ola! Bonjour! Hallo!🌟
Dear Money Makers & Robbers, 🤑💰🐱👤🐱🏍
Based on 🔥Thief Trading style technical and fundamental analysis🔥, here is our master plan to heist the LTC/USD "Litecoin vs US Dollar" Crypto market. Please adhere to the strategy I've outlined in the chart, which emphasizes long entry. Our aim is the high-risk Red Zone. Risky level, overbought market, consolidation, trend reversal, trap at the level where traders and bearish robbers are stronger. 🏆💸Book Profits Be wealthy and safe trade.💪🏆🎉
Entry 📈 : "The vault is wide open! Swipe the Bullish loot at any price - the heist is on!
however I advise placing Buy limit orders within a 15 or 30 minute timeframe. Entry from the most recent or closest low or high level should be in retest.
Stop Loss 🛑: Thief SL placed at 110.00 (swing Trade Basis) Using the 4H period, the recent / nearest low level.
SL is based on your risk of the trade, lot size and how many multiple orders you have to take.
Target 🎯: 165.00 (or) Escape Before the Target
Scalpers, take note 👀 : only scalp on the Long side. If you have a lot of money, you can go straight away; if not, you can join swing traders and carry out the robbery plan. Use trailing SL to safeguard your money 💰.
📰🗞️Fundamental, Macro, COT, Sentimental Outlook:
LTC/USD "Litecoin vs US Dollar" Crypto Market market is currently experiencing a bullish trend,., driven by several key factors.
🔱Fundamental Analysis
Litecoin Adoption: Growing adoption of Litecoin as a payment method, with increasing transaction volumes.
Halving Event: The upcoming halving event in August 2025 is expected to reduce Litecoin's block reward, potentially increasing demand and prices.
Competition from Other Cryptocurrencies: Increasing competition from other cryptocurrencies, such as Bitcoin and Ethereum, may impact Litecoin's market share.
🔱Macro Economics
Global Economic Trends: The ongoing global economic recovery is expected to drive up demand for cryptocurrencies, including Litecoin.
Inflation Rate: Global inflation is expected to rise to 3.8% in 2025, potentially increasing demand for cryptocurrencies as a hedge against inflation.
Interest Rates: Central banks are expected to maintain low interest rates in 2025, supporting cryptocurrency markets.
🔱COT Data
Net Long Positions: Institutional traders have increased their net long positions in Litecoin to 60%.
COT Ratio: The COT ratio has risen to 2.5, indicating a bullish trend.
Open Interest: Open interest in Litecoin futures has increased by 20% over the past month, indicating growing investor interest.
🔱Sentimental Outlook
Institutional Sentiment: 65% bullish, 35% bearish.
Retail Sentiment: 60% bullish, 40% bearish.
Market Mood: The overall market mood is bullish, with a sentiment score of +40.
🔱Technical Analysis
Moving Averages: 50-period SMA: 120.00, 200-period SMA: 110.00.
Relative Strength Index (RSI): 4-hour chart: 62.21, daily chart: 58.14.
Bollinger Bands: 4-hour chart: 130.00 (upper band), 120.00 (lower band).
🔱Next Move Prediction
Bullish Move: Potential upside to 150.00-170.00.
Key Support Levels: 120.00, 110.00.
Key Resistance Levels: 150.00, 170.00.
🔱Market Overview
Current Price: 130.00
Daily Change: 2.5%
Weekly Change: 10.2%
Overall Outlook
🔱The overall outlook for LTC/USD is bullish, driven by a combination of fundamental, technical, and sentimental factors. The expected increase in Litecoin adoption, upcoming halving event, and bullish market sentiment are all supporting the bullish trend. However, investors should remain cautious of potential downside risks, including changes in global economic trends and unexpected regulatory developments.
⚠️Trading Alert : News Releases and Position Management 📰 🗞️ 🚫🚏
As a reminder, news releases can have a significant impact on market prices and volatility. To minimize potential losses and protect your running positions,
we recommend the following:
Avoid taking new trades during news releases
Use trailing stop-loss orders to protect your running positions and lock in profits
📌Please note that this is a general analysis and not personalized investment advice. It's essential to consider your own risk tolerance and market analysis before making any investment decisions.
📌Keep in mind that these factors can change rapidly, and it's essential to stay up-to-date with market developments and adjust your analysis accordingly.
💖Supporting our robbery plan will enable us to effortlessly make and steal money 💰💵 Tell your friends, Colleagues and family to follow, like, and share. Boost the strength of our robbery team. Every day in this market make money with ease by using the Thief Trading Style.🏆💪🤝❤️🎉🚀
I'll see you soon with another heist plan, so stay tuned 🤑🐱👤🤗🤩
LTCBULLUSD trade ideas

Final Minutes of Overtime - LTC - POW + Ready for One?**Final Minutes of Overtime - LTC - POW: Is the Market Ready for One Last Move?**
As the market continues to move through uncertain and volatile conditions, many investors and analysts are beginning to wonder: Are we approaching the final minutes of overtime? In the world of cryptocurrency, the game feels like it’s in its final stretch, with significant movements happening across assets like Litecoin (LTC) and Proof of Work (PoW) consensus mechanisms. The question on everyone's minds: Is the market gearing up for one final, significant move?
### The Current State of the Market
We’re witnessing a market that has undergone substantial fluctuations over the past months, with assets like Litecoin (LTC) showing resilience despite periodic downturns. LTC, in particular, has been on the radar of many long-term investors due to its potential for significant growth, bolstered by an increasing demand for privacy and decentralized transactions. With its unique position in the crypto ecosystem, LTC’s price has been heavily influenced by both macroeconomic trends and the movement of Bitcoin, often seen as a bellwether for the broader market.
On the other hand, Proof of Work (PoW) systems, while facing increasing scrutiny due to energy consumption concerns, still remain at the heart of the crypto world. The debate between Proof of Stake (PoS) and PoW has been a hot topic, but despite this, PoW remains a tried-and-true consensus mechanism, with Bitcoin, Litecoin, and Ethereum (prior to its transition to PoS) all operating on this model. As institutional interest grows, the market is at a crossroads, with many wondering if PoW systems will continue to dominate, or if PoS alternatives will ultimately take over.
### Overtime in the Market: A Final Push?
The analogy of "overtime" is fitting here, as the cryptocurrency market often feels like a game of high stakes, constantly on the edge of dramatic swings. Historically, the final minutes of an overtime game in sports tend to be the most intense, as teams push for one final victory. Could the market be poised for a similar finale?
Many are looking at the current market indicators — from on-chain analysis to price movements — and asking if there is one last rally in store. While we’ve seen some signs of stabilization in recent weeks, there’s an underlying sense of uncertainty. Will Litecoin make another push upwards, leveraging its unique use cases? Will institutional investors begin to take greater positions in PoW-based coins as regulations become clearer? These are the questions that are driving market sentiment.
### The Role of Institutional Investors
Institutions are becoming an increasingly important part of the crypto landscape, and their involvement could be a decisive factor in this final move. As more established financial institutions dive into the cryptocurrency space, they may help provide the liquidity and stability needed for another price surge. However, institutional involvement also brings the possibility of increased regulation, which could dampen the explosive potential the market has seen in the past.
In particular, Litecoin has seen growing attention from institutions due to its low transaction fees and relatively faster transaction times compared to Bitcoin. As more legacy financial systems explore ways to integrate blockchain technology, could Litecoin’s relatively light energy footprint and established infrastructure make it an attractive option for institutional adoption?
### Technological Developments: Will They Catalyze the Last Move?
As the market moves toward its final minutes of overtime, several technological developments could help to catalyze that final, dramatic move. Key among them are scalability solutions, interoperability enhancements, and increased privacy features. For instance, the potential launch of Layer 2 scaling solutions for Litecoin could boost its usability, allowing the coin to be used for daily transactions more efficiently.
In addition, Proof of Work systems are still at the core of many projects, with developers continuously working on ways to make them more energy-efficient and less controversial. If these advancements gain traction, they may alleviate concerns surrounding the environmental impact of PoW, potentially boosting investor confidence and causing a rally.
### The Final Push: What to Expect?
As we move into the final moments of overtime in the cryptocurrency market, the future remains uncertain. While some analysts predict a final surge, others believe the market may be due for a cooling period. What we do know is that Litecoin (LTC), along with Proof of Work systems, will continue to play an important role in shaping the market’s direction.
The question isn’t necessarily whether the market is ready for one last move — it’s how that move will unfold. Will the market rally as we’ve seen in previous cycles, or will it cool off and take a step back for further consolidation?
### Conclusion
The final minutes of overtime in the cryptocurrency market present a fascinating and nerve-wracking scenario for investors, with assets like Litecoin and PoW mechanisms positioned for what could be one last push. As the market navigates these uncertain waters, only time will tell whether we’ll see a dramatic finish or a slower, more controlled progression toward stability. Whatever the outcome, it’s clear that the next move will have significant implications for the future of cryptocurrency.
For now, all eyes are on the market, waiting for the final whistle to blow.

$LTC Just Ride The WaveEveryone on Twitter is hyping Litecoin because of the possible ETF approval. Well, if history rhymes this coin is about to breakout just like the setup on Monero. Buy the dip now.

Litecoin Set to Break Below Support Point- $60 in Sight?Litecoin ( CRYPTOCAP:LTC ) a cryptocurrency that was designed to provide fast, secure and low-cost payments by leveraging the unique properties of blockchain technology is set to go bearish amidst dipping down to the support point should the market continue its bearish pattern, CRYPTOCAP:LTC is set to tanked finding support in the $60- 65 support.
With buying pressure decreasing and Relative Strength Index (RSI) at 31.92, CRYPTOCAP:LTC could be on the cusp of a selling spree.
Similarly, a breakout above the $140 resistance zone could liberate CRYPTOCAP:LTC from the bears thereby aiming new resistant points.
However, data from DefiLama shows about $2.23 million has been locked in Total Value lock (TVL) on the Litecoin ecosystem hinting on a development on the Litecoin chain in the long term. This value shows a level of trust placed on the Litecoin Blockchain.
About Litecoin
Litecoin was released via an open-source client on GitHub on Oct. 7, 2011, and the Litecoin Network went live five days later on Oct. 13, 2011. Since then, it has exploded in both usage and acceptance among merchants and has counted among the top ten cryptocurrencies by market capitalization for most of its existence.
The cryptocurrency was created by Charlie Lee, a former Google employee, who intended Litecoin to be a "lite version of Bitcoin," in that it features many of the same properties as Bitcoin—albeit lighter in weight.
Litecoin Price Live Data
The live Litecoin price today is $87.46 USD with a 24-hour trading volume of $508,275,483 USD. Litecoin is down 3.21% in the last 24 hours, with a live market cap of $6,608,334,524 USD. It has a circulating supply of 75,558,468 LTC coins and a max. supply of 84,000,000 LTC coins.

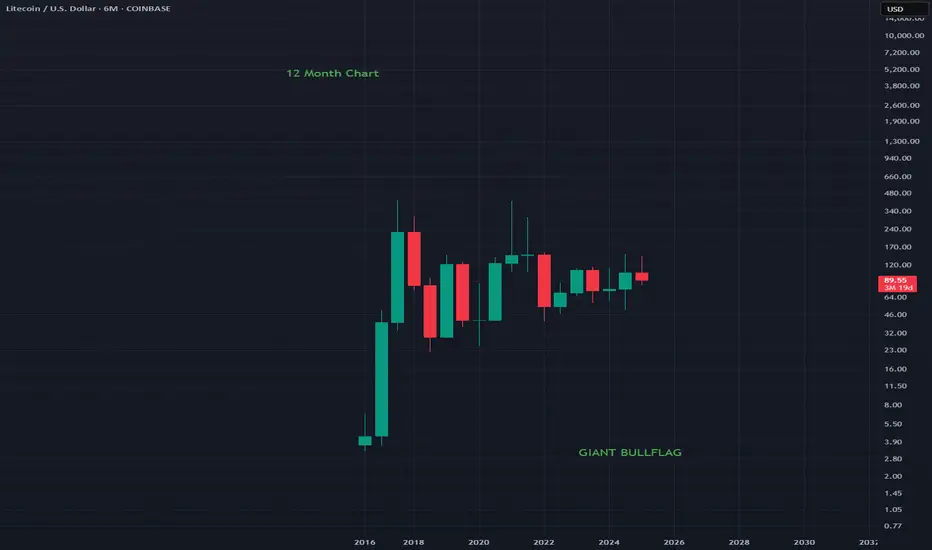
LTCUSD - 12 Month Chart Litecoin has produced a beautiful Bullflag on the 12 Month chart
Its honestly crazy how great this looks on a yearly timeframe
If you want to go very very long this is a great option
MASSIVE BULLFLAG
LTCUSD BUY AND SELL ZONES FOR SHORT TERM GAIN.Charting the buy and sell areas for a short term upside move in Litecoin.

LTCUSD below previous support, now resistance at 940.00Litecoin (LTCUSD) remains in a neutral stance, as price action continues to trade within a longer-term sideways range. The key trading level at 940.00 will play a crucial role in determining the next directional move.
Key Levels to Watch
Resistance Levels: 1,120, 1,217, 1,320, 1,374
Support Levels: 859.00, 816.00
Bearish Scenario
If LTCUSD fails to bounce back from 940.00 and faces rejection, a downside move could emerge. A sustained decline below this level may trigger selling pressure, targeting 859, followed by a potential retest of the 816.00 psychological support over the longer timeframe.
Bullish Scenario
A decisive bounce back from the 940.00 support level, confirmed by a daily close higher, would shift sentiment toward a bullish outlook. This could open the way for further gains, with upside targets at 1,120, followed by 1,217 and1,274 in an extended rally.
Conclusion
LTCUSD is currently consolidating within a neutral range, with 940.00 acting as a key pivot level. A rejection from this zone could reinforce bearish pressure, while a breakout above 1,120 could confirm bullish momentum. Traders should monitor these levels for confirmation of the next move.
This communication is for informational purposes only and should not be viewed as any form of recommendation as to a particular course of action or as investment advice. It is not intended as an offer or solicitation for the purchase or sale of any financial instrument or as an official confirmation of any transaction. Opinions, estimates and assumptions expressed herein are made as of the date of this communication and are subject to change without notice. This communication has been prepared based upon information, including market prices, data and other information, believed to be reliable; however, Trade Nation does not warrant its completeness or accuracy. All market prices and market data contained in or attached to this communication are indicative and subject to change without notice.


LTCUSD The Week Ahead 10th March '25Litecoin (LTCUSD) remains in a neutral stance, as price action continues to trade within a longer-term sideways range. The key trading level at 960.00 will play a crucial role in determining the next directional move.
Key Levels to Watch
Resistance Levels: 1,120, 1,217, 1,320, 1,374
Support Levels: 859.00, 816.00
Bearish Scenario
If LTCUSD fails to bounce back from 960.00 and faces rejection, a downside move could emerge. A sustained decline below this level may trigger selling pressure, targeting 859, followed by a potential retest of the 816.00 psychological support over the longer timeframe.
Bullish Scenario
A decisive bounce back from the 960.00 support level, confirmed by a daily close higher, would shift sentiment toward a bullish outlook. This could open the way for further gains, with upside targets at 1,120, followed by 1,217 and1,274 in an extended rally.
Conclusion
LTCUSD is currently consolidating within a neutral range, with 960.00 acting as a key pivot level. A rejection from this zone could reinforce bearish pressure, while a breakout above 1,120 could confirm bullish momentum. Traders should monitor these levels for confirmation of the next move.
This communication is for informational purposes only and should not be viewed as any form of recommendation as to a particular course of action or as investment advice. It is not intended as an offer or solicitation for the purchase or sale of any financial instrument or as an official confirmation of any transaction. Opinions, estimates and assumptions expressed herein are made as of the date of this communication and are subject to change without notice. This communication has been prepared based upon information, including market prices, data and other information, believed to be reliable; however, Trade Nation does not warrant its completeness or accuracy. All market prices and market data contained in or attached to this communication are indicative and subject to change without notice.

Short Term Could Drop Be Careful Here - Possible $100Some bad news came out. Bybit got hacked for a lot of Ethereum. How this happens I dont understand but more than likely an inside job. These run out a basement exchanges are dangerous never leave your crypto on an exchange, NONE OF THEM.
Anyways I dont like the break of this rising wedge or potential bear flag. If this deosnt break back into the wedge and close in it then we could se another drop to about 100 or so if the measured move plays out. Be cautious here.
Not Financial advice.

Litecoin Golden CrossThe blue vertical lines are Litecoin halving dates that occur every 4 years. After each halving, the price remains flat for around 470 to 570 days, then rapidly increases. According to these predictions, a golden cross will occur next month. Fib 0.382 is the first price to occur ($187). Fib 0.786 is my estimated sell price of $334. Do you think it will be the same as in the past? Good luck to everyone

LtcusdOg crypto lacking in the new narrative driven space yet the price hasn't dropped
Structurally its a long term multi year pennant looking thing with deviations to the upside
The narrative is and always has been digital silver..
If hyperinflation of the usd continues unchecked like it appears to be
This should get valued up once long enough term accumulation has taken place like with all market assets
Deflationary asset with halving cycles similar to btc and it never really got sold off into a downtrend, it just didn't keep up with btc but nothing did so..
Technical target would be all time highs even the 1.618 of the fib range if we see expansion albeit the narrative in finance right now is all about memecoins and ai but that doesn't change the fundamentals of real crypto assets..
And narratives come and go and end up looking like crazy volatile pump and dumps when alls said and done and its probably worth simply avoiding those..

LTC/USD to the moon (ish) LTC/USD Bullish Outlook: Monthly & Daily Analysis
Monthly Chart (Higher Timeframe Perspective)
The monthly timeframe provides the macro perspective for Litecoin’s price action. The key observations here include:
1. Liquidity Raid & Rejection from Demand Zone
Price had dipped into a historical liquidity zone where buyers have previously stepped in.
The long lower wicks in previous candles suggest strong buying pressure, rejecting lower prices.
This area aligns with an accumulation zone where institutional traders might be building long positions.
2. Premium & Discount Pricing Model
Price is currently positioned in a discount zone relative to historical price ranges.
Based on Smart Money Concepts (SMC), assets tend to revert to fair value (equilibrium), making a bullish retracement likely.
3. Inefficiencies & Fair Value Gaps (FVGs)
There is an FVG above current price action, which typically acts as a magnet for price seeking to rebalance inefficiencies.
The market structure remains intact, with price showing signs of accumulation.
4. Key Monthly Resistance Zones
The red highlighted zone around $175 - $193 represents a previous order block (OB), which overlaps with a -3 Standard Deviation Level.
If price sustains bullish momentum, this area could be a significant target.
Daily Chart (Refining Entry & Targets)
Moving down to the daily timeframe, we refine our bias and pinpoint trade execution levels.
1. Recent Liquidity Sweep & Bullish Reaction
A recent liquidity raid took out previous lows, grabbing stop losses from long positions.
Price has reacted from a key support region (around $80-$90), indicating potential demand.
2. Wick Close Equilibrium (Wick C.E.) & Demand Zone
The Wick C.E. level suggests a technical mean reversion point where price often finds equilibrium.
A strong move away from this level suggests bullish momentum is building.
3. Order Blocks & Imbalance Fill Zones
The red zone above price (~$125-$140) represents a bearish order block (OB) that may act as a resistance area.
If price breaks above this OB, it will likely continue to the next liquidity level at $175-$193.
Trade Plan
Entry Zone:
Around $95-$105, as this aligns with liquidity grabs and institutional interest.
Take Profit (TP) Levels:
TP1: $125 (First supply zone & OB)
TP2: $175 (Major resistance & OB)
TP3: $193 (Full FVG fill & -3STD level)
Stop Loss (SL):
Below $80, invalidating the bullish setup.
Summary of the Bullish Case
Price has raided liquidity, tapped into a strong demand zone, and is showing bullish rejection.
There is an imbalance above, which price is likely to seek.
The trade plan suggests a high-probability long position with a well-defined risk-to-reward ratio.
Confirmation required : A daily close above $110-$115 for momentum validation.
Good luck, good trading.

LTCUSD Support retest Litecoin (LTCUSD) remains in a neutral stance, as price action continues to trade within a longer-term sideways range. The key trading level at 960.00 will play a crucial role in determining the next directional move.
Key Levels to Watch
Resistance Levels: 1,120, 1,217, 1,320, 1,374
Support Levels: 859.00, 816.00
Bearish Scenario
If LTCUSD fails to bounce back from 960.00 and faces rejection, a downside move could emerge. A sustained decline below this level may trigger selling pressure, targeting 859, followed by a potential retest of the 816.00 psychological support over the longer timeframe.
Bullish Scenario
A decisive bounce back from the 960.00 support level, confirmed by a daily close higher, would shift sentiment toward a bullish outlook. This could open the way for further gains, with upside targets at 1,120, followed by 1,217 and1,274 in an extended rally.
Conclusion
LTCUSD is currently consolidating within a neutral range, with 960.00 acting as a key pivot level. A rejection from this zone could reinforce bearish pressure, while a breakout above 1,120 could confirm bullish momentum. Traders should monitor these levels for confirmation of the next move.
This communication is for informational purposes only and should not be viewed as any form of recommendation as to a particular course of action or as investment advice. It is not intended as an offer or solicitation for the purchase or sale of any financial instrument or as an official confirmation of any transaction. Opinions, estimates and assumptions expressed herein are made as of the date of this communication and are subject to change without notice. This communication has been prepared based upon information, including market prices, data and other information, believed to be reliable; however, Trade Nation does not warrant its completeness or accuracy. All market prices and market data contained in or attached to this communication are indicative and subject to change without notice.

Litecoin Health, Trends and Levels This is a chart I made using DWEB indicator. This indicator shows important time, price, balance points and uses these nodes to draw trends. I simply extended the trend and marked important levels from the main DWEB intersections for levels. You will see that the levels bunch up in certain areas, showing major S/R levels. The compton indicator below is helpful to show momentum and balance

LTC Litecoin Could Do One More Round Of Bouncing Within WedgeThis is a possible scenario here. This is in line format not candles so wicks could be lower than than this. Lines remove all the wicks and are just on an open and close basis, kind of cleaning up the noise. This is not guaranteed to happen but it is a possible scenario before we break out again around the end of March. I'll post below a candle chart as well so you can see those levels. As long as we stay within this wedge on a closing basis and within the channel on the candle format then we should be fine. If we break down below the wedge or channel and close below it then thats not going to be very good. I don't see this happening thats just worst case scenario.
Follow me for more updates. Not financial advice. Thank you

LTCUSD Key Levels The Week Ahead 03rd March ‘25Litecoin (LTCUSD) remains in a neutral stance, as price action continues to trade within a longer-term sideways range. The key trading level at 1,140 will play a crucial role in determining the next directional move.
Key Levels to Watch
Resistance Levels: 1,140, 1,395, 1,523, 1,709
Support Levels: 1,082, 1,000
Bearish Scenario
If LTCUSD fails to break above 1,140 and faces rejection, a downside move could emerge. A sustained decline below this level may trigger selling pressure, targeting 1,082, followed by a potential retest of the 1,000 psychological support over the longer timeframe.
Bullish Scenario
A decisive breakout above the 1,395 resistance level, confirmed by a daily close, would shift sentiment toward a bullish outlook. This could open the way for further gains, with upside targets at 1,523, followed by 1,709 in an extended rally.
Conclusion
LTCUSD is currently consolidating within a neutral range, with 1,140 acting as a key pivot level. A rejection from this zone could reinforce bearish pressure, while a breakout above 1,395 could confirm bullish momentum. Traders should monitor these levels for confirmation of the next move.
This communication is for informational purposes only and should not be viewed as any form of recommendation as to a particular course of action or as investment advice. It is not intended as an offer or solicitation for the purchase or sale of any financial instrument or as an official confirmation of any transaction. Opinions, estimates and assumptions expressed herein are made as of the date of this communication and are subject to change without notice. This communication has been prepared based upon information, including market prices, data and other information, believed to be reliable; however, Trade Nation does not warrant its completeness or accuracy. All market prices and market data contained in or attached to this communication are indicative and subject to change without notice.

LTCUSD SELL ANALYSIS SMART MONEY CONCEPT Here on Ltcusd price form a supply around area of which is likely to continue moving down and as more sellers will likely to come and push the price down so trader should go for short with expect profit target of 99.314061 and 64.003124 . Use money management

Litecoin - More Bullish ConfirmationWhen we look at the monthly candle for Litecoin for Feb 2025, we have a bullish candlestick pattern, called the Dragonfly Doji. This candlestick pattern suggests that there are a lot more buyers that are able to withstand selling pressure.
Additionally, to put the cherry on top, it just so happens that the wick of the Dragonfly Doji retraced to a gap of the Nov 2024 candlestick.
I still think that the price of Litecoin will reach $900, also because it's likely that an ETF will be launched for Litecoin which helps fuel price to the upside.
I posted a bullish Elliott Wave count for Litecoin and this months price action is something that strengthens my bias. Here is my EW count for Litecoin that I posted earlier:
Let me know what you think.
Good luck!

$LTC strength amidst uncertainty LTC has shown strength despite the flush down in BTC. With BTC poised to reclaim $90K, a momentum push through key resistance would propel LTC quickly. High risk given the uncertainty in the market, however, I believe this to be an opportune time. Stop out below 105, targets 1 & 2 are posted. Just an idea.
LTCUSDT - MonthlyThe LTCUSDT currency is one of the currencies with high demand and we have always witnessed frequent increases in this currency. It has had two upward swings up to the $140 range, and the third swing will occur in two cases: the first case is a decrease and increase to the target range, and the second case is an increase from the current price directly towards the target.
Sasha Charkhchian

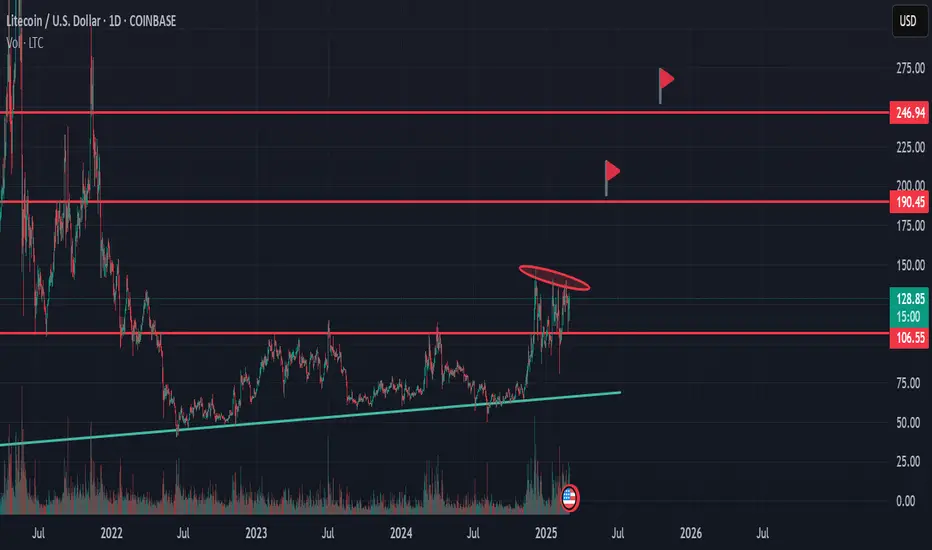
LTC’s Next Move: Bullish Breakout or Bearish Dip?LTC is currently at a decisive point, showing signs of bullish momentum — but the next move will depend on how the price reacts to key levels in the coming days.
After breaking through the POC (Point of Control) — one of the strongest resistance levels based on the Volume Profile — the price is now at a critical point where both bullish continuation or a deeper retracement are possible.
📌 What’s Happening Right Now?
The POC around $128-$129 was acting as a strong resistance level during the previous consolidations. Now that we have broken above this area, it could flip into support if we see a clean retest.
Additionally, there is a dashed trendline supporting the structure by forming higher lows, showing that bulls are still in control.
However, if the market fails to hold the POC, a deeper retracement towards the FVG (Fair Value Gap) zone around $115-$120 could play out. This zone is a strong demand area and could offer the next buying opportunity.
🟢 Bullish Scenario:
If the price manages to retest the POC successfully or finds support again at the dashed trendline, we could see a continuation to the upside.
The first key confirmation would be a break above the resistance level at $134-$136 — an area where the market has been rejected several times.
Once this level is cleared, the next bullish targets could lie around $146-$150, potentially forming a new bullish structure with higher highs.
🔴 Bearish Scenario:
If the price doesn't hold the POC and breaks below the trendline, we could see a move back towards the blue FVG imbalance zone between $115-$120. This would likely act as a strong support area where buyers could step in again.
A clean break below this zone would invalidate the bullish structure and open the door for deeper downside.
🔍 What to Watch for Confirmation:
✅ Retest of the POC with bullish reaction
✅ Higher lows along the trendline
✅ Break above the $134-$136 resistance zone
❌ Break below POC and trendline = bearish scenario
What Do You Think? 🤔
Will LTC hold the POC and make the next bullish leg — or are we heading back to the imbalance zone for one last liquidity sweep?
Drop your opinion in the comments 💬👇 and make sure to follow for more detailed setups every day! 🚨

