Scale in buy project Viewing price action in it's raw form based on liquidity and structure interpretation, here's a scale in buy trade projection for lite coin
LTCBULLUSDT trade ideas

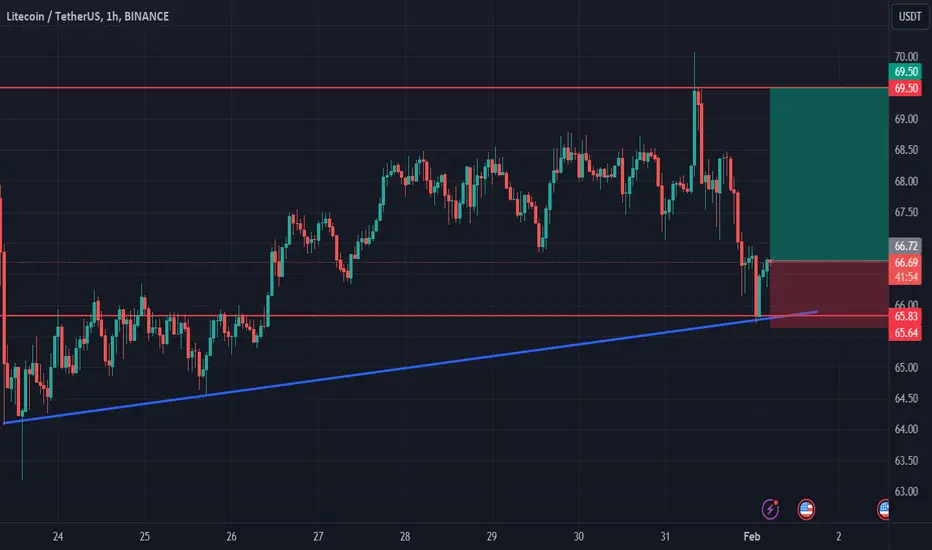
Litecoin longLitecoin bounced off the ascending trendline and bounced off the support level. Bullish movement to resistance level at 69.50 is expected to happen.

LTC: Both scenarios are possibleLTC: Both scenarios are possible
LTC is moving within an Ascending Channel.
So far the price is still bullish and it may continue to rise further as shown on the chart
I am focused more on the bearish move.
If the price moves below the channel I would like to sell LTC.
If the bearish breakout happens it may test $64 again.
If you like the bullish scenario and you are bullish on LTC, simply follow the targets:)
You may find more details on the chart.
Thank you and Good Luck!
❤️PS: Please support with a like or comment if you find this analysis useful for your trading day❤️

LitecoinGood luck to everyone! This analysis is for educational purposes only and does not constitute financial advice. Conduct your own analysis before making trading decisions.

Litecoin(LTC): Potential Breakout Can Happen!!! Time To Buy?LTC coin is showing some strength here with a good potential for upward movement here on a daily timeframe.
We are looking here for a potential breakout with a confident re-test as always, but we are ready for all kinds of movement here, meaning if we fail to breakout, then we might touch that lower line!
Swallow Team

Predictions for Route of LTC.Hello everyone.
All the numbers on the chart : the Entry , Take profit areas and Stop loss are specified.
It seems that the price indicated by the star symbol will be touched before the price indicated by the no entry sign.

LTC Update - 25.01.2024 / Short setup4 hour chart:
I see the coin moving in a full downward oof through withdrawal of internal liquidity, structure breakdowns, FF imbalances and mithigating bts zones.
At this point I'm considering two POIs for a set of shorts positions:
1. Daily FVG that broke local structure to short (Only through confirmation on ltf in the form of nascent off / structure breakdown)
2. Block order zone + ind (Also only through ltf confirmation)
Market maker left enough compression behind the lows to deliver price on the downside, so we just have to wait for rebalancing in POI and trade pattern formation!
Not financial advice, always think with your head! ❗

Litecoin(LTC): Rejected 200 EMAAfter that major rejection from the 200EMA price, LTC has had a hard and sharp rejection without any resistance from buyers.
We are seeing here a further movement to lower zones to occur, but we are prepared for a potential small correction as well before continuing the downward movement.
Swallow Team

LTC inteligentassetyesterday get supported at 63 lower limit
channel
bullish scenario
resistances 70.2 in 50 ema. 72.3 , 76.6, 86.4 W pattern target & 800 ema
bearish scenario
supports 63.7 lower limit channel, 62.47, 57.3, 50.4

Litecoin longLitecoin bounced off the lower boundary of ascending channel. Bullish movement to resistance level at 72.6 is possible.

Let's try one more time - going short on LTCUSDTI am expecting the price go down a little bit, till the next level. Let's try to win the lottery one more time as it was the last time. I will wait till the impulse goes flat.

Level breakoutHello, this is my very first trading idea at this resource. I expect the price to go through a few levels down. I am not sure about this by the way, just trying to learn something. I am a noob on this topic (a kind of to be honest, but no experience in manual trading). Wish me good luck in this hard way.

buy - sell (LTC)📊Analysis by AhmadArz:
🔗"Uncover new opportunities in the world of cryptocurrencies with AhmadArz.
💡Join us on TradingView and expand your investment knowledge with our five years of experience in financial markets."
🚀Please boost and💬 comment to share your thoughts with us!

...(LTC)📊Analysis by AhmadArz:
....
🔍Entry: 72
🛑Stop Loss:72.82
🎯Take Profit: 71.30
🔗"Uncover new opportunities in the world of cryptocurrencies with AhmadArz.
💡Join us on TradingView and expand your investment knowledge with our five years of experience in financial markets."
🚀Please boost and💬 comment to share your thoughts with us!

Ltc long positionLtc trying to overcome the difficulties of this market, some sellers exahustion at sight, we may see some rise, so I'm gonna bet for some profit today, long position opened, good luck all

Litecoin(LTC): Bullish Or Bearish??LTC is back on radat with another touch to upper 200EMA after that massive liquidity movement on to lower zones.
Despite the fact that we had a nice rejection (another) at EMA we are waiting for perfect setup to form in order for us get a good entry. What do you think? Will we see a breakout in the upper zones or a breakdown in the lower zones?

Litecoin longLitecoin bounced off the ascending trendline and bounced off the support level. Bullish movement to resistance level at 75 is expected to happen.

LTCUSDTWaiting for OB
Pending Order is acceptable,
Entry price, SL , TP1 and TP2 is shown on the chart

LTC Showing a bearish SharkLooking at the LTC chart, it looks like we did a bearish shark and we could have one more move to the down side or we have completed the bearish shark (since the recent low got close to the previous all time low). A break above the previous high should invalidate the bearish sentiment.
In the short term I am bullish on BTC so I want to believe we have completed the bearish shark on LTC but charts don't lie, emotions do.
Please do your DD as this is not a financial advice.

LTC Formation#ltc Technical Analysis
litcoin is forming a triangle and after making a fakeout it is still moving below the resistance, if it get rejection in the price ranfe of 72-73$ it might fall to 65$,
65$ would be the good price to accumlate some NYSE:LTC , ltc is among the major coins and it didn't have perform since its halving.
for long term holder ltc is giving green single to start filling your bag with tthe rish mangement,
#beyoglu

LTCUSD Daily Chart January OverviewLTCUSD overall idea is bullish currently accumulating on this daily chart expecting a complete push on the bullish sentiment and structure which we are already seeing. The weekly chart was posted with ideas on the monthly also supporting this ongoing change in market direction.
Currently forming TA on Daily Chart so short term bullish impulse into bearish rally/dump for this next couple days to transition into the ST to indicate progression in our schematic.
Looking for price to react in one of the two zones marked here for the Thrust to form where a potential short setup may be valid. I expect price to reach 92 however it to slow down as it approaches this number. It is important to see how price moves towards this point to have a clear judgement.
I expect this later ST to form within the current range which we are already in however there is no clear region i expect the very big mark up which typically presents an opportunity in these schematics. I don't expect price to drop below 63-62. Please note we must foorm the TA before the ST opportunity is validated.
Not Financial Advice.
Follow for more ideas :)
Phi Traders . Founder - Sayry Llumigusin Parra
Tags(ignore): Wyckoff, Fibonacci , Volume , SMC , Smart Money Concepts, ICT , Inner Circler Trader , Supply and Demand

LTCUSD Weekly Chart January OverviewLTCUSD overall idea is bullish currently accumulating on this weekly/daily timeframe expecting a shift in structure to indicate we are moving higher for the week and possible weeks to come. On the monthly we see this as a continuation in a further higher low that shows basic bullish structure.
Currently forming TA on Daily/Weekly Chart so short term bullish impulse into bearish rally/dump for this next couple weeks to transition into the ST to indicate progression in our schematic.
Looking for price to react at 155.40 for formation of Thrust and perhaps a distribution on lower timeframes, with confirmations of the schematic in Phase B
Looking for price to react below 40.36 for the formation of the ST however we must form this TA before that
Not Financial Advice.
Follow for more ideas :)
Phi Traders . Founder - Sayry Llumigusin Parra
Tags(ignore): Wyckoff, Fibonacci , Volume , SMC , Smart Money Concepts, ICT , Inner Circler Trader , Supply and Demand
