LTCBULLUSDT trade ideas

LTC 🐂It seems that this coin has entered an ascending channel. The support and resistance lines are carefully drawn. The main target can be $100.

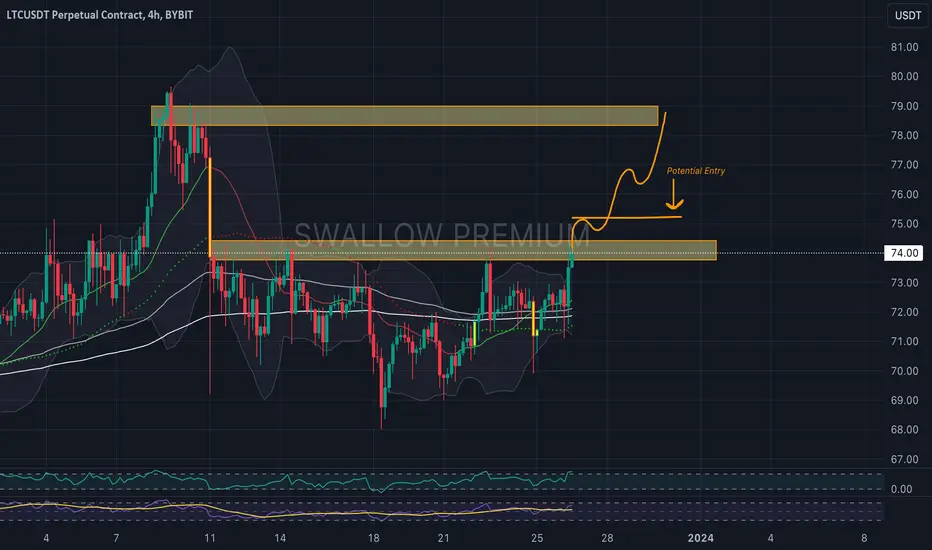
Litecoin(LTC): Going For A BreakoutLitecoin is showing some strength, pushing towards upper resistance, and potentially breaking it soon as well!
We are looking here for a clean breakout to happen in order to catch a potential long position!
Eyes open as if we will not see a clean breakout, then we will go back towards EMAs
ltcThe above goals are characteristic
This box should be broken and stabilized so that they can be thought of in the long term
We also have a small support in the green lines

#LTCIt is located in an ascending channel, which with the swing that attacked the resistance in the daily time, it can continue its growth after a pullback up to the specified areas, and after breaking the ceiling of the short-term channel, this growth will continue up to the daily and weekly supply area.

Litecoin longLitecoin broke trough the descending trendline. Asset broke trough the resistance level. Bullish movement to resistance level at 79.3 is expected to happen.


LTC to 449$ .. but it may take some time this chart is based on Elliott wave theory and also according to DAW theory .. chart repeat it self again.
if you looking to the chart you will find that we are going to repeat the same move to go to 445$ at least
Targets:
🎯1st Target: 115 $
🎯2nd Target: 222 $
🎯3rd Target: 293$
🎯4rd Target: 449$

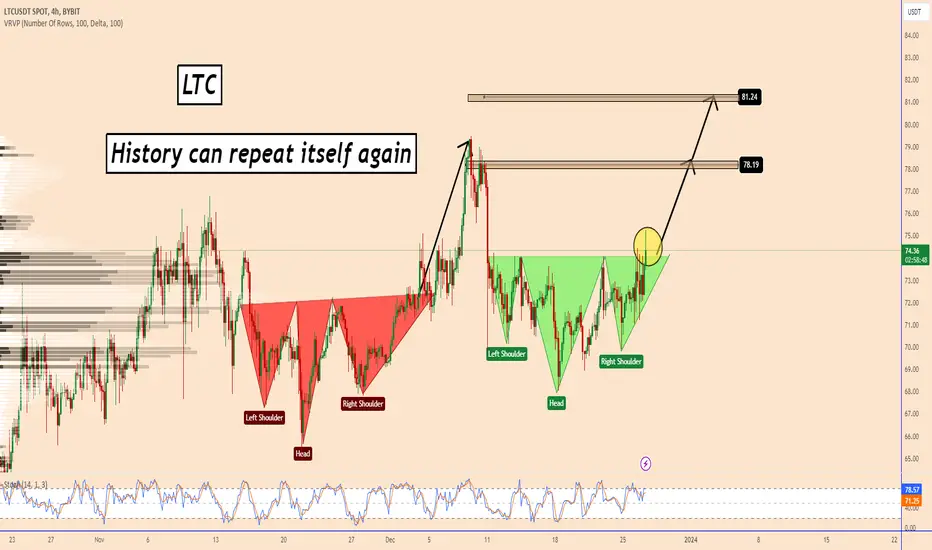
LTC: History Can Repeat Itself AgainLTC: History Can Repeat Itself Again
Over the previous weeks, LTC made the first attempt to rise and we can see a nice bullish move set up in early December—an Inverse Head and shoulder pattern.
The price is confirming the same pattern again, increasing the chances of another bullish move. It is very similar to the previous pattern and the price will likely increase in the same aggressive manner.
You can find more details in the chart!
Thanks and good luck!
LTC / USDT - Bullish Signs (Litecoin)Show some strong signs:
1: at 200 moving average wait fir breakout
2: at VWAP wait fir breakout
if price breakout 200 MA + VWAP
Target
1. Weekly 200 moving average at 90 level

LTCUSDT # 001 ( clear road map on Bullish Rally ) Hello dear traders .
Good days.
On Weekly time frame , Bearish Gann Square time Finished and LITUSCT started new Bullish rally .
Frame this position with one surge , it will try to broken Gann Arc resistance which will be about 75 $ and fail . One more correction leg will continue to the Buy Zone which will be the last and lowest price up to the at least 2-3 years .
On price 69 $ LTCUSDT will get support from lower Gann Square fan line to start crazy bullish rally.
Long shut view will update for mor information .
Chart updated and plotted with help of Gann Square and Gann Box.
Good luck and safe trades.
Thanks for your support and comments.

LTCUSDT Bearish Flag - Channel Trendline Quality Support PlayIn this comprehensive examination of LTCUSDT within the 1-day time frame, a discernible bearish flag formation is apparent, accompanied by the development of a channel. A strategically placed Buy Limit Order on LTCUSDT leverages a robust support level derived from a more expansive timeframe, emphasizing the reliability of the chosen entry point.
The rationale behind this tactical move extends to the identification of a quality heavy support level on a larger timeframe, lending credibility to the trade. The take-profit (TP) placement exhibits a judicious approach, aligning itself beneath the resistance of a higher timeframe, particularly the weekly chart.
Furthermore, a synergy with technical indicators, moving averages, and oscillators is anticipated, with a synchronized descent that substantiates the validity of the bearish flag formation. This holistic analysis underscores the meticulous consideration given to various facets of the market dynamics, rendering the proposed trade not only strategically sound but also well-founded in the context of prevailing technical signals.


LTC - Swing Trader - Target: 85.50Good luck to everyone! This analysis is for educational purposes only and does not constitute financial advice. Conduct your own analysis before making trading decisions.

LTCUSDT: Riding the Bullish Waves with a Long Adventure! 🐂🌊Introduction: 🌐 Get ready for an exciting adventure in the crypto seas with LTCUSDT! Traders are embarking on a long journey from $71.44, riding the recent upward structural break and the formation of a sloping support level. Let's dive into the details of this bullish odyssey.
Trade Details: 💰 The long position (#LTCUSDT) sets sail from $71.44, secured with a stop-loss at $70.36. The rationale behind this move is the local break in the upward structure (BOS), forming a sloping support level. Price retracements reveal manipulation around liquidity, signaling significant player positions.
Technical Analysis: 📊 Zooming into the 15-minute timeframe, LTCUSDT has locally broken the structure upwards (BOS) and formed a sloping support level. Price retracements indicate manipulation over liquidity, suggesting the accumulation of positions by a large player. A level is set at $71.98, anticipating stops from short sellers to act as a magnet for market makers.
Expectations and Strategy: 🎯 The trader anticipates price compression towards the level through the slope, expecting further breakthrough beyond.
Trade Target: 🚀 The primary goal is to ride the bullish waves, capitalizing on the structural break and exploiting potential liquidity traps.
Conclusion: 🌊 LTCUSDT invites traders to ride the bullish waves on this exciting adventure. Prepare for a journey of potential profits, watch for price compression along the slope, and get ready for a breakthrough beyond! 🚀💹

LTC/USDT | 1d 👀1. Litecoin is currently consolidating within a multi-year symmetrical triangle pattern, hinting at a potential breakout with an upward trajectory.
2. A plausible target could be $140 in the event of a successful breach of the upper resistance trendline.
✅ Stay updated on market news and developments that may influence the price of Litecoin. Positive or negative news can significantly impact the cryptocurrency's value.
✅ Exercise patience and discipline when executing your trading plan. Avoid making impulsive decisions driven by emotions, and adhere to your strategy even during periods of market volatility.
✅ Remember that trading always involves risk, and there are no guarantees of profit. Conduct thorough research, analyze market conditions, and be prepared for various scenarios. Trade only with funds you can afford to lose and avoid excessive risk-taking.
#Crypto $Litecoin #Trading NYSE:LTC

LTC Long Opportunity I will Enter LTC long market order.
LTC moving nicely in the Channel.
LTC looks bullish

LTC - Litecoin coils up for Mini CycleHi Traders, Investors and Speculators of Charts📈📉
Litecoin has gone through an extended accumulation phase, and by looking at previous examples of macro cycles on LTC, next up is most likely another upward cycle.
Previously, LTC went straight from bearish cycle into a mini cycle. But this time, we went straight from bearish cycle into accumulation phase, indicating that a mini cycle may likely be next before we hit the parabolic bullish cycle. In other words, MINI CYCLE and ACCUMUATION PHASE has swapped around this time after the BEARISH CYCLE.
There's no indication on the chart of a definitive move into an upward cycle just yet, thus I'm expecting a few more candles of accumulation / range trading.
It's important to note that during the mini cycle, the price can increase AND decrease substantial amounts. The price usually decreases back close to the starting point fairly quick after the increase. The mini cycle also lasts much longer than the parabolic bullish increase cycle:
These are the parts of the cycle we are waiting to repeat, with MINI / MID CYCLE coming up next, followed by more accumulation, followed by the parabolic bull cycle :
You'll know when it's around time for the parabolic increase phase when another Bullish Cross is observed on the LTC Market Cap :
Another great way to watch out for that serious bull run cycle is when LTCBTC starts to trade closer towards the white trendline and even above. Consider that the phase has ended again when LTCBTC candles lose the white trendline:
_______________________
📢Follow us here on TradingView for daily updates and trade ideas on crypto , stocks and commodities 💎Hit like & Follow 👍
We thank you for your support !
CryptoCheck
CRYPTOCAP:LTC BINANCE:LTCUSDT BINANCE:LTCBTC COINBASE:LTCUSD

LTC/USDT Potential longIndicators printing a potential long, where oscillator point up and 2 hidden bullish line getting printed, and bouncing of the green line.
the jewlite pointing upwards and went to white while pointing upwards indicating that a small long scalp are potentially getting ready. 2.3 reward ratio. But still risky. remember low leverage if you are thinking about taking this trade with stop loss

#Litecoin $LTC Trading IdeaIt seems that the HYPE was real. One day we are bullish the second we are bearish.
CRYPTOCAP:LTC #Litecoin formed this bearish flag. If it plays out I expect to see the price again at $62-56 approx.

ltc preparing for massive breakout seems like getting ready for solid recovery
so far consolidating in multi year symmetrical triangle and expecting breakout soon incase of successful breakout expecting massive recovery in midterm
expecting move towards 250 to 300$ in coming months incase of successful breakout

LTC/USDTactually looking bullshit on higher tf.
possibility for a quick scalp set up here, with low risk stop loss.

#ltc #litecoin will come the valuesBe careful as Litecoin will go up to $800 and will be worth all the blue values.
