Ltc looking to movelitecoin looking good here, could see a nice move up
already long from the bottom but still a good price to get in on it
LTCUSDT.P trade ideas

We are now at the breaking point!Targets: 75 - 102 - 131 ... and more
This is not advanced work! Please do not consider it as investment advice!

LTC WHAT'S NEXTHello Traders and everyone, I am Hadi Karaali, Known as SNIPERS_FX
If you like the idea, do not forget to support with a like and follow.
What's next on LTC
As we can see price got stuck inside this big rangy market between our support and resistance zones.
However, price is still overall bearish from a shorter-term perspective, and for the bulls to take over we need a break above the marked minor resistance zone, where we will be expecting a further movement higher.
Meanwhile, and until that happens, price can still trade lower to be approaching our lower support zone where we will be looking for new longs.
If you like this kind of analysis don't forget to like and follow
and as usual follow your trading plan and manage your risk.
Be patient and good luck!

Most Undervalued Large-Cap CoinLTC is probably the most undervalued coin at the moment.
1) The halving event occurred in August 2023. The fact that the price is trading 20% below the halving price, despite BTC making yearly highs, is a joke.
2) The price is at the level of January 1, 2023. Now, almost at the end of 2023, the fundamental conditions are in no way similar to what they were at the end of 2022. Interest rates have stabilized, BTC is rallying, and a BTC halving is around the corner. There's no reason the price should be at the yearly lows given the current scenario.
3) The capitulation event already occurred after the halving on August 17, 2023. Easy liquidity has already been captured.
4) The supply shock from halving is an additional bonus; even without it, LTC's price is pretty undervalued.
5) The price should easily recapture the $100 mark level before the year's end at least.

Litecoin Aiming at the $72 ZoneLitecoin exhibits less dynamism and activity. This can be attributed to the decreased interest in “older” coins from buyers, who seem to prefer new and developed blockchains like the Zkevm, the Layer 2 Blockchains like Cyber, Sei and the likes.
Nonetheless, LTC has come remarkably close to the resistance zone of $70.00-$72.87, opening up the possibility of breaking out of the sideways trend that has persisted for three months.
Should buyers successfully navigate through the current resistance zone, LTC could initiate an upward trend, aiming for highs at the $76 and $79 levels. These points serve as the initial targets for buyers in the event of LTC's growth.
A correction in the BTC chart might similarly impact the LTC price. At present, the relevant support zones are found within the ranges of $66.3-$67.6 and $63.2-$64.8. However, if Bitcoin falls by 5-10% in a short span, LTC could quickly plummet due to the apparent lack of buying strength in its chart (at least at the time of writing this review), easily breaking through all the existing support zones.

💡Trade Idea #LTC/USDT:Another bullish scenario and another leg up on #Litecoin if we gonna get past through this massive daily resistance zone.

LTCUSDT BY HesamUNTHey traders
what u think about LTC ?
im going for 25$. lvl by lvl, step by step
share ur thought and leave a comment

LTC/USDT 1D ReviewI invite you to review the LTC/USDT chart. Starting with the blue lines marking the upward trend channel from which the price broke down, but locally you can see a sideways exit from the yellow downward trend line.
In order to determine support for the price, we will use the Fib Retracement tool and thanks to it we can see that the price is struggling to climb out of the strong support zone from $68.86 to $56.22. If the current zone did not support the price, we could see a decline to the area support at $40.26.
Looking the other way, we can similarly determine the resistance areas that the price must face. And here we see that the first significant resistance is at $78.72, and then we have a strong resistance zone from $92.60 to $102.46.
The CHOP index indicates that there is still some energy left for the move, the RSI indicator has a slight recovery and there is room for the price to go a little higher, when we look at the STOCH indicator we see that it has exceeded the upper limit, which influenced the recovery, but in combination with the RSI indicator it may be slight recovery and another increase in the LTC price.

Litecoin Macro Analysis : BIG MovesHi Traders, Investors and Speculators of Charts📈📉
From the charts; a macro view on LTCUSDT with Fibonacci Retracement, Cycle analysis and Time Frame analysis.
By taking a detailed look, you can clearly see that the next phase bound to happen is the bullish phase, and Litecoin is no stranger to parabolic upside movements. I hope your bags are packed because once LTC moves, it's hard to jump onto a moving train.
The bullish signs are:
✅ Consolidation under resistance zone / bullish
✅ Higher Lows - buyers are buying up dips
What's still missing:
✅ Bullish Technical Indicator (Weekly on CryptoCheck START v3.5)
✅ Weekly candle close ABOVE 70
Even thought the price may continue to trade just under the resistance for another while, the next big market cycle is clearly the bullish phase.
_______________________
📢Follow us here on TradingView for daily updates and trade ideas on crypto , stocks and commodities 💎Hit like & Follow 👍
We thank you for your support !
CryptoCheck
BINANCE:LTCUSDT

LTCUSDT let go thru....After a nice retrace ...LTCUSDT perfectly Bouncing from 200MEA @ 4Hrs...
as per the momentum on LTC, i at least can see a through up till 75$ .... let the BTC decide to pop up or not...
KEEP tight SL
This is jus an IDEAD
Plz do your own research n NAFA
Thank You....

LTC/USDT Break Alert!! Upward Momentum for Litecoin ???💎 LTC has indeed seized our interest, breaking through the Symmetrical Triangle pattern with substantial volume and a robust bullish green candle. LTC successfully breached the resistance zone, which has now transitioned into a support level at $68.30.
💎 However, LTC has not yet initiated a downward movement for a potential retesting phase. At this juncture, LTC is poised to extend its upward trajectory, given the successful breakout from the resistance. It's LTC Probability could reach the supply zone and the bearish OB region.
💎 However, if LTC fails to uphold the support at $68.30 and compromises this level, it may retreat to the demand zone for a significant bounce. Should LTC descend to the demand area and fail to exhibit any bullish rejection or bounce, it risks forfeiting the demand zone, signaling a false breakout. Under these circumstances, LTC would be under downward momentum, potentially heading towards a lower support zone, and might even extend its decline to a critical support area.

LTC - A VERY CRUCIAL TIME - PRE-HALVING
We are at a crucial point right now. Being that we are at wave E of wave 4 it only means one thing, short-term drop in price to $53-50 to complete wave 5 (pre-halving) then the mid to Long-term journey to $150 begins for post-halving effect on previous analysis (see previous analysis on my page for context).

LTCUSDT - D1LTCUSDT
D1 - The price has emerged from a protracted consolidation through a triangular formation, which may lead to further upward movement. You can try to consider buying from the level of 73.20. If the price can gain a foothold at the level of 68.80 and make a retest, we can expect the movement to continue.
Global target 115.05
If there is a false breakout and liquidity is removed, the price may return to the channel; in this case, it is necessary to wait for a clear formation to consider purchases.
What can you expect?
You can consider entering from the level of 73.20 (you can consider breaking through the level) with further movement to the target 94.56. You can also consider entering from a correction if the price consolidates above 68.80 (With exit from the position after the 2nd wave)
Cancel the idea so as not to take increased risk from the level of 59.50 - 55.10. There may also be a false breakout of this level and continuation of the upward movement - in this case, it will be necessary to wait for a clear formation to continue the upward movement.
It is better not to trade inside the channel, but to wait for a clear situation for trading.
Targets 79.80 - 85.47 - 94.56 - 115.05

Litecoin longLitecoin broke trough the descending trendline. Asset broke trough the resistance level. Bullish movement to resistance level at 68.8 is expected to happen.

LTCUSDT.Poday, the price of Litecoin stands at $64, backed by a 24-hour trading volume amounting to $234 million. With a market capitalization of $$4,735 billion. Over the past 24 hours, the LTC price has seen a 3.94% increase.
The LTC price analysis for 22 October confirms that bulls are attempting to prevent a downward rally as LTC price met a surge in buying pressure and is exponentially surging toward $66. Over the last few hours, LTC price flashed high buying pressure in an effort to meet buyers’ demand.
Analyzing the daily price chart, Litecoin price is currently experiencing buying activity as it made a buying pressure from the low of $60.
BE CLEVER AND CHOOSE YOUR SIDE THEN TRADE THE ADVICE .
If u want to have more our private idea text us.
Long position
🔻 Buy LTC
📌Entry: 62.50 - 62
🚫 SL: 59.50 - 59 ( -4.80 %)
🚫 TP: 70.10 ( +12.20 %)

Short idea on LTCAs I wrote earlier, I like Litecoin.
There will be a halving soon (people think it's time to buy)
The market is generally positive
I like the structure
*not financial advice (these are trading ideas myself)

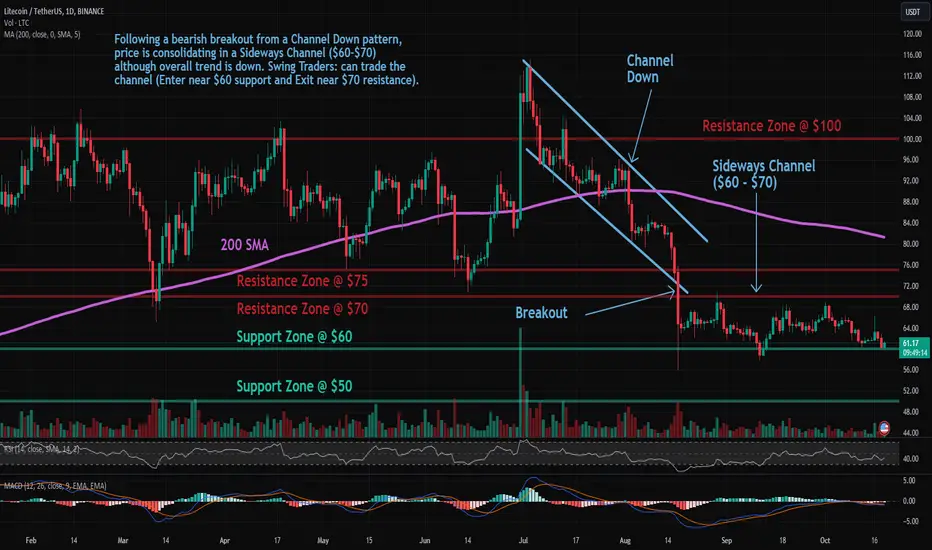
LTC: Sideways ChannelLitecoin (LTC) technical analysis:
Trade setup: Following a bearish breakout from a Channel Down pattern, price is consolidating in a Sideways Channel ($60-$70) although overall trend is down. Swing Traders: can trade the channel (Enter near $60 support and Exit near $70 resistance).
Pattern: Price is trading in a Sideways Channel , which is a neutral pattern (indication of market indecision). Trend Traders ought to wait for a breakout in either direction, although typically it breaks in the direction of the existing trend. Swing Traders can trade the range – Buy near Support and Sell near Resistance.
Trend: Downtrend across all time horizons (Short- Medium- and Long-Term).
Momentum is Bearish ( MACD Line is below MACD Signal Line, and RSI is below 45).
Support and Resistance: Nearest Support Zone is $60, then $50. The nearest Resistance Zone is $70, then $75.
LTCUSD ❕ declineTD Sequential has formed a reversal signal to the downside (4H TF)
Price broke down through 50EMA (1H TF)
RSI is moving in the sellers zone (1H and 30m TFs)
I believe that LTC will continue to decline.

Litecoin shortLitecoin bounced off the upper boundary of descending channel. Asset bounced off the resistance level. Bearish movement to support level 60.4 is expected to happen.

NEW IDEA FOR LTCUSDT By maintaining the resistance range of the ceiling of the ascending channel between 62.19-62.05, LTCUSDT can decrease to support the bottom of the channel in the range of 60.90.

LTCUSDT WILL FOLLOW A BEARISH MOMENTUMLTCUSDT created an bearish pennant followed by the bearish trend formed. Here we see a breakout and pullback on the key level where it still remains under the bearish pressure which is expected to revisit back on the highlighted support on the bottom.

LTCUSDT short idea for monthly, day, H4Hi guys. What do you think about LTCUSDT ? I think so too. The price could not break the daily and 4-hour resistance. Bitcoin is also bearish.

LTC/USDT Potential Movement to $64Hey traders👋
LTC coin had caught our attention here with a good potential for some further bearish movement here! Keeping eyes open and hand ready for a good short position here!
If you like ideas provided by our team you can show us your support by liking and commenting.
Yours Sincerely,
Swallow Team
Disclamer:
We are not financial advisors. The content that we share on this website are for educational purposes and are our own personal opinions.
