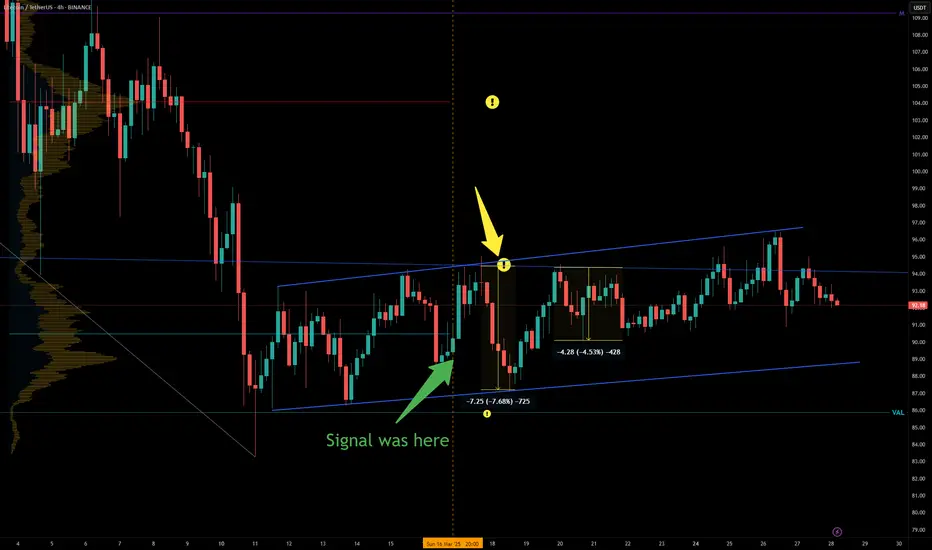
LTC - What a Nice SIGNAL was given days ago.That marked level (yellow point) gave us 2 beautiful easy Shorts.
7.6 % 👌 🎯
4.5 % 👌 🎯
Original TA was here:https://www.tradingview.com/chart/LTCUSDT/Uuxk9kRM-LTC-Some-POIs-Better-to-Short/
Follow for more ideas/Signals. 💲
Look at my other ideas 😉
Just donate some of your profit to Animal rights and rescue or other charity :)✌️
LTCUSDT.P trade ideas
Thread 1: LTC - Spot Signal 2025Hello there,
Today, I’m kicking off 50 dedicated threads to track key parameters and critical trading pairs. Specifically, these will cover Total, Total 2, Total 3, BTC.D, BTC, the top 50 coin list, and select standout tokens.
I’ll focus on one thread at a time, delivering major updates within those threads instead of scattering small posts for every change. Feel free to hit Follow and keep tabs on the threads that catch your eye!
Thread 1: LTC - Spot Signal 2025
Buy Zone: $85 - $95
Targets: $180 - $200
Hold Time: Throughout 2025
Updates: I’ll drop additional updates here when LTC shows significant shifts.
Good luck out there!

casually sniping the bottom in LTCUSDTI stumbled upon my old Elliott wave labels on the LTCUSDT , checked it's short term relative strength with BTCUSDT , looked more closer to the weird sideways to up consolidation and found a dodgy long with a microscopic stoploss , targeting ATH like a degen ...

LtcThe two arrows marked on the chart are the appropriate areas for entering a short trade. Entry with candlestick confirmation

Litecoin $LTC to 109$?⚠️ RISK TRADE ⚠️
👑 #LTC/USDT BUY 👑
Entry price:
91 🟩
Targets:
1️⃣ 97🎯
2️⃣100🎯
3️⃣106🎯
4️⃣109🎯

LTC - Perfect Signal Gave 8 %What a beautiful short Signal. To the damn point!
👌 🎯 8 %
Original TA was give here:https://www.tradingview.com/chart/LTCUSDT/Uuxk9kRM-LTC-Some-POIs-Better-to-Short/
Follow for more ideas/Signals. 💲
Look at my other ideas 😉
Just donate some of your profit to Animal rights and rescue or other charity :)✌️

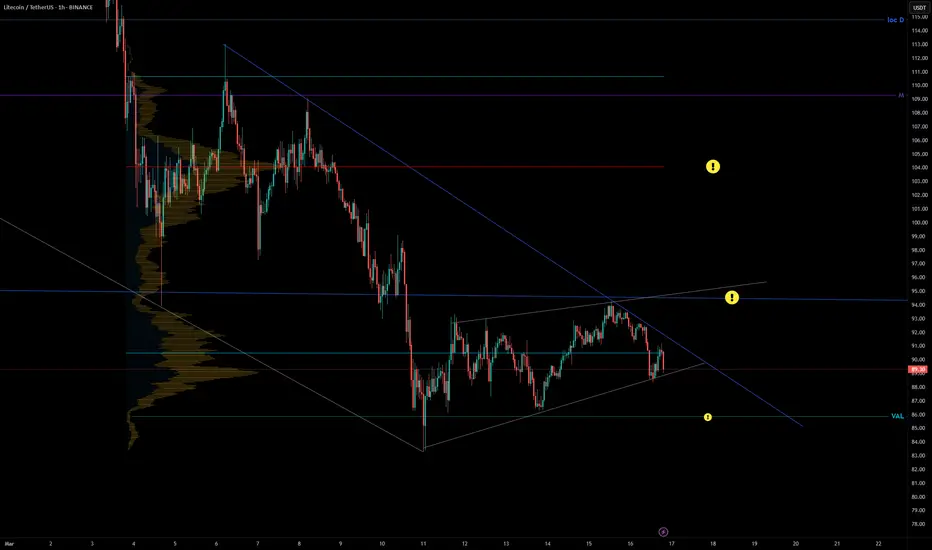
LTC - Some POIs - Better to ShortThere are some POIs for shorting.
Both upper yellow marks seem to be a good level.
BUT: We must do a new TA (volume etc...) if the price reaches there !
Lower points like VAL and last low are local key levels. If the price loses these levels, then a it goes lower.
You can even trade the grey TL (rising channel)
Follow for more ideas/Signals. 💲
Look at my other ideas 😉
Just donate some of your profit to Animal rights and rescue or other charity :)✌️
LTCUSDT Breakout Loading….BINANCE:LTCUSDT has been consolidating for several days, repeatedly testing resistance levels. This pattern suggests a potential breakout is on the horizon. With ETH already gaining momentum, Litecoin could follow suit. Once the market starts moving, plenty of trading opportunities may arise.
Trade Smart: Always use a stop loss and manage your risk effectively.
BINANCE:LTCUSDT Currently trading at $91.5
Buy level: Above $91
Stop loss: Below $83
Target : $130
Max Leverage 3x
Always keep Stop loss
Follow Our Tradingview Account for More Technical Analysis Updates, | Like, Share and Comment Your thoughts

BUY LTC at $90? | BTC | XRP | DOGELTC sitting on major trendline at $88
Holding here will be a long term buy.
I will accumulate here and will sit tight after so much turbulance on this coin.

LTC Long SetupWould like to see a liquidity grab at $89.60 before moving to fill the gap.
Entry: 89.60
TP: 94.31 | 95.34 | 96,49

LTC Ready for PUMP or what ?The price can encounter a strong pump after declining to the bottom of the triangle, and after breaking the triangle, it can reach the desired targets.
Give me some energy !!
✨We spend hours finding potential opportunities and writing useful ideas, we would be happy if you support us.
Best regards CobraVanguard.💚
_ _ _ _ __ _ _ _ _ _ _ _ _ _ _ _ _ _ _ _ _ _ _ _ _ _ _ _ _ _ _ _
✅Thank you, and for more ideas, hit ❤️Like❤️ and 🌟Follow🌟!
⚠️Things can change...
The markets are always changing and even with all these signals, the market changes tend to be strong and fast!!

LTC/USDT 1W🩸 CRYPTOCAP:LTC ⁀➷
#Litecoin. Macro chart Another
💯 Intermediate Target - $194
🚩 Macro Target 1 - $270
🚩 Macro Target 2 - $422
🚩 Macro Target 3 - $638
- Not financial advice, trade with caution.
#Crypto #Litecoin #LTC #Investment
✅ Stay updated on market news and developments that may influence the price of Litecoin. Positive or negative news can significantly impact the cryptocurrency's value.
✅ Exercise patience and discipline when executing your trading plan. Avoid making impulsive decisions driven by emotions, and adhere to your strategy even during periods of market volatility.
✅ Remember that trading always involves risk, and there are no guarantees of profit. Conduct thorough research, analyze market conditions, and be prepared for various scenarios. Trade only with funds you can afford to lose and avoid excessive risk-taking.

Litecoin is in a bearish cycle (12H)From the point where we placed an arrow on the chart, it appears that Litecoin's complex correction has begun.
Currently, we seem to be in wave C of this correction.
Wave C, based on the 3D structure, could end at demand 1, leading to wave D, which is a bullish wave.
However, ultimately, wave E could conclude within the demand 2 zone.
Liquidity pools for waves C and E are marked on the chart, and it is expected that each will be swept in turn.
For risk management, please don't forget stop loss and capital management
Comment if you have any questions
Thank You

LTC ready for launchLTC is poised to break out for $99. It could even decouple with bitcoin and continue on its way. Not investment advice.

LTC at a Double Resistance ZoneLTC at a Double Resistance Zone
LTC faced a double resistance zone on the 4-hour timeframe, located near 112.80.
The price has already moved down, and on the 60-minute chart, a small bearish pattern has emerged, indicating a potential further decline.
It appears that LTC may begin a bearish trend from this zone.
Key support areas: 95, 88, and 80.50
You may find more details in the chart!
Thank you and Good Luck!
❤️PS: Please support with a like or comment if you find this analysis useful for your trading day❤️

Ltcusdt Hello guys welcome. Here I allready share idea about ltc's chart . But seller taken control so until selling market control by seller.
About me- if you all guys like my prediction and interested than follow me and I will help who trap in any trade . Top 3 select guys I will predict thair trade and share.
Notic - all market are risky and this business is possiblety base. Not be sure but do most successful home work

Ltcusdt So hello guys welcome. Here I share my idea about Trend. So I am not giving suggestion any investment so invest on your risk. If you want to learn so keep follow me and and look at my prediction how to react market
So here is the LTC chart so I found the symmetrical pattern this pattern can move any direction after break out market moment so bullish expectation so very high the reason is buying zone so let's see what happen the chat after the break out and get the target

Litecoin (LTC): We Are Dropping / More Incoming!Litecoin has dropped 15% since our last look at the coin and now we expect the 100EMA to be broken, so we can fall further down!
More in-depth info is in the video—enjoy!
Swallow Team

Litecoin (LTC): Last Crash Before New ATH?We are seeing yet another rejection from upper resistance zone, which can send price back for another -20%...
More in-depth info is in the video—enjoy!
Swallow Team

Ltc bullish as soon as Hello guys welcome. Here I share a idea about trend. please before any investment research own your risk. This is ltc chart and buyer and seller very strong fight for market move. Here multi support but still waiting for buyer coming. So keep on eyes.

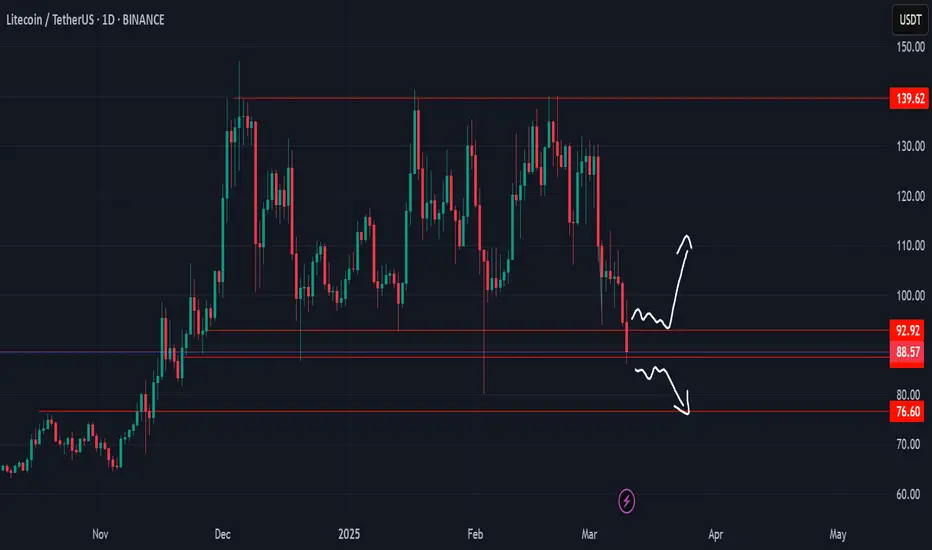
LTC Strong Support ZoneLTC is on strong support zone, but if can't go back to above 92, we can posible heading to 76
Litecoin (LTC): Possible Downward Movement of 15%After filling the CME gap, we are seeing selling pressure here, which might send the price back by 15%. So far we have had a decent rejection as well so keep an eye on further BoS on the 5M timeframe!
More in-depth info is in the video—enjoy!
Swallow Team

Litecoin (LTC): Might Push Towards CME / 16-17% MovementLitecoin has a chance of recovery, which would also fill that CME gap nicely. In addition to that, looking historically at the recovery of LTC, we see some quick movement!!
More in-depth info is in the video—enjoy!
Swallow Team
