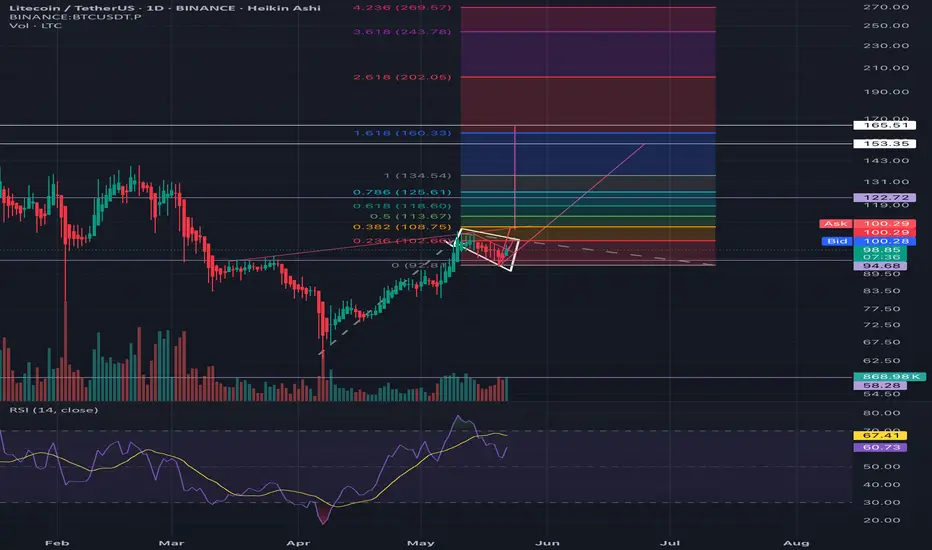
Litecoin Bullish Continuation Confirmed, Last Chance ($200 Next)Litecoin grew 69% from its April correction bottom and currently trades 54% higher from this low point, the retrace was very, very small. A small retrace means that there is no sellers pressure. Lack of sellers pressure means plenty of room available for growth in the coming weeks and months. People are not willing to sell their Altcoins (Litecoin). As soon as the market goes bullish, which is now within days, this will produce massive interest and a strong bullish wave.
Litecoin is set to grow now as the action turns green. Weeks of consolidation and nothing changes, the chart structure remains perfectly bullish.
This is a time sensitive update. The retrace is over. The wait is over. Crypto is going up.
It is better to be in now, "buy like it is the end of the world."
It is better to be in the market now, 100% in, because the next advance will be so strong you will not believe it until it is fully done. Litecoin will hit the highest prices in years, the same for Polkadot, Notcoin and the other pairs that I shared daily @MasterAnanda. The time is now.
This advance will be so great, that everybody will turn their attention to the Cryptocurrency market. It will affect mainly the Altcoins. Everything that has been neglected for years will be recover and hit the highest prices in a long while. Multi-years high.
You've been warned.
Namaste.
LTCUSDT trade ideas

Litecoin (LTC): Break of Resistance | Buyers DominatingLitecoin is showing signs of a possible bounce that we might be taking very soon. While we had a successful breakout here, we also see with the current retest price showing signs of recovery, where buyers are not giving the current zone away easily.
More in-depth info is in the video—enjoy!
Swallow Academy

LTC Update I believe it's time to get ready for CRYPTOCAP:LTC to take off. Buckle up and stay tuned—big moves are ahead 🚀🫡

LTCUSDTThe tool watches for a strong upward move (called the flagpole).
Then it looks for a small pullback or sideways move (called the flag).

The chart for Litecoin (LTC/USDT) on the daily timeframe shows a
🔍 Technical Analysis Summary:
Pattern: Falling Wedge (bullish reversal pattern)
Breakout Direction: Upward breakout from the wedge appears to be projected.
Current Price: ~$96.72
Target Price: $120.95 (projected post-breakout target)
🟢 Bullish Signs:
The falling wedge typically signals a potential trend reversal to the upside.
The breakout projection suggests a strong upward movement is expected after accumulation.
📈 Price Targets:
Short-Term Resistance: $100.00 psychological level.
Main Target: $120.95 as shown on the chart.
🔻 Risk Management:
Key support lies within the wedge’s lower boundary around ~$90–92.
Break back below the wedge could invalidate the bullish outlook.
Summary:
Litecoin has formed a bullish falling wedge pattern. A breakout above the wedge could push the price toward the $120.95 target. Confirmation is needed with strong volume. Maintain stop-losses below the wedge support to manage risk.

ETHERUM TRADE IDEA GOING INTO THIS NEW WEEK. We have rejected from a resistance, we have also broken a support level. I have set a limit for a sell.
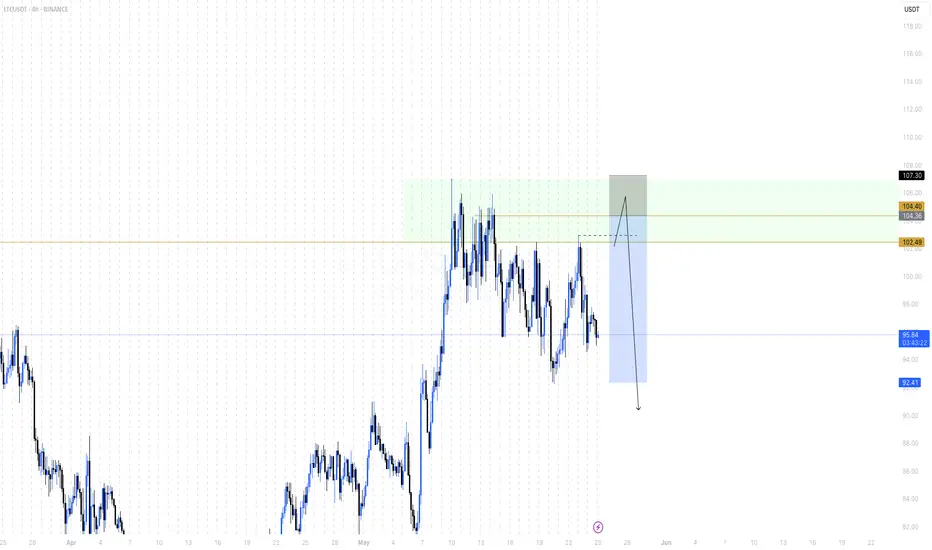
LTCUSD 4h time frame analysishi
Today we are analysing Litecoin on 4 hour timeframe
Litecoin are currently trading at $95
We see the parallel downwards sloping channel perceiving 'the flag' starting at the swing high at the resistance line shown.
The price is pulling back slightly, making lower highs.
Enter a long position when there is a breakout, when the price breaks above the upper resistance line.
Technical target: 120$

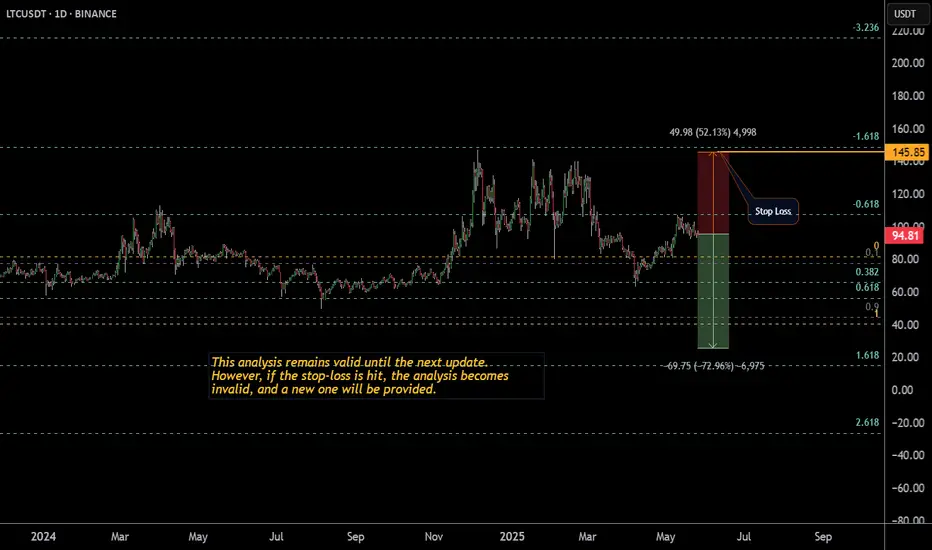
Litecoin-LTCUSD Analysis-Issue 85 (Free Access)The analyst believes that the price of Litecoin will decrease within the time specified on the countdown timer. This prediction is based on a quantitative analysis of the price trend.
___Please note that the specified take-profit level does not imply a prediction that the price will reach that point. In this framework of analysis and trading, unlike the stop-loss, which is mandatory, setting a take-profit level is optional. Whether the price reaches the take-profit level or not is of no significance, as the results are calculated based on the start and end times. The take-profit level merely indicates the potential maximum price fluctuation within that time frame.
LTC (Litecoin) – Swing Long Setup from Support ZoneLTC is currently pulling back into a key support area between $89 – $96, which has historically provided strong bullish reversals. The zone aligns with a potential higher low on the daily timeframe, making it a solid area for a risk-reward favorable swing long.
🔹 Entry Zone:
$89 – $96 (structural support and previous demand zone)
🎯 Take Profit Targets:
🥇 $133 – $146 (key resistance and prior local highs)
🥈 $180 – $190 (macro range highs and psychological barrier)
🛑 Stop Loss:
Hard stop at $80 (clear break of structure and invalidation of higher low)

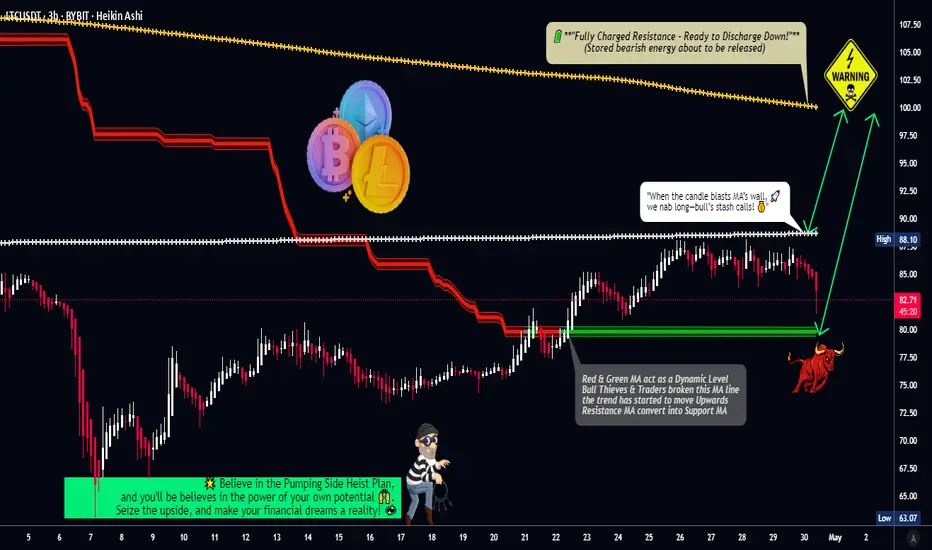
LTC/USDT "Litecoin vs Tether" Crypto Heist Plan (Day/Swing)🌟Hi! Hola! Ola! Bonjour! Hallo! Marhaba!🌟
Dear Money Makers & Robbers, 🤑 💰💸✈️
Based on 🔥Thief Trading style technical and fundamental analysis🔥, here is our master plan to heist the LTC/USDT "Litecoin vs Tether" Crypto Market. Please adhere to the strategy I've outlined in the chart, which emphasizes long entry. Our aim is to escape near the high-risk Yellow MA Zone. Risky level, overbought market, consolidation, trend reversal, trap at the level where traders and bearish robbers are stronger. 🏆💸"Take profit and treat yourself, traders. You deserve it!💪🏆🎉
Entry 📈 : "The heist is on! Wait for the MA breakout (90.00) then make your move - Bullish profits await!"
however I advise to Place Buy stop orders above the Moving average (or) Place buy limit orders within a 15 or 30 minute timeframe most recent or swing, low or high level for Pullback entries.
📌I strongly advise you to set an "alert (Alarm)" on your chart so you can see when the breakout entry occurs.
Stop Loss 🛑: "🔊 Yo, listen up! 🗣️ If you're lookin' to get in on a buy stop order, don't even think about settin' that stop loss till after the breakout 🚀. You feel me? Now, if you're smart, you'll place that stop loss where I told you to 📍, but if you're a rebel, you can put it wherever you like 🤪 - just don't say I didn't warn you ⚠️. You're playin' with fire 🔥, and it's your risk, not mine 👊."
📍 Thief SL placed at the nearest/swing low level Using the 3H timeframe (77.50) Day / Swing trade basis.
📍 SL is based on your risk of the trade, lot size and how many multiple orders you have to take.
🏴☠️Target 🎯: 100.00 (or) Escape Before the Target
🧲Scalpers, take note 👀 : only scalp on the Long side. If you have a lot of money, you can go straight away; if not, you can join swing traders and carry out the robbery plan. Use trailing SL to safeguard your money 💰.
💰💵💸LTC/USDT "Litecoin vs Tether" Crypto Market Heist Plan (Swing/Day) is currently experiencing a bullishness,., driven by several key factors. .☝☝☝
📰🗞️Get & Read the Fundamental, Macro, COT Report, On Chain Analysis, Sentimental Outlook, Intermarket Analysis, Future trend targets... go ahead to check 👉👉👉🔗🔗🔗
⚠️Trading Alert : News Releases and Position Management 📰🗞️🚫🚏
As a reminder, news releases can have a significant impact on market prices and volatility. To minimize potential losses and protect your running positions,
we recommend the following:
Avoid taking new trades during news releases
Use trailing stop-loss orders to protect your running positions and lock in profits
💖Supporting our robbery plan 💥Hit the Boost Button💥 will enable us to effortlessly make and steal money 💰💵. Boost the strength of our robbery team. Every day in this market make money with ease by using the Thief Trading Style.🏆💪🤝❤️🎉🚀
I'll see you soon with another heist plan, so stay tuned 🤑🐱👤🤗🤩

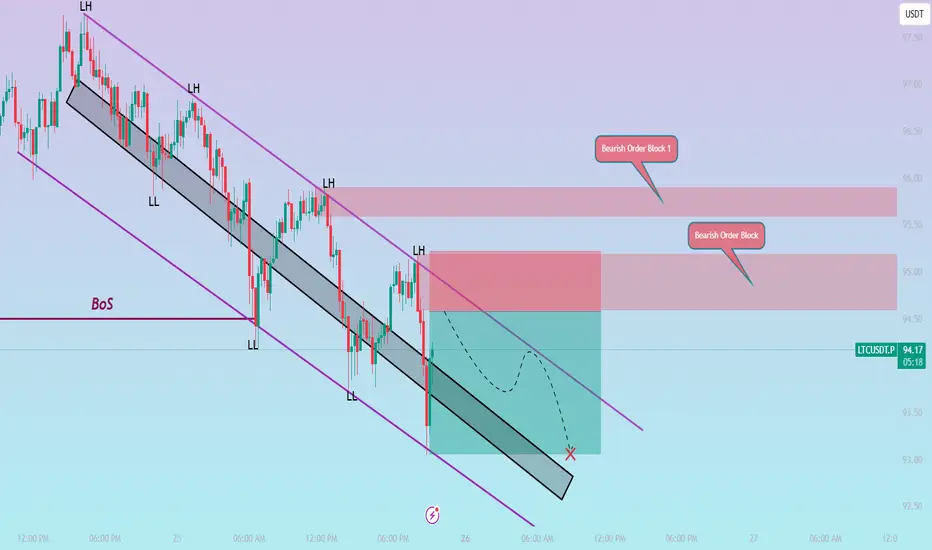
LTCUSDT / 15M / SHORTThe market is clearly in a downtrend, forming lower highs (LH) and lower lows (LL). We've got two bearish order blocks above us acting as strong supply zones:
OB 1: Between 95.58 and 95.91
OB 2: Between 94.58 and 95.20 – this is our main entry zone.
📌 Plan:
I'm waiting for price to pull back into the 94.58 - 95.20 zone (Bearish OB).
If it rejects from there, I’ll go short.
🎯 Entry: 94.58
🛑 Stop Loss: 95.22 (just above the OB)
💰 Take Profit: 93.06
💯 Risk-Reward: Solid 1:2.5 setup
🌀 Expecting a small pullback, then continuation to the downside inside the bearish channel. If it plays out well, we’ll catch the move to the lower boundary.
LTC - Super Bullish Set-UPBINANCE:LTCUSDT
𝐊𝐞𝐲 𝐋𝐞𝐯𝐞𝐥𝐬 & 𝐒𝐭𝐫𝐚𝐭𝐞𝐠𝐲:
𝐄𝐧𝐭𝐫𝐲 𝐙𝐨𝐧𝐞: 87 – 91 USDT (marked in green)
This is a demand zone where price previously found support and bounced.
𝐃𝐂𝐀 (Dollar Cost Average): 83.6 USDT
Ideal level for accumulating further if price dips below the entry zone.
𝐒𝐭𝐨𝐩 𝐋𝐨𝐬𝐬 (𝐒𝐋): 78.6 USDT
Placed below major structure support to limit downside risk.

LTCUSDT UPDATE
Pattern: Symmetrical Triangle Breakout
Current Price: \$97.32
Target Price: \$112
Target % Gain: 15.06%
Technical Analysis: LTC has broken out of a symmetrical triangle on the 8H chart. Price is pushing above descending trendline resistance with strong candle closes, indicating bullish momentum and potential upside continuation.
Time Frame: 8H

Litecoin’s Sharp Drop—Will the Downtrend Continue?FenzoFx—Litecoin dropped 6.2% yesterday, marking its largest daily range this week. It failed to hold within the High Volume Node box, and selling pressure in the Asian session pushed the price below weekly support to a new low of $89.3.
Currently, LTC/USD is consolidating near the 61.8% Fibonacci retracement level, a key resistance zone. If this level holds, the downtrend may resume, targeting weekly support levels.
Given that Litecoin has already reached its average daily range, no major moves are expected today.

LTC/USDT 4H ChartHello everyone, let's look at the 4H LTC to USDT chart, in this situation we can see how the price is moving in a specific yellow triangle, in which we can see an attempt to exit from the bottom. On the other hand, the blue lines mark the main channel of the downtrend and here we can see how the price is fighting with its upper limit, but it is a strong resistance.
Let's start by defining the goals for the near future that the price has to face:
T1 = 101 USD
T2 = 111 USD
Т3 = 124 USD
Т4 = 147 USD
Now let's move on to the stop-loss in case the market continues to fall:
SL1 = 90 USD
SL2 = 80 USD
SL3 = 63 USD
The RSI indicator shows a rebound, but the movement remains around the middle of the range, which further leaves room for a potential deepening of the rebound.

Litecoin (LTC): Waiting For Market Structure Break | Sell SetupLitecoin is approaching the bullish CME gap and testing 200EMA, where we are expecting to see some sort of rejection, which would give us a good 1:3 RR trade here.
More in-depth info is in the video—enjoy!
Swallow Academy

LTC Shows Weakness – Another Drop Ahead?LTC Shows Weakness – Another Drop Ahead?
On the 60-minute chart, Litecoin (LTC) is moving down in a choppy way, making new lower lows and pulling back deeply each time.
This pattern has happened before, and it looks like it might continue.
There's a good chance LTC will go through another downward wave soon.
The target price levels—92.60, 91.00, and 89—could also be areas where the price might bounce back up, just like it has in the past.
You may find more details in the chart!
Thank you and Good Luck!
❤️PS: Please support with a like or comment if you find this analysis useful for your trading day❤️

Litecoin (LTC): Looking For Break of Structure | Downward MoveLitecoin has a good chance of showing us some decent drops in the upcoming weeks so we are looking for a proper break of structure for now!
More in-depth info is in the video—enjoy!
Swallow Academy

LTC will this Demand Zone Trigger a Reversal or a Full Crash?Yello,Paradisers! Is this the calm before a major bounce, or the final warning before Litecoin breaks down completely? This current zone is absolutely critical ignore it, and you risk missing the next big move.
💎#LTCUSDT has completed a strong 5-wave impulsive move within an ascending channel. The recent correction has now brought the price back down into a very important demand zone near $90. This level isn’t just a random number it’s sitting right on top of a previous major support zone that held back in early April, just before the entire leg up began.
💎Price is now also testing the lower boundary of the ascending channel. As long as #Litecoin holds this demand zone between $90 and $93, the bullish structure remains intact. This could be the perfect reload zone for bigger players preparing for the next leg up. If the price begins to form higher lows from here and reclaims the $96–98 region with strength, it could open the path toward the moderate resistance at $110. And if that level breaks with momentum, we’re likely looking at a full extension into the major resistance above $115.
💎However, if #LTC closes a candle below major support at $80 with volume and structure confirming the breakdown, the setup will be invalidated. In that case, we’re potentially heading for a much deeper flush into the $72–75 range, which aligns with the next HTF liquidity pool and potential weekly support.
Stay sharp, Paradisers. The market will soon decide and if you're ready, you'll be on the right side of the move.
MyCryptoParadise
iFeel the success🌴

Litecoin (LTC): Good Chance of 16% Recovery IncomingLitecoin has multiple signs of possible recovery happening here, which could give us a good ROI with decent R:R. Bollinger Bands, RSI, and CME are aligned perfectly here!
More in-depth info is in the video—enjoy!
Swallow Team

LTC Buy / Long SetupAs price wants to move in a range, SO that's another setup for LTC, invalidation is same as for short setup, candle closing below the mention zone immediately close the trade otherwise wick doesn't matter, wick do the damage body tells the story.

Lite up and let lite do the workHi
Bullish flag target and inverse head and shoulders are close to the fib 1.618. Where reversals tend to happen
On thee daily perspective we are starting a new green candle at support after the retracment if we switch to hekin ashi candles which furthermore increases the chances of a. Bullish move