LTC, he Hidden Strength Beneath the Retrace Ma dudes, we might just be witnessing something big and beautiful here. 🤌✨
Okay okay, I might sound like a total degen, but hear me out:
✅ Double bottom (check those two green arrows)
✅ Bullish divergence on the RSI
✅ MACD on the monthly just crossed bullish — for the first time ever on this pair!
✅ OBV stayed strong, didn’t collapse even during that nasty monthly retrace
✅ Notice how volume was climbing during the uptrend, but fell off during the retrace? That means the drop lacked real conviction.
We’re also sitting at an ATL (all-time low) — the lowest we've been.
Check out that red arrow pointing at the volume: that's the first sign of a burst. The next bursts? 💥 They should be explosive.
…And that’s just to name a few.
See you somewhere up there 🚀 — once we break through that T1 level, we should start trending higher fast.
That's it, that's the idea" - Good night !
LTCUSDT trade ideas

LTC Swing Long Setup - Positioning Early for BreakoutLimit swing long placed on LTC based on consolidation above higher timeframe support and compression below a descending trendline. The setup targets a potential breakout continuation, with defined invalidation and a clear take profit ladder. Risk is tight, reward to risk is strong, and capital protection is included.
I am entering before full confirmation due to the price squeezing near support. I accept the chance of a failed breakout in return for early entry and better reward to risk.
The setup combines both daily and one hour timeframes. The daily shows structure holding above support and pressing into the trendline. On the one hour chart, the 0.236 Fibonacci level has held after an impulsive move, with high volume support around 84 to 85. A higher low is forming locally.
Limit Swing Long LTC.
Entry: $84.25
Stop-Loss: $81.70
Total risk: 1% of account capital.
TP1: $86.80 (30% – early profit, reduce risk). Move SL to $84.7.
TP2: $91.70 (40% – take out most capital)
TP3: $103 (20% – trend continuation)
TP4: $124 (10% – moonshot runner)
Take profit one locks in gains and reduces exposure. Take profit two is the main target near resistance. Take profits three and four aim for continuation if the breakout develops. Stop loss is placed below structural support and the 0.236 Fibonacci level, far enough to avoid noise but close enough to protect capital.
DISCLAIMER: I am not providing trading signals or financial advice. The information shared here is solely for my own documentation and to demonstrate my trading journey. By openly sharing my process, I aim to put pressure on myself to stay focused and continually improve as a trader. If you choose to act on any of this information, you do so at your own risk, and I will not be held responsible for any outcomes. Please conduct your own research and make informed decisions.

#LTC Update #2 – July 5, 2025🟣 #LTC Update #2 – July 5, 2025
Yesterday, I pointed out that Litecoin was in a dangerous zone — not ideal for long or short entries. Since that update, LTC dropped another 4 percent, validating the caution I shared.
Right now, I still don’t see a clear opportunity for either direction. I believe LTC will make a decisive move within the next 24 hours, likely a sharp breakout or breakdown, unless a major external catalyst intervenes.
Here’s how I view potential support levels:
🔴 First stop: $85.5
🔴 Second stop: $82.5
🔴 Third stop: $77
Until direction becomes clear, I won’t be entering any trades. I’m watching closely.
If you're holding a profitable position, I’d consider taking partial profits here.

LTC Short SetupWait for the entry and execute, SL is smaller and if candle closes strongly above the zone then must close the trade. Hopefully it won't break easily this zone as bearish fvg + bearish order block lies here.

LTC Buy / Long SetupAs price wants to move in a range, SO that's another setup for LTC, invalidation is same as for short setup, candle closing below the mention zone immediately close the trade otherwise wick doesn't matter, wick do the damage body tells the story.

LTC/USDT Weekly – Massive Breakout Loading? 3-Year Triangle
📌 Litecoin is now standing at one of its most crucial technical levels since the 2021 bull run. After 3 years of compression inside a massive symmetrical triangle, price action is nearing a major breakout point. Will LTC finally explode upward, or are bears still in control? Let’s break it down!
🧠 Technical Pattern: Long-Term Symmetrical Triangle
This is a classic pattern that signals a prolonged phase of buyer-seller equilibrium, where lower highs and higher lows converge into a point of tension. Historically, this type of formation often ends in a sharp breakout in either direction.
🔺 Pattern Duration: Since May 2021
🔺 Converging trendlines: Tightening into Q3/Q4 2025
🔺 Historical breakout probability: ~60-75% chance of upward breakout in symmetrical triangles
🟢 Bullish Scenario (Upside Breakout):
If LTC breaks above the upper triangle resistance (~$100 – $115) with strong volume, it could ignite a major rally due to:
✅ The end of a multi-year consolidation
✅ Renewed investor confidence and potential altcoin season
✅ Technical confirmation of breakout from a long-term base
🎯 Upside Targets:
$134.66 – Psychological resistance and minor horizontal supply zone
$230.13 – Major resistance area from 2022 breakdown
$280.87 – Fib extension & key structural level
$325.00 – Pre-blowoff level from 2021
$387.91 – All-Time High (ATH) retest zone
📌 Based on the triangle’s base projection, a technical target of ~$280+ is plausible if breakout confirms.
🔴 Bearish Scenario (Downside Breakdown):
If LTC fails to hold the rising support (~$85), it may trigger a strong bearish reaction, especially if Bitcoin also loses key support levels.
📉 Downside Levels to Watch:
$65.00 – Key horizontal support
$49.00 – $39.00 – Historical demand zone from early 2020
$23.90 – Pandemic-era low (extreme bearish target)
📌 Breakdown confirmation requires a weekly close below support with high volume, ideally accompanied by macro risk-off sentiment.
🧩 Key Confirmations to Watch For:
1. Volume Surge on Breakout – Is the move supported by strong volume?
2. Successful Retest – Does price retest the breakout level as support?
3. Momentum Indicators – Weekly RSI > 50 and MACD bullish crossover can strengthen conviction.
📊 Fundamental & Sentiment Context:
Litecoin halving occurred in August 2023. Historically, price rallies follow 6–12 months after.
Often dubbed the “digital silver”, LTC remains relevant during altcoin cycles.
Whale accumulation has increased slowly since late 2024—possibly indicating long-term positioning.
✅ Conclusion & Strategy:
Litecoin is like a technical time bomb waiting to explode. Traders and investors should prepare for both breakout and breakdown scenarios. Patience and confirmation are key. Don’t chase—let the chart speak first.
🎯 Plan the trade, trade the plan. Don’t FOMO into noise—wait for structure!
#LTCUSDT #LitecoinBreakout #CryptoTechnicalAnalysis #SymmetricalTriangle #BullishSetup #AltcoinSeason #Litecoin2025 #CryptoChart #TrianglePattern #LitecoinRally

LTC 900$ Litecoin
An open source decentralised digital currency that enables fast and borderless transactions.
Classic currencies
It has been on an upward trend since its launch
It is moving within an ascending price channel
Despite all the negativity in the market, it has maintained the channel and respected the price
At any moment, the launch could begin, perhaps coinciding with the announcement of ETF acceptance
I wish everyone abundant profits.
Like and follow
for more.

Litecoin ProphecyOne of the oldest coins, with zero down time:
Litecoin, one of the most undervalued altcoins out there for the following reasons:
- zero down time
- silver to gold narrative
- most used for payments
- ETF incoming
According to TA, we should see $600-$700 shortly, then retrace back to previous ATHS ($400). From there, infinite ($1k+).
Be in or miss out.

Litecoin (LTC): Good Long Opportunity with 1:4 RRLitecoin has the potential to give us a decent 1.4 position right here if we manage to break that 200EMA line, which has been holding the price back for quite some time!
More in-depth info is in the video—enjoy!
Swallow Academy

Litecoin (LTC): Break of Resistance | Buyers DominatingLitecoin is showing signs of a possible bounce that we might be taking very soon. While we had a successful breakout here, we also see with the current retest price showing signs of recovery, where buyers are not giving the current zone away easily.
More in-depth info is in the video—enjoy!
Swallow Academy

Litecoin (LTC): Reached The Zone of EMAs | Very Good Buy Area?Litecoin had reached a local zone of EMAs where we are now looking for proper upwards movement from this region.
More in-depth info is in the video—enjoy!
Swallow Academy

The Chart Is Ugly. The Setup Is Beautiful. Welcome to the TrapI’m gonna try to keep it short (try, lol).
If you’re new here or just stumbled on this, here’s what you need to know:
LTC is the King of Pain… and the Prince of Parabolas.
It’s one of the hardest coins to hold — maybe the hardest.
It’ll test your patience, shake your conviction, and make you doubt everything...
right before it delivers.
Looking at the chart, LTC printed a bearish head-and-shoulders pattern.
But guess what? That’s PROBABLY the final trap — the one that triggers those explosive moves right after... the start of the parabolic season.
In my humble opinion, yeah — we MIGHT still drop more depending on what BTC does. But if you’re reading this and wondering what things look like before a big breakout — well, it’s exactly this:
Ugly charts, bearish structures, everyone doubting… and then boom — a new beginning. A rise.
That May move from $81 to $107? That was the breakout.
What we’re in now? It’s the bear trap.
What comes next? Should be something we’ve never seen before. I’ll leave it at that.
Some fundamentals:
LTC:
Hash-rate? Went parabolic — price hasn’t caught up yet.
Top 5 most used digital assets for moving value (by volume).
Born in 2011. 100% uptime. Still standing, still in the top 20. Survived it all.
Only 84M LTC will ever exist. Scarcity is real.
78% of LTC addresses are holding for over a year. They’re not selling cheap.
MWEB = optional privacy.
LiteVM = next-gen programmability for LTC.
Oh, and don’t forget: potential ETF approval.
If there’s one digital asset with a real shot — it’s LTC. Already declared a commodity by the CFTC.
Over 7 years of consolidation. If you zoom out to the monthly+ timeframe, all the bull and bear noise looks like one big sideways base.
Just to name a FEW.
Absurdly undervalued. Criminally underperforming.

Litecoin (LTC): We Are Looking For Re-Test and 48% of PumpLitecoin has a good chance of retesting the recently broken EMAs area, where once we are going to see a smaller correction, we will be looking for the price to push and gain at least 40-48% of market price movement.
More in-depth info is in the video—enjoy!
Swallow Academy

LTC/USDT Heist Alert: Bullish Loot Before the Trap! 🚨 LTC/USDT HEIST ALERT: Quick Bullish Raid Before the Trap! (Thief Trading Plan) 🚨
🌟 Greetings, Market Robbers! 🌟
Hola! Ola! Bonjour! Hallo! Marhaba! 🤑💰💸
🔥 Thief Trading Analysis signals a bullish LTC/USDT heist opportunity! Our plan? Enter long, escape near high-risk zones before bears ambush weak hands. Fast profits = less risk! 🏆💸
🎯 Heist Strategy (LTC/USDT Swing/Day Trade)
📈 Entry:
*"Vault is open! Swipe bullish loot at any price—but for a smoother steal, set buy limits near 15M/30M swing lows."*
🛑 Stop Loss:
📍 Thief SL at latest 4H swing low (adjust for risk/lot size).
📍 Multiple orders? Don’t get caught—size SL wisely!
🏴☠️ Target: 114.00 (or escape early if momentum fades!)
💥 Why LTC/USDT?
Bullish momentum (scalping/day trade).
USDT pairs = stablecoin safety (no USD volatility risk).
Liquidity + tighter spreads (cleaner executions).
⚠️ Heist Safety Protocol
🚨 News = Danger Zone! Avoid new trades during releases.
🔐 Trailing stops = Lock profits, dodge reversals.
💖 Boost the Heist!
💥 Smash the Like & Boost 💥 to fuel our robbery crew! More boosts = more profitable heists! 🚀🤝
Stay tuned—next heist coming soon! 🤑🐱👤

Litecoin (LTC): Sellers Are Taking Over | Breakdown IncomingLitecoin is seeing a strong dominance from sellers, where recently we filled one of the major CME gaps that was of concern for us. Now we might actually go for a breakdown here and get a nice 1:3 RR setup from it.
More in-depth info is in the video—enjoy!
Swallow Academy

Litecoin ETFs Target $199 Followed by $283 Followed by...It will definitely go higher but, let's do it step by step. Litecoin is setting itself to move up with targets being first $199 and then $283, these are the main targets for this bullish jump.
It will go higher of course but the market tends to fluctuate, never straight down but also never straight up. It advances nicely and then stops, a stop that you sense can last only a few days can result in a correction lasting more than an entire month. When you see this happening, you question yourself, "Why didn't I sell when prices were up?"
And the same pattern repeats; over and over, again and again. Now, Litecoin will produce a new bullish wave. The retrace can last 3 weeks rather than 6 weeks. It can last 12 weeks rather than 6 weeks, I don't know. So, instead of being 100% right or 100% wrong, we can sell portions at each target and just be happy/grateful with the results. Or, we can plan ahead... Focus on maximizing profits because Litecoin is ready to grow, the continuation of the bullish move; the next "leg-up."
» Litecoin Exchange-Traded Fund (LTC ETF).
Do you think this is bullish? Think about Bitcoin's ETFs results. It can be mixed at first, volatility, but the end is always bullish. Strongly bullish. Hyper-bullish. Litecoin is very small compared to Bitcoin. It can be a major boom!
Thanks a lot for your support.
Namaste.

LTCUSDTLTCUSDT is showing a bearish setup. Although a bullish divergence was formed, it was not respected, and the price continued its downward trend, indicating a potential bearish trade opportunity.

LTC analysis.Give me some energy !!!So if you pay attention to the LTC chart you can see that the price has formed a Ascending FLAG or wedge which means it is expected to price move as equal as the measured price movement.( AB=CD )
NOTE: wait for break of the FLAG .
Best regards CobraVanguard.💚

LTCUSDT Short Setup from Range ResistanceLTCUSDT is trading near a key resistance level at $85.74, which marks the upper boundary of a clearly defined consolidation range. After multiple rejections in this zone, the price has once again failed to break higher — signaling potential downside pressure.
A short entry has been placed at $85.74, targeting the bottom of the range near $82.37, while the stop loss is placed just above the most recent swing highs at $86.84.
This setup is based on a range-trading strategy, with price respecting both support and resistance levels repeatedly.
🧩 Trade Parameters:
- Entry: $85.74
- Stop Loss: $86.84
- Take Profit: $82.37
🔢 Risk:Reward Calculation:
- Risk: 86.84 - 85.74 = $1.10
- Reward: 85.74 - 82.37 = $3.37
- Risk:Reward Ratio: 1 : 3.06 ✅ (Excellent)
✅ Bias:
Bearish rejection at range resistance
🔄 Confirmation:
- Clear rejection candle at the top of the range
- Failure to close above $86
- Momentum shift on lower timeframes
❌ Invalidation:
Break and hold above $86.84 — indicates range breakout or trend reversal

$LTC/USDT Trade Setup 6H Chart.$LTC/USDT Trade Setup 6H Chart.
- Entry: CMP
- Stop Loss: $76.20
Target:
TP 1:- $93.95
TP 2:- $85.65
LTC is bouncing off a long-term trendline support with an early MACD bullish crossover.
DYRO, NFA

$LTC Coiling Up for a Massive Breakout – 95% Move Loading?NYSE:LTC is consolidating inside a symmetrical triangle and approaching the apex.
Currently holding around the $84 level, showing signs of compression as volatility drops.
If bulls manage to break out above the $89–$90 resistance zone,
we could trigger a strong move toward the $160 zone, that’s nearly a 95% upside potential from here!
This breakout could be big, patience is key here.
#LTC

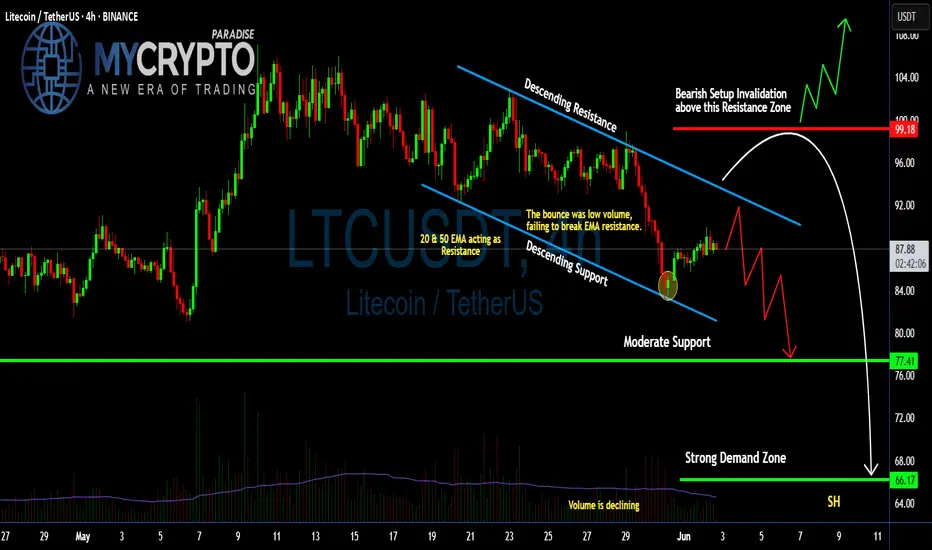
Can #LTC Bulls Make Recovery or Bears will Continue to Dominate?Yello Paradisers! Are you ready for the next wave of #LTC that can catch many traders off guard? Let's see the latest setup of #Litecoin and what can happen next:
💎#LTCUSDT is currently trapped inside a descending channel, signaling sustained bearish pressure. The most recent bounce came with declining volume and failed to reclaim the 20 & 50 EMA — a clear sign that bulls are running out of steam. These EMAs are now acting as dynamic resistance, capping every upward attempt.
💎The #LTCUSD structure remains bearish as long as the price stays below the key resistance zone near $92.00, especially under $99.18, which marks the invalidation of the bearish setup. If that zone is broken convincingly with huge volume, we could see a short squeeze toward $104.00. Until then, the bias will stay on the downside.
💎Support at $77.41 might offer temporary relief, but if sellers break through that level, all eyes will shift to the strong demand zone at $66.17 — a region that has historically attracted high-volume buying and could serve as a potential bounce area.
💎Volume continues to decline, showing that momentum is fading with each bounce. This increases the probability of a breakdown continuation unless the trendline resistance is flipped with strength and backed by volume. Right now, the chart shows weakness, not reversal.
Stay disciplined. The next big opportunity will come to those who wait not those who chase.
MyCryptoParadise
iFeel the success🌴
Litecoin LTC price analysisToday we will analyze the third candidate for ETF in the near future is CRYPTOCAP:LTC
An old coin, good fundamentals, 1:1 tokenomics like CRYPTOCAP:BTC but 4 times more coins, untapped potential, and the list goes on...
♎️ The main difference from the previous two candidates is the current market cap of the coins: CRYPTOCAP:XRP - $118 billion, CRYPTOCAP:SOL - $72 billion, #Litecoin only $6 billion
Accordingly, the prospects for growth in the price of OKX:LTCUSDT are many times greater
🔥 Currently, #LTCUSD price is near the potential purchase zone of $71.25-76.25
📈 Growth potential of at least $170-180
🐻Critical level of $67
_____________________
Did you like our analysis? Leave a comment, like, and follow to get more
