Buy LitecoinAfter some time of accumulation price is making higher highs, price broke the last high and the backed up to test it again, its a good place to open a long position with low risk.
LTCUSDT trade ideas

LTC USDT Long Phemex LTC Current set up. Keep an Eye on this one. I believe that it will be a lead indication on when the next run is about to happen.

H&S Forming on the Daily This is just my 2 cents on the LTC chart, going over the 106 and closing a few daily candles above it for confirmation will invalidate the H&S or if we break and close below 70

💎 LITECOIN (LTC) - New Investment Opportunities ! LONG ? With the new review of the #Litecoin chart after a long time, we see that the price is trading in the demand range of $80 and I expect it to start its strong growth soon from this range! The targets of this cryptocurrency are $92.5, $115, $200 and $268 respectively! The expected yield in the long term is something around 200%!
Please support me with your likes and comments to motivate me to share more analysis with you and share your opinion about the possible trend of this chart with me !
Best Regards , Arman Shaban

LTCThe momentum price has not yet completed its upward trajectory and can reach $95 on the daily timeframe and above $100 in the coming weeks. What do you think? Do you think the recent market drop was a correction or a continuation of the upward trend?


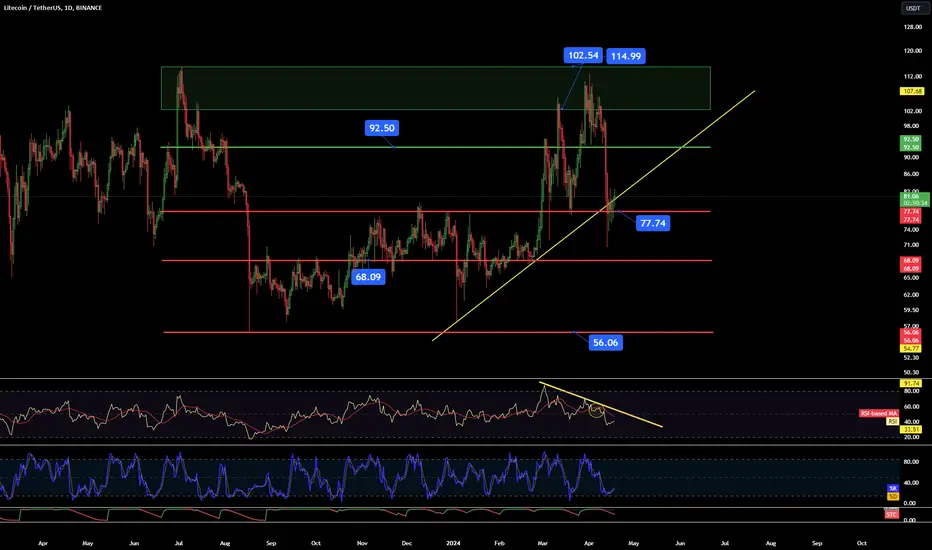
LTC/USDT 1DInterval ChartHello everyone, let's take a look at the LTC to USDT chart on a one-day time frame. As you can see, the price had a dynamic decline and a temporary descent below the upward trend line, but has now returned to the trend line level.
Let's start by determining the support line and as you can see, the price dropped and quickly returned to support around the level of $77.74, then there is an important support level at $68, and then a very strong support level at $56.
Looking the other way, you can see how strong the resistance level is again at $92.5, which may stop the price from rising again to the resistance zone from $102.5 to $115.
Looking at the RSI indicator, we can see how we remain in a downward trend and the confirmation of a return to the downward trend, while the STOCH indicator bounced off the lower end of the range with room to give a greater increase in the current price rebound.
LTCBULLISH MID TERMas we see previous bull cycle i think in tha last 3 month of LTC USDT would be so bullish like it can easily hit 400$ accumulate it. there would be one more opportunity around around 60$

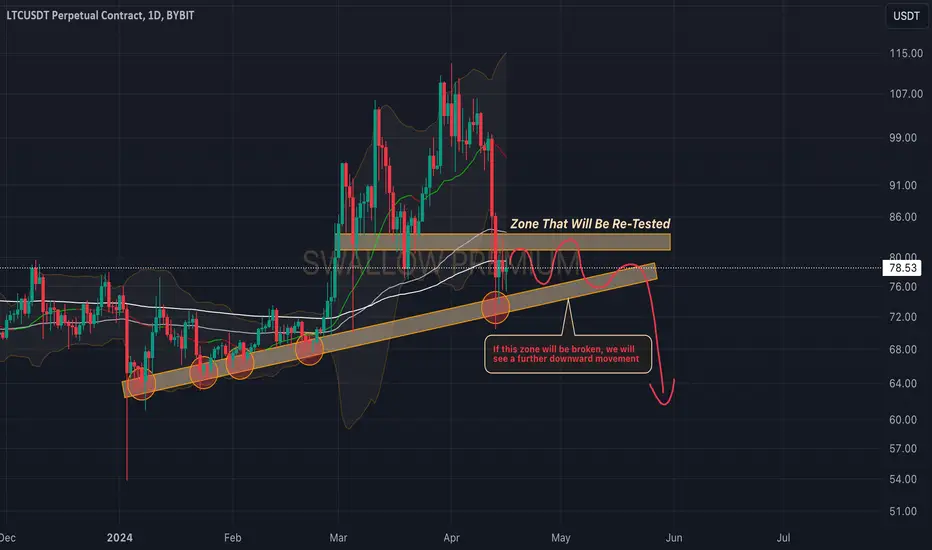
Litecoin(LTC): Possible Further Move To Lower ZonesLitecoin is the first one that caught our attention with a breakdown of both 100 and 200 EMA. We are also seeing that the price has stopped (the dump) just near the Litecoins trend line, which has rejected the price as of now.
We see a price to move inside that triangle formation for a while before further movement to lower zones (if we see a breakdown of that trend).
Swallow Team
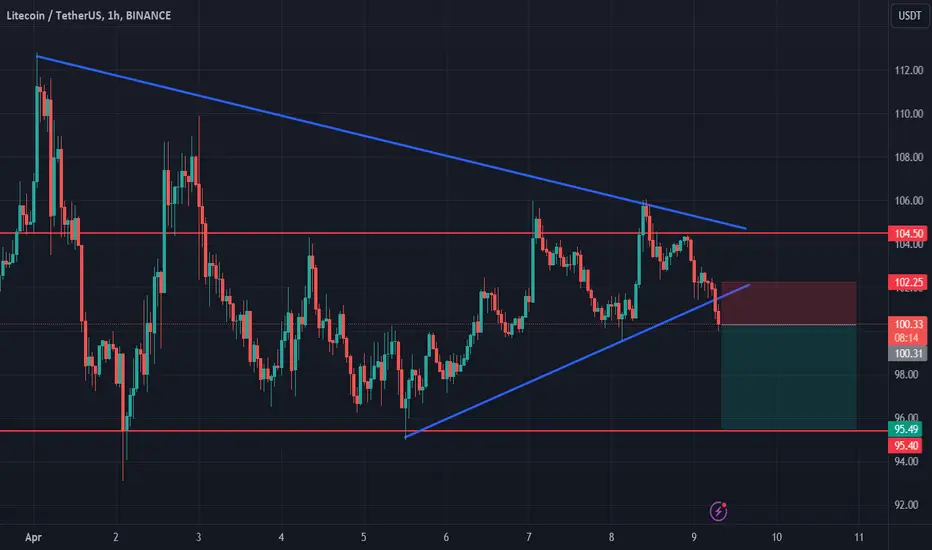
LTC is going to be bearish soonAfter being rejected from the horizontal resistance, the price is now retesting above the symmetrical triangle. A successful retest above the triangle can be interpreted as a bullish indication, potentially signaling further upward momentum. Conversely, a failed retest would reinforce bearish sentiment, suggesting the potential for continued downward movement.

one more push before bears take over? 🤔may push past this resistance zone and hit the target above before we see some big profit taking! lots of better risk reward on other alts too.. bears may take over soon
boost and follow for more! ❤️🔥

Litecoin LTC price is preparing a surprise for us?)Today, let's talk about Litecoin.
Once upon a time, CRYPTOCAP:LTC was called "silver" of course after CRYPTOCAP:BTC "gold", and gave more hope and prospects for CRYPTOCAP:LTC than CRYPTOCAP:ETH at about the same then price of $6-9 per coin :)
Now the "conspiratorial talks" around Litecoin are resuming again. As if the chance that LTC ETFs will be the next to be accepted is higher than ETH ETFs. This is attributed to the fact that LTC has the same halving cycle as BTC, and in general, they have more in common than BTC and ETH.
Do you believe this?) Write in the comments.
Now, what do we see on the #LTCUSDT chart?
- The price has been holding up quite well lately, so if it stays above $100, there will be a good chance for continued growth to $130-140
- If the correction in the crypto market continues with greater force, then LTC could fall to $70
In general, the #LTCUSD price is moving very "hard" and trades are taking a long time to work out
But that's the price for low-risk and low-volatility trading.
But if you believe that the LTC ETF will be next, then buying LTC in the range of $70-80 with the prospect of rising to $250 or even $295 is a good idea.
_____________________
Did you like our analysis? Leave a comment, like, and follow to get more

LTCUSDT investment ideaHi traders,
Let's have a look at LTCUSDT chart on weekly timeframe.
The price remains above the upsloping support and it seems that there's a lot of support horizontally as well.
We expect the price to increase from where it's now or drop 10 % to retest the upsloping support line one more time. Overall, we expect the price to go much higher in the next months.
We have 3 targets which are shown on the chart. If the price drops lower, it may retest 40 $ or even 20 $ but it will be a great opportunity to load up on Litecoin for the long-term investment.

Will Litecoin Start The Rise Rally? LTCUSDTLTC Analysis
As long as Litecoin stays above the $77 support outlined in the analysis, it will want to launch its bullish movement.
As long as LTC stays above the $73.46 support, it will want to make its bullish move to $92.32 levels.
We made an extra addition to our $88 purchases in LTC, at $77. We are carrying a loaded LTC spot, we will hold it as long as it stays over $65.

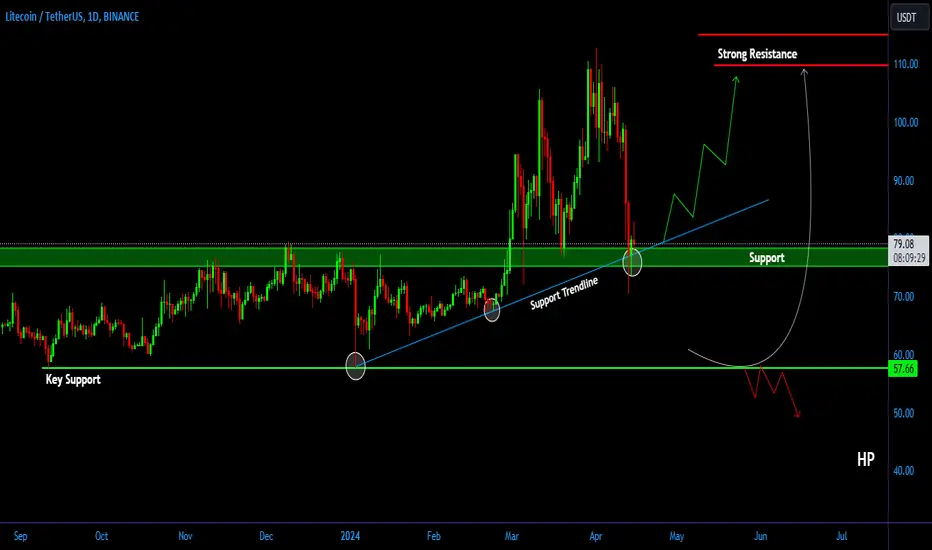
LTC/USDT in the crucial area need to bounce for back to upward!💎 Paradisers, the recent market movements of #LTC have certainly drawn attention. LTC finds itself at a critical juncture, teetering on crucial support.
💎 A successful bounce from this support could reignite upward momentum, potentially leading to a retest of strong resistance areas.
💎 However, should LTC fail to find support and breach both the critical support level and the support trendline, it would signal a concerning shift toward downward momentum. Such a scenario could prompt a descent towards key support areas to establish a new trajectory.
💎 Upon reaching these critical support levels, a decisive bounce is imperative for LTC to reclaim ground and reignite upward momentum. Reclaiming the price above the $80 support area would be pivotal for LTC to resume its upward trajectory toward our target.
💎 Should this scenario falter and LTC breach the key support level, it would likely prolong downward momentum, leading to further declines.
MyCryptoParadise
iFeel the success🌴
LTC LONG SETUP ALL trading ideas have entry point + stop loss + take profit + Risk level.
hello Traders, here is the full analysis for this pair, let me know in the comment section below if you have any questions, the entry will be taken only if all rules of the strategies will be satisfied. I suggest you keep this pair on your watchlist and see if the rules of your strategy are satisfied. Please also refer to the Important Risk Notice linked below.
Disclaimer


Litecoin(LTC): On The Verge To Breakdown!Litecoin is looking for a potential breakdown of the local support zone (which is also at the 100EMA line).
After seeing a nice rejection from the "double top" pattern, we have been pressing that lower zone (support), and now it seems about to be broken. Look closely into it for any clen breakdowns!
Swallow Team

LTCUSDT spotCARB harmonic has been activated after last night big candle entries the gold box below with red line as your 2.0 fib as your stop loss. Happy trading

NO ONE IS TALKING ABOUT LITECOIN UNTIL THIS HAPPENS - SCENARIO 1
For now, Litecoin seems like a forgotten coin until this happens just like I posted BINANCE:SHIBUSDT (see analysis below) few months ago before the breakout of the range we see recently, such I think will be the case of KRAKEN:LTCUSDT .
I have few just two major scenario and this is the first one. According to Elliot Wave Theory, looking at the chart for this scenario it seems like we will be breaking out of this range in coming weeks or late next month (May).
Litecoin is very different from other ALTCOINS it is kind of stable and goes at it own pace. more reason why I believe more in this scenario following it journey in the ASCENDING CHANNEL. (see other scenario on page)
OTHER ANALYSIS

Litecoin shortLitecoin broke trough the support level. Asset broke trough the ascending trendline. Bearish movement to support level at 95.5 is possible.
Litecoin short term short to range lowsLitecoin looks like it could return to range lows before further upside

Buy after accumulationLTCUSDT has been accumulating for a while if the analysis is correct, we are now in the las phase of the accumulation
