LTCUSDT - Movess?LTCUSDT have moves to be seen prior to anymoves to be taken in consideration! A small pull move down then to up!
LTCUSDT trade ideas

Litecoin (LTC): Looking Bad Now, But Has Good Potential Litecoin is in bad shape, where sellers are showing pressure, which could lead to bigger downward movement.
Despite that, we are still above the local neckline area, so we are still bullish, for now!
More in-depth info is in the video—enjoy!
Swallow Academy

LTC: Long 15/06/25BINANCE:LTCUSD.P
Trade Direction:
LTC Long
Risk Management:
- Risk halved as weekend
- Risk is 0.5%
- Stop loss placed below recent swing low / invalidation level
Reason for Entry:
- H1 bullish divergence teasing. Not yet confirmed but I received a alert for its potential formation
- Trendline sweep and bullish reclaim (bear trap)
- H1 Hammer Candle
- H1 Ts
- H1 Trend is bullish and far more so then other coins = 0.5% risk
Additional Notes:
- Risk this is a Sunday scam move before further down. If its a bull trap I'm trapped for 0.5% risk.
- Potential that we trend up till NYO which supports my original idea on btc that we would trend higher on markets until btc reached 106,500 - 107,200
- Targeting upside around 106,500 to 107,200 on BTC when BTC enters that region i'll monitor LTC for TP Zone
- H4 candle overbought, monitoring structure closely

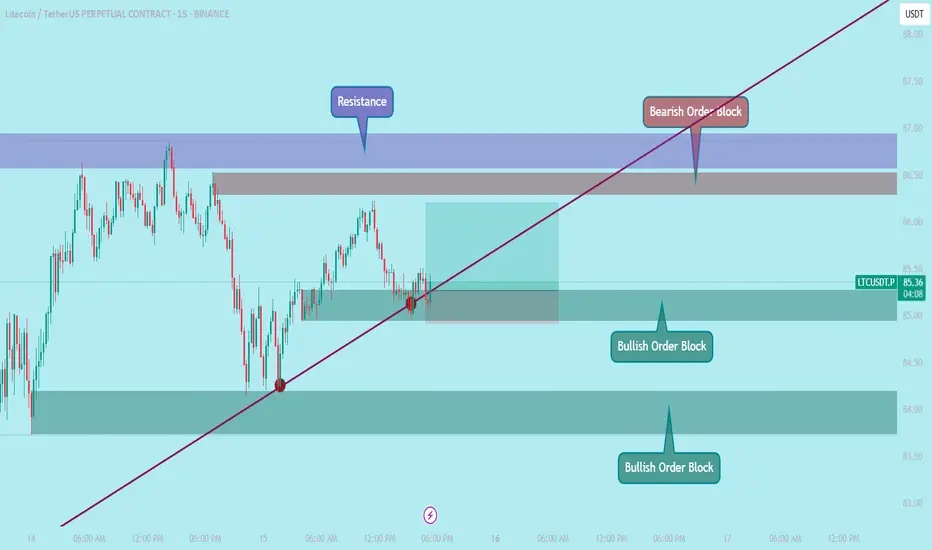
LTCUSDT / 15M / BUY🔹 Entry: 85.28 (Market Execution)
🎯 Target (TP): 86.20
🛑 Stop Loss (SL): 84.91
📊 Risk-Reward Ratio (RRR): ~1:2.49
Took this trade based on a clean confluence of Smart Money Concepts (SMC) and Price Action.
Price respected the bullish order block and trendline support on the 15M chart — signs of strong demand stepping in.
Expecting a move towards the bearish OB near 86.20.
Let’s see how the market plays out… setup looks solid and RRR is worth the risk.
Trust the process & manage risk properly.
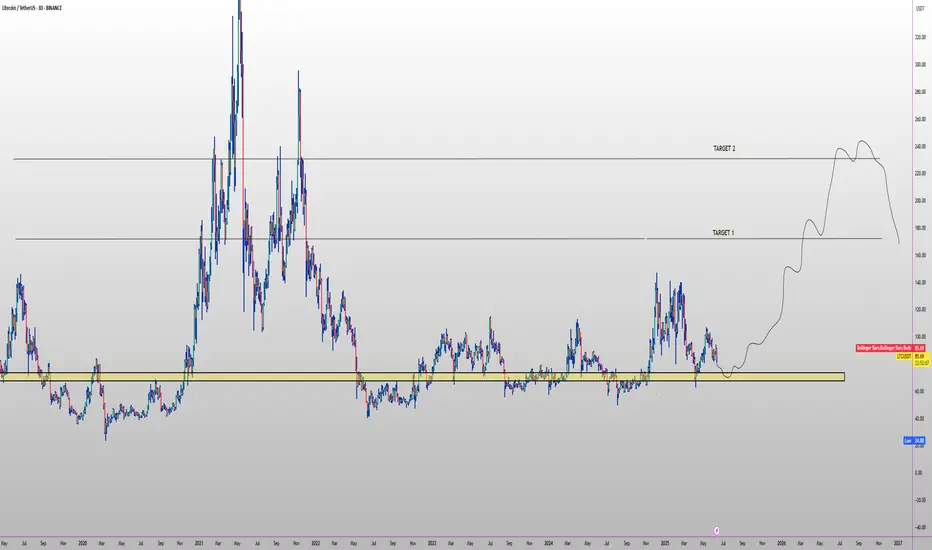
LTC TARGETS FOR Q3🔥 CRYPTOCAP:LTC swing setup (3D) 🚀
✅ Entry Zone: $70 – $77 (multi-year demand)
🎯 Targets
• TP-1: $180 (2021 breakdown line)
• TP-2: $240 (2020-21 pivot)
⛔ Stop-Loss
3-day close < $66
📊 Thesis
• #1 payment coin on BitPay in 2024-25 (201 K tx > BTC & ETH)
• Active addresses +28 % YoY; record 92.8 M on-chain tx in 2024
• 27 % of transfers now use MWEB privacy layer 🔒
• SEC verdict on a spot-Litecoin ETF due 2025 🏛️
• Post-halving rallies average +300 % within 18 m — 2023 halving “digestion” almost done 😈
Litecoin (LTC): Looking for Breakout + Targets to be ReachedLitecoin has done very well recently, where the current price is testing the branch of EMAs, where we are expecting to see a breakout, after which we will be looking for upward movement toward our first and second targets.
Swallowa Acaademy

LTC - This is how a Wyckoff Spring look like when reading SI Reading the chart: Location, Structure, Speed Index and Plutus signals
Annotations in sync with the chart.
1. Major Fib
2. Support
3. Breaking Support with a false break - Fast wave = low Speed Index 1.1
4. Down wave, price has a hard time to move down = high Speed Index 2.9 (buyers absorbing sell orders)
5. Entry a Wyckoff Spring WS signal from Plutus
.... and up we go!!!

Litecoin —It's All In Your Mind, Time To DecideTruly the longest consolidation phase has been experienced, since June 2022 until June 2025. This consolidation produced a broad channel for Litecoin but, make no mistake, this is a trading range.
The difference between a rising channel where consolidation is happening and a very strong bull market is the slope of the rise. The bull market price action produces a much stronger rise, as shown by the bars pattern.
The action becomes more erratic to the upside rather than stable and sideways. The market becomes euphoric because people cannot handle all the money they hold. Your account balance grows and grows and grows, so much that you lose all control. So much that you forget it, so much that you don't take action and then everything is gone.
It is incredible but still, many people do take advantage and those are mainly the ones with experience.
The first time we get it wrong. That's ok, we've all been there, nobody to blame rookie mistake.
The second time we do better but we still feel we could have done even better. If only we had more organization, more time to prepare; more experience...
The third time... This is the third time.
Thousands of millionaires are created in each bull market, tends of thousands, are you going to be one of those?
There is no competition. For you to make money nobody else has to lose money it doesn't work that way. It is different; the market gives, the market takes.
If you are ready to accept a lot the market will give you a lot.
If you are here to lose money the market will take everything away.
It is not about the whales, the bots or the exchange... It is all about you, it is all in your mind.
Some people join the last few days and make millions by buying big and selling right away, over and over. Some people lose millions by going LONG going SHORT when the market is neither going down or up. Some people are playing games.
You just need to decide, consciously and unconsciously what is your true goal. If you want financial independence, financial abundance, financial freedom, just make your choice. Say it, write it, see it, feel it... Believe it, and everything you want will be yours.
There is no limit other than your own mind.
The market will give you whatever you are ready to accept.
If you work for 10 millions dollars, that's exactly what you will get. But, if you work for 100 millions, hundreds you will get. There is no limit. It is all in your mind.
Namaste.

LTC/USDT Elliott WavesTrade will be activated if price breakes through wave 4 of the ending diagonal(88.19) with 1st target 85.33 and 2nd target 84.55.Until then,just waiting.

LTCUSDT 1D AnalysisLTC ~ 1D Analysis
#LTC Buy after successfully breaking this resistance line with a short term target of at least 10%+ from here.

Litecoin’s Sharp Drop—Will the Downtrend Continue?FenzoFx—Litecoin dropped 6.2% yesterday, marking its largest daily range this week. It failed to hold within the High Volume Node box, and selling pressure in the Asian session pushed the price below weekly support to a new low of $89.3.
Currently, LTC/USD is consolidating near the 61.8% Fibonacci retracement level, a key resistance zone. If this level holds, the downtrend may resume, targeting weekly support levels.
Given that Litecoin has already reached its average daily range, no major moves are expected today.

LTCUSD 4h time frame analysishi
Today we are analysing Litecoin on 4 hour timeframe
Litecoin are currently trading at $95
We see the parallel downwards sloping channel perceiving 'the flag' starting at the swing high at the resistance line shown.
The price is pulling back slightly, making lower highs.
Enter a long position when there is a breakout, when the price breaks above the upper resistance line.
Technical target: 120$

LTCUSDT UPDATE
Pattern: Symmetrical Triangle Breakout
Current Price: \$97.32
Target Price: \$112
Target % Gain: 15.06%
Technical Analysis: LTC has broken out of a symmetrical triangle on the 8H chart. Price is pushing above descending trendline resistance with strong candle closes, indicating bullish momentum and potential upside continuation.
Time Frame: 8H

#LTC/USDT#LTC
The price is moving within a descending channel on the 1-hour frame, adhering well to it, and is heading for a strong breakout and retest.
We are seeing a bounce from the lower boundary of the descending channel, which is support at 92.48.
We have a downtrend on the RSI indicator that is about to be broken and retested, supporting the upward trend.
We are looking for stability above the 100 moving average.
Entry price: 97.44
First target: 100.24
Second target: 102.45
Third target: 105.26

LTC Consolidates After Taking the Buy Side LiquidityFenzoFx—Litecoin surged to $99.5 in the Tokyo session but failed to hold gains, dropping below $97.85. LTC/USD is now consolidating at $96.60, with sellers gaining control.
Since LTC has already exceeded its daily range, a further pullback is expected. The weekly low zone of $93.50–$93.00 could offer a low-risk buy entry.
The bullish outlook remains intact as long as LTC holds above $93.00, with targets at $96.5 and $97.88 this week.

LTC - Super Bullish Set-UPBINANCE:LTCUSDT
𝐊𝐞𝐲 𝐋𝐞𝐯𝐞𝐥𝐬 & 𝐒𝐭𝐫𝐚𝐭𝐞𝐠𝐲:
𝐄𝐧𝐭𝐫𝐲 𝐙𝐨𝐧𝐞: 87 – 91 USDT (marked in green)
This is a demand zone where price previously found support and bounced.
𝐃𝐂𝐀 (Dollar Cost Average): 83.6 USDT
Ideal level for accumulating further if price dips below the entry zone.
𝐒𝐭𝐨𝐩 𝐋𝐨𝐬𝐬 (𝐒𝐋): 78.6 USDT
Placed below major structure support to limit downside risk.

LTC/USDT 4H ChartHello everyone, let's look at the 4H LTC to USDT chart, in this situation we can see how the price is moving in a specific yellow triangle, in which we can see an attempt to exit from the bottom. On the other hand, the blue lines mark the main channel of the downtrend and here we can see how the price is fighting with its upper limit, but it is a strong resistance.
Let's start by defining the goals for the near future that the price has to face:
T1 = 101 USD
T2 = 111 USD
Т3 = 124 USD
Т4 = 147 USD
Now let's move on to the stop-loss in case the market continues to fall:
SL1 = 90 USD
SL2 = 80 USD
SL3 = 63 USD
The RSI indicator shows a rebound, but the movement remains around the middle of the range, which further leaves room for a potential deepening of the rebound.

Litecoin Bullish Continuation Confirmed, Last Chance ($200 Next)Litecoin grew 69% from its April correction bottom and currently trades 54% higher from this low point, the retrace was very, very small. A small retrace means that there is no sellers pressure. Lack of sellers pressure means plenty of room available for growth in the coming weeks and months. People are not willing to sell their Altcoins (Litecoin). As soon as the market goes bullish, which is now within days, this will produce massive interest and a strong bullish wave.
Litecoin is set to grow now as the action turns green. Weeks of consolidation and nothing changes, the chart structure remains perfectly bullish.
This is a time sensitive update. The retrace is over. The wait is over. Crypto is going up.
It is better to be in now, "buy like it is the end of the world."
It is better to be in the market now, 100% in, because the next advance will be so strong you will not believe it until it is fully done. Litecoin will hit the highest prices in years, the same for Polkadot, Notcoin and the other pairs that I shared daily @MasterAnanda. The time is now.
This advance will be so great, that everybody will turn their attention to the Cryptocurrency market. It will affect mainly the Altcoins. Everything that has been neglected for years will be recover and hit the highest prices in a long while. Multi-years high.
You've been warned.
Namaste.

Litecoin Wave Analysis – 27 May 2025- Litecoin reversed from key support level 92.65
- Likely to rise to resistance level 100,00
Litecoin cryptocurrency recently reversed from the key support level 92.65 (which stopped the previous minor correction (2) earlier in May).
The support level 92.65 was strengthened by the 50% Fibonacci correction of the previous upward impulse 5 from the start of May.
Litecoin cryptocurrency can be expected to rise to the next round resistance level 100,00, which stopped the previous correction B.

LTCUSDTThe tool watches for a strong upward move (called the flagpole).
Then it looks for a small pullback or sideways move (called the flag).

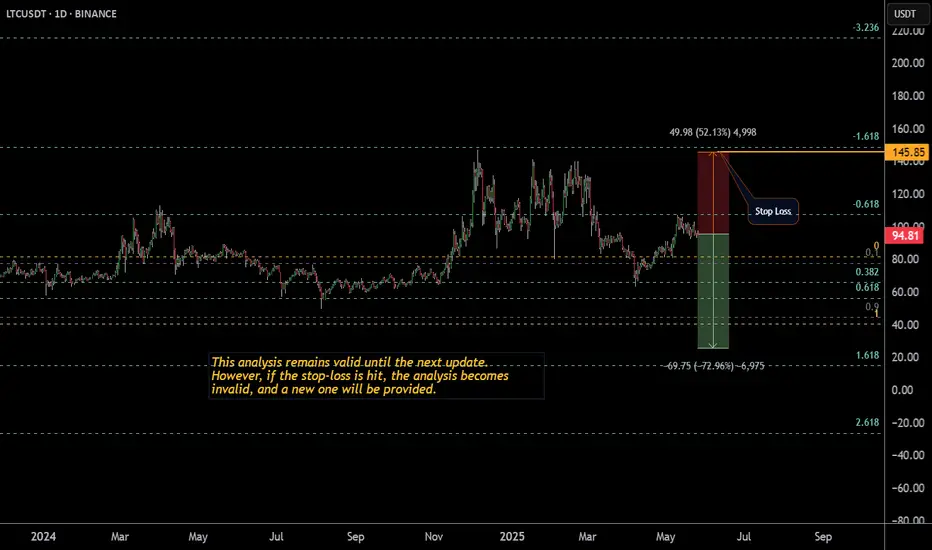
Litecoin-LTCUSD Analysis-Issue 85 (Free Access)The analyst believes that the price of Litecoin will decrease within the time specified on the countdown timer. This prediction is based on a quantitative analysis of the price trend.
___Please note that the specified take-profit level does not imply a prediction that the price will reach that point. In this framework of analysis and trading, unlike the stop-loss, which is mandatory, setting a take-profit level is optional. Whether the price reaches the take-profit level or not is of no significance, as the results are calculated based on the start and end times. The take-profit level merely indicates the potential maximum price fluctuation within that time frame.
LTC (Litecoin) – Swing Long Setup from Support ZoneLTC is currently pulling back into a key support area between $89 – $96, which has historically provided strong bullish reversals. The zone aligns with a potential higher low on the daily timeframe, making it a solid area for a risk-reward favorable swing long.
🔹 Entry Zone:
$89 – $96 (structural support and previous demand zone)
🎯 Take Profit Targets:
🥇 $133 – $146 (key resistance and prior local highs)
🥈 $180 – $190 (macro range highs and psychological barrier)
🛑 Stop Loss:
Hard stop at $80 (clear break of structure and invalidation of higher low)

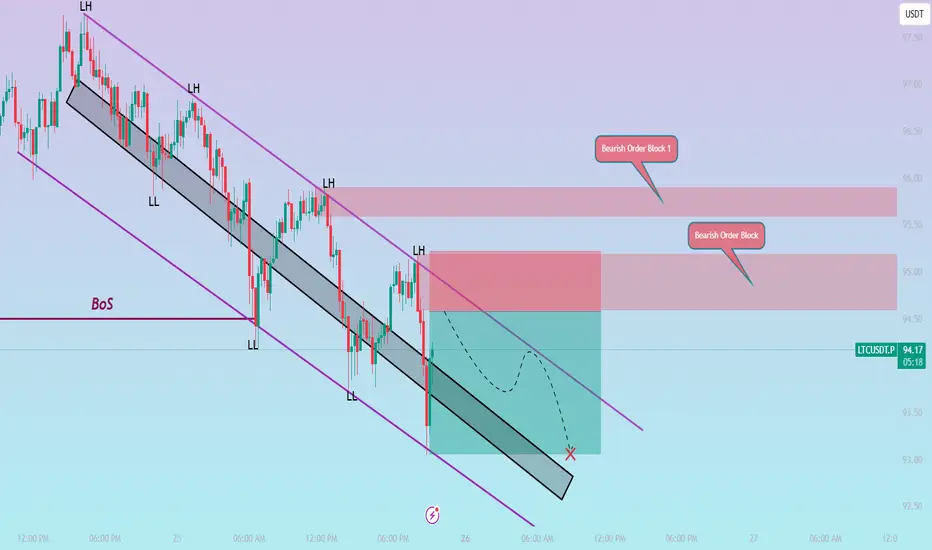
LTCUSDT / 15M / SHORTThe market is clearly in a downtrend, forming lower highs (LH) and lower lows (LL). We've got two bearish order blocks above us acting as strong supply zones:
OB 1: Between 95.58 and 95.91
OB 2: Between 94.58 and 95.20 – this is our main entry zone.
📌 Plan:
I'm waiting for price to pull back into the 94.58 - 95.20 zone (Bearish OB).
If it rejects from there, I’ll go short.
🎯 Entry: 94.58
🛑 Stop Loss: 95.22 (just above the OB)
💰 Take Profit: 93.06
💯 Risk-Reward: Solid 1:2.5 setup
🌀 Expecting a small pullback, then continuation to the downside inside the bearish channel. If it plays out well, we’ll catch the move to the lower boundary.